The “Nessie” Nebula: Cluster Formation in a Filamentary Infrared Dark Cloud
Abstract
The “Nessie” Nebula is a filamentary infrared dark cloud (IRDC) with a large aspect ratio of over 150:1 (1.5∘ 0.01∘, or 80 pc 0.5 pc at a kinematic distance of 3.1 kpc). Maps of HNC (1–0) emission, a tracer of dense molecular gas, made with the Australia Telescope National Facility Mopra telescope, show an excellent morphological match to the mid-IR extinction. Moreover, because the molecular line emission from the entire nebula has the same radial velocity to within km s-1, the nebula is a single, coherent cloud and not the chance alignment of multiple unrelated clouds along the line of sight.
The Nessie Nebula contains a number of compact, dense molecular cores which have a characteristic projected spacing of 4.5 pc along the filament. The theory of gravitationally bound gaseous cylinders predicts the existence of such cores, which, due to the “sausage” or “varicose” fluid instability, fragment from the cylinder at a characteristic length scale. If turbulent pressure dominates over thermal pressure in Nessie, then the observed core spacing matches theoretical predictions. We speculate that the formation of high-mass stars and massive star clusters arises from the fragmentation of filamentary IRDCs caused by the “sausage” fluid instability that leads to the formation of massive, dense molecular cores. The filamentary molecular gas clouds often found near high-mass star-forming regions (e.g., Orion, NGC 6334, etc.) may represent a later stage of IRDC evolution.
1 Introduction
When infrared dark clouds (IRDCs) were originally identified as dark extinction features against the Galactic background at mid-IR wavelengths (Perault et al., 1996; Egan et al., 1998; Carey et al., 1998, 2000; Hennebelle et al., 2001), it was not clear what role, if any, they might play in the process of star formation. Their high column densities (– cm-2), together with their cold temperatures ( K) suggest that if stars do form within IRDCs, then IRDCs must comprise an early phase in the process; otherwise the embedded stars would have heated their surrounding gas and dust. Recently, compact molecular cores within IRDCs have been found to contain embedded young stars or protostars (e.g., Chambers et al. 2009). A few of these embedded young stellar objects will evolve into high-mass stars (e.g., Beuther et al. 2005; Rathborne et al. 2005, 2006, 2007; Simon et al. 2006; Pillai et al. 2006; Beuther & Steinacker 2007). This star-formation activity, along with the similarity in size and mass between IRDCs and cluster-forming molecular clumps, has led to the suggestion that IRDCs are the birthplaces of all high-mass stars and clusters (e.g., Rathborne et al. 2006; Wyrowski 2008).
One striking feature of IRDCs is their filamentary shape, evident in the images from mid-IR Galactic surveys such as MSX (Price et al., 2001), GLIMPSE (Benjamin et al., 2003), and MIPSGAL (Carey et al., 2005). Similar filamentary structures are also found in familiar examples of associated high-mass star-forming molecular clouds, such as Orion (e.g., Plume et al. 2000; Tatematsu et al. 2008; Bally et al. 1987). Because these warmer clouds bear a striking resemblance to IRDCs, the warm, star-forming filamentary clouds may represent a later evolutionary stage in the life of an IRDC. Indeed, filamentary clouds may play an important role in high-mass star formation because they allow for enhanced accretion rates onto cores (Banerjee & Pudritz, 2008; Myers, 2009).
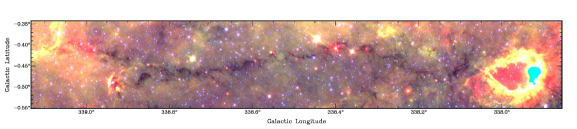
An extreme example of a filamentary IRDC is the “Nessie” Nebula centered near . Nessie is identified as a dark mid-IR extinction feature in the GLIMPSE and MIPSGAL surveys (Figure 1). If the mid-IR extinction represents a single object, then this IRDC has an unusually large aspect ratio of over 150:1 (). Nessie contains a number of extinction maxima which in other IRDCs are typically associated with pre-stellar and protostellar cores with masses of order 100 (e.g., Rathborne et al. 2006).
If the formation of IRDCs, perhaps due to the passage of a spiral shock, results in filaments, then these long, approximately cylindrical structures may produce the necessary conditions for the formation of dense molecular cores, and ultimately of clusters and high-mass stars. Indeed, the theory of gravitationally bound gaseous cylinders predicts the formation of such dense cores, which due to the “sausage” or “varicose” fluid instability, fragment from the cylinder at roughly regular intervals (e.g., Chandrasekhar & Fermi 1953; Nagasawa 1987; Inutsuka & Miyama 1992; Nakamura et al. 1993; Tomisaka 1995, 1996). This instability provides an attractive physical mechanism for high-mass star formation and cluster formation in filamentary IRDCs.
In this Letter we report on molecular line mapping of the Nessie Nebula. We compare our results with the theory of self-gravitating fluid cylinders and show that the observations broadly conform to the expectations of the “sausage” instability. We speculate that this mechanism may be important in the formation of high-mass stars and star clusters.
2 Observations
Millimeter molecular line observations of the Nessie Nebula were taken on 2008 August with the Australia Telescope National Facility (ATNF) 22 m Mopra Telescope. The backend consisted of the wideband MOPS correlator configured to observe simultaneously 16 separate passbands covering the frequency range 86 to 93 GHz. Each of these passbands was 137.5 MHz wide, with 4096 spectral channels, corresponding to a velocity resolution of 0.11 km s-1. We chose individual passbands to include molecular lines of interest. The brightest of the detected lines was HNC (1–0) (90.66 GHz). Although we detected a number of fainter molecular lines, these yield similar results and will be presented in a subsequent paper.
The nebula was mapped in the “on-the-fly” mode, in which data are collected while the telescope scans in a raster pattern. The raster rows were chosen to be perpendicular to the Galactic plane in order to avoid striping artifacts parallel to the nebula’s long axis. The spacing between rows was 12”, or about 1/3 of the Mopra beamwidth of 36” FWHM (Ladd et al., 2005). Flux calibration with a noise diode and an ambient temperature load was performed every 20 minutes.
Data reduction and analysis utilized the ATNF livedata and gridzilla programs. The individual spectra were co-added and gridded onto a uniform 15” grid. Linear baselines were removed from line-free channels. All spectra are presented on the antenna temperature () scale. To convert to main-beam brightness temperatures, one should divide the antenna temperatures by the main-beam efficiency of 0.49 (Ladd et al., 2005). System temperatures for the observations were K, which yielded a typical rms noise of K in each spectral channel.
3 Results
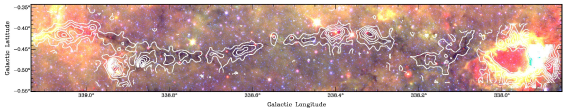
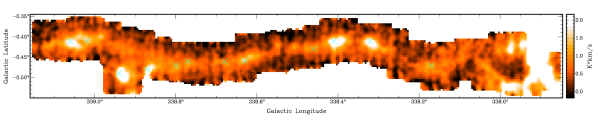
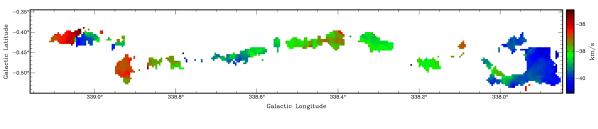
The Mopra integrated intensity HNC (1–0) maps closely correspond to the regions of mid-IR extinction (Figure 1). The map consists of fainter, uniform emission associated with the filament, upon which compact, brighter regions we call “cores” are superposed. Gaussian fits to the HNC (1–0) lines demonstrate that every position within Nessie has essentially the same radial velocity, km s-1 (Figure 1). If the Clemens rotation curve is used, this velocity corresponds to a kinematic distance of 3.1 kpc (Clemens, 1985).
The molecular cores in Nessie are often associated star-formation activity. Specifically, many cores show the presence of excess 4.5 m emission called “green fuzzies,” which indicates shocked gas (e.g., Noriega-Crespo et al. 2004; Marston et al. 2004), and bright 24 m point sources, which indicate an embedded protostar (e.g., Chambers et al. 2009).
The cores do not appear to be randomly spaced within the filament, but instead have a characteristic spacing. The filament is thus reminiscent of a string with beads that are spaced sparsely but approximately uniformly along its length. We used the clumpfind2d algorithm with a threshold of seven times the rms noise and 2.5 increments (Williams et al., 1994) on the HNC (1–0) integrated intensity map to identify 12 molecular cores (see Figure 1). The exact choice of clumpfind parameters will result in the identification of slightly more or fewer cores, but the resulting core spacing is quite insensitive to reasonable input parameters. Since the cores are relatively isolated and well separated, clumpfind works well and identifies the cores that one would tend to select by eye. The positions and selected properties of the cores are listed in Table 1. Columns 1 and 2 give the Galactic coordinates of the position of peak integrated HNC intensity in each core, Column 3 the peak HNC integrated intensity, Columns 4 and 5 the angular size and physical extent, Column 6 the LTE mass (see Section 4), and Column 7 whether or not the core contains a 24 m point source. The mean projected spacing between cores is roughly 4.5 pc.
Although we prefer to use the molecular gas clumps as our indicator of core spacing, since we thereby include pre-stellar cores, another useful indicator of cluster-forming sites would be 24 m point sources, which indicate embedded high-mass stars or protostars. Indeed, about half of the molecular cores contain 24 m point sources (see Table 1). For all of the unresolved 24 m sources associated with the nebula, we find typical spacing of 4.1 pc, a value within 10% of the molecular core spacing. Thus, both the spacing of gas clumps and of 24 m sources are in satisfactory agreement.
4 Discussion
The existence of cores that are spaced at approximately a characteristic spacing within a highly filamentary cloud is in broad agreement with the predictions of fragmentation of a self-gravitating fluid cylinder due to the “sausage” instability. The theory’s original presentation by Chandrasekhar & Fermi (1953) treated an incompressible fluid. Later refinements included an isothermal, thermally supported cylinder with various magnetic field configurations (Nagasawa, 1987; Inutsuka & Miyama, 1992; Nakamura et al., 1993; Tomisaka, 1995, 1996).
Although the fragmentation due to the “sausage” instability of a self-gravitating fluid cylinder is similar to three-dimensional Jeans collapse, there are important differences. In spherical gravitational Jeans collapse, perturbations of all wavenumbers grow at the same rate, but in cylindrical gravitational collapse perturbations with certain wavenumbers grow more quickly than others. Perturbations with the most unstable wavenumber will grow fastest, and hence overdensities (cores) will tend to form at a length scale whose wavenumber corresponds to this fastest growing mode. For a cylinder of infinite radius, this length scale is maintained even in the presence of a magnetic field parallel to the filament’s axis (Nagasawa, 1987).
The theory thus predicts (1) that multiple cores should form within a filament, and (2) that the spacing between these cores should be roughly periodic, with a characteristic length scale equal to the wavelength of the fastest growing unstable mode of the fluid instability. For an incompressible fluid, this wavelength is where is the cylinder’s radius (Chandrasekhar & Fermi, 1953). In an infinite isothermal gas cylinder, the relation is , where is the isothermal scale height given by , where is the sound speed, the gravitational constant, and the gas mass density at the center of the filament () (Nagasawa, 1987; Inutsuka & Miyama, 1992). For isothermal cylinders of finite radius surrounded by an external, uniform medium, the spacing depends on the ratio between the cylinder radius and the isothermal scale height, . For the core spacing approaches that for an infinite radius cylinder, , but for the spacing reduces to that of the incompressible case, .
We now compare the observations of Nessie to this theory under the assumption that Nessie is well approximated by an isothermal cylinder. If Nessie lies in the limit , the theory reduces to that of an incompressible fluid, and predicts cores spaced at a characteristic length scale . One can estimate the radius of Nessie from the radial extent of the sharp extinction edges evident in the GLIMPSE and MIPSGAL images. This suggests a radius of or pc at the kinematic distance of 3.1 kpc (Clemens, 1985). Thus, one would expect cores to form at a spacing of pc, in satisfactory agreement with the observations if the filament axis is mostly perpendicular to the line of sight.
If Nessie is treated as an isothermal gas cylinder with a central volume density cm-3 and K, appropriate for cold, dense, molecular gas traced by HNC (1–0) emission, then the isothermal scale height is pc. Thus, Nessie would be in the regime , and the theoretical spacing between cores should be pc. This is smaller than the observed spacing by about a factor of 5. This discrepancy may arise from the fact that turbulent pressure dominates over thermal pressure.
Theoretical studies of self-gravitating cylinders usually assume that thermal pressure is the dominant gas pressure. However, because the observed linewidths in most molecular clouds typically exceed the thermal sound speeds by large factors, turbulent pressure usually dominates over thermal pressure. If one replaces the sound speed with the velocity dispersion to account for turbulent pressure (Fiege & Pudritz, 2000), the effective scale height is increased considerably over the thermal scale height . Assuming a central volume density again of cm-3, and a FWHM linewidth of 2.5 km s-1, typically observed toward Nessie, the effective scale height is pc, which leads to a spacing of pc between the cores. Again, the theoretical prediction is in satisfactory agreement with the observations, especially since the central density and hence the scale height is uncertain. Moreover, the theoretical assumption of a uniform, isothermal cylinder (sometimes embedded in a uniform pressure external medium) is obviously idealized, and the fragmentation length scale may well differ in more realistic treatments.
The theory also predicts that self-gravitating cylinders in equilibrium have a maximum, critical linear mass density (mass per unit length along the cylinder’s axis). Above the critical value, the cylinder would collapse radially into a line. This critical linear mass density is given by ; where is the sound speed in the case of thermal support (Stodolkiewicz 1963, Ostriker 1964) and the turbulent velocity dispersion in the case of turbulent support (Fiege & Pudritz, 2000). If turbulent pressure dominates over thermal pressure in Nessie, the critical linear mass density can be estimated as , where is in units of km s-1. For typical line widths observed in Nessie ( km s-1), M⊙ pc-1. [Note that magnetic fields can alter the critical linear mass density, increasing it for poloidal fields and decreasing it for toroidal fields, but probably by small factors (Fiege & Pudritz, 2000).]
The mass per unit length in the Nessie Nebula can be estimated from the HNC (1–0) fluxes, although this estimate is difficult due to uncertainties in molecular abundances, depletion of molecules frozen onto cold dust grains, and optical depth effects. Nevertheless, assuming optically thin HNC (1–0) emission, LTE, a temperature of 10 K, and an HNC abundance of X (Tennekes et al., 2006) appropriate for cold clouds, we arrive at a typical linear mass density in Nessie of 110 M⊙ pc-1. Because this value is smaller than the maximum predicted by theory, the estimated linear mass density is consistent with theoretical expectations. Unfortunately, the reported abundances of HNC vary widely, with values for cold clouds ranging from to (Wootten et al., 1978). These HNC abundance values give rise to a wide range in the linear mass density of up to M⊙ pc-1. Future observations of the dust continuum will better constrain the linear mass density.
It is interesting to compare the value of obtained by theory and estimated in Nessie with that measured for the molecular filament associated with Orion, M⊙ pc-1, assuming M = M⊙ and pc (Bally et al., 1987). This value is within a factor of a few of that estimated for Nessie, and also smaller than the maximum value predicted by theory.
The maximum mass of the cores can also be estimated from theory. The core masses should roughly be given by . Assuming the maximum, critical value for of M⊙ pc-1 for the case of turbulent pressure support, and a spacing of 4.5 pc, one expects the cores to have maximum masses . If instead the average linear mass density of 110 M⊙ pc-1 derived for Nessie is used, the core masses should be no larger than about . For Nessie, the estimated core masses based on the integrated HNC (1–0) fluxes over the solid angles range from (Table 1).
To summarize, if turbulent pressure, rather than thermal pressure, provides the support for Nessie, the core spacing (4.5 pc) agrees with theoretical predictions. Moreover, both the linear mass density and the core masses in Nessie are also consistent with the theory, since they are comparable to, but fall below, the maximum theoretical values.
We speculate that all cluster formation arises from the fragmentation of filamentary IRDCs due to fluid instabilities that lead to massive, star-forming cores. The periodic spacing of such cores within Nessie strengthens this suggestion. Moreover, filamentary molecular gas clouds are usually associated with high-mass star-forming regions, such as Orion, and these warmer clouds bear a striking resemblance to IRDCs. Such clouds may represent a later evolutionary stage of a filamentary IRDC.
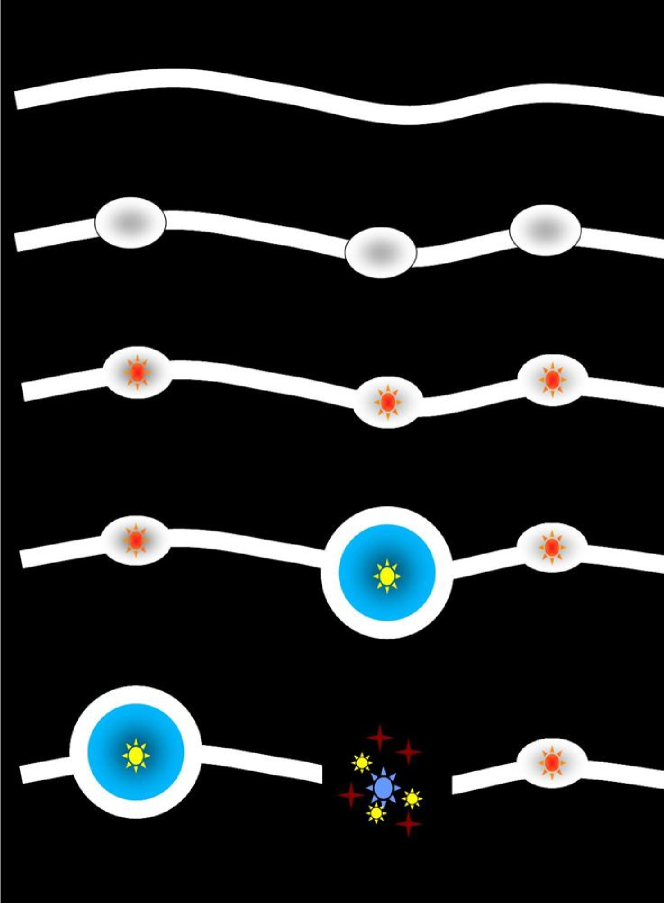
A cartoon sketch of the proposed evolution of IRDCs is given in Figure 2. Initially a filamentary IRDC is formed. The filament reaches an equilibrium configuration with a linear mass density close to the critical value. The filament then fragments due to the “sausage” instability into roughly periodically spaced cores. Such dense molecular cores have sufficiently large masses to form clusters. The mass of the cores is set by a combination of the turbulent velocity dispersion, which determines the linear mass density, and the wavelength of the fastest growing mode of the “sausage” instability. Thus, the cluster-forming core mass, and ultimately, the mass of the resulting cluster, is determined by the physics of the turbulent, self-gravitating cylindrical fluid. Within the more massive cores, high-mass protostars form. When an embedded O or an early B protostar eventually reaches the main sequence, it ionizes the surrounding gas and creates a bubble in the interstellar medium (Churchwell et al., 2006). Eventually the embedded cluster emerges.
In the earliest phases, then, filamentary IRDCs with several cores would be observed. As the regions form, bubbles would be associated with the IRDCs, and eventually the IRDC would be segmented and disrupted as the regions grow and overlap. Later, the filament would contain one or more bright clusters, and appear similar to the filamentary molecular clouds associated with high-mass star-forming regions such as Orion and NGC 6334 (Kraemer et al., 1999). Examples of each of these proposed stages can easily be found, from dark filamentary IRDCs like G, sometimes called the Snake (Carey et al., 1998, 2000), to IRDCs containing one or more bubble-like regions such as Nessie, to active high-mass star-forming regions like Orion and NGC 6334.
5 Conclusions
We have imaged a filamentary IRDC, the Nessie Nebula, in HNC (1–0) molecular line emission with the ATNF Mopra Telescope. Because the HNC (1–0) radial velocities are uniform across the filament, Nessie is a coherent, single cloud. Both HNC (1–0) and mid-IR images reveal that Nessie contains numerous dense cores, which appear to have a roughly periodic spacing of 4.5 pc.
The theory of self-gravitating, gaseous cylinders shows that they are unstable to a fluid instability, called the “sausage” instability, which causes the filament to fragment into cores with a roughly constant spacing. Thus, unlike the Jeans collapse of uniform media, the fragmentation of cylinders has a preferred length scale. Theory predicts that the fastest growing wavelength scales as the radius or the isothermal scale height of the cylinder, depending on the ratio . In the conditions thought to be appropriate to Nessie, the spacing between clumps is predicted to be 4 to 6 pc, in good agreement with the observed spacing of 4.5 pc.
Because of the ubiquity of the association between filamentary molecular clouds and high-mass star forming regions, it is tempting to suggest that the physics of molecular filaments has a profound influence on cluster formation. Indeed, such filaments may be a necessary initial condition to form dense cluster-forming cores with the observed properties. We speculate that the “sausage” instability may be the dominant physical mechanism to produce cores from filamentary IRDCs. We suggest an evolutionary sequence in which filamentary IRDCs fragment into cores, which in turn spawn star clusters and high-mass stars. Thus, familiar high-mass star-forming clouds such as Orion may have begun their lives as filamentary IRDCs.
References
- Bally et al. (1987) Bally, J., Lanber, W. D., Stark, A. A., & Wilson, R. W. 1987, ApJ, 312, L45
- Banerjee & Pudritz (2008) Banerjee, R. & Pudritz, R. E. 2008, in Astronomical Society of the Pacific Conference Series, Vol. 387, Massive Star Formation: Observations Confront Theory, ed. H. Beuther, H. Linz, & T. Henning, 216–+
- Benjamin et al. (2003) Benjamin, R. A., Churchwell, E., Babler, B. L., Bania, T. M., Clemens, D. P., Cohen, M., Dickey, J. M., Indebetouw, R., Jackson, J. M., Kobulnicky, H. A., Lazarian, A., Marston, A. P., Mathis, J. S., Meade, M. R., Seager, S., Stolovy, S. R., Watson, C., Whitney, B. A., Wolff, M. J., & Wolfire, M. G. 2003, PASP, 115, 953
- Beuther et al. (2005) Beuther, H., Sridharan, T. K., & Saito, M. 2005, ApJ, 634, L185
- Beuther & Steinacker (2007) Beuther, H. & Steinacker, J. 2007, ApJ, 656, L85
- Carey et al. (1998) Carey, S. J., Clark, F. O., Egan, M. P., Price, S. D., Shipman, R. F., & Kuchar, T. A. 1998, ApJ, 508, 721
- Carey et al. (2000) Carey, S. J., Feldman, P. A., Redman, R. O., Egan, M. P., MacLeod, J. M., & Price, S. D. 2000, ApJ, 543, L157
- Carey et al. (2005) Carey, S. J., Noriega-Crespo, A., Price, S. D., Padgett, D. L., Kraemer, K. E., Indebetouw, R., Mizuno, D. R., Ali, B., Berriman, G. B., Boulanger, F., Cutri, R. M., Ingalls, J. G., Kuchar, T. A., Latter, W. B., Marleau, F. R., Miville-Deschenes, M. A., Molinari, S., Rebull, L. M., & Testi, L. 2005, in Bulletin of the American Astronomical Society, Vol. 37, Bulletin of the American Astronomical Society, 1252–+
- Chambers et al. (2009) Chambers, E. T., Jackson, J. M., Rathborne, J. M., & Simon, R. 2009, ApJS, 181, 360
- Chandrasekhar & Fermi (1953) Chandrasekhar, S. & Fermi, E. 1953, ApJ, 118, 116
- Churchwell et al. (2006) Churchwell, E., Povich, M. S., Allen, D., Taylor, M. G., Meade, M. R., Babler, B. L., Indebetouw, R., Watson, C., Whitney, B. A., Wolfire, M. G., Bania, T. M., Benjamin, R. A., Clemens, D. P., Cohen, M., Cyganowski, C. J., Jackson, J. M., Kobulnicky, H. A., Mathis, J. S., Mercer, E. P., Stolovy, S. R., Uzpen, B., Watson, D. F., & Wolff, M. J. 2006, ApJ, 649, 759
- Clemens (1985) Clemens, D. P. 1985, ApJ, 295, 422
- Egan et al. (1998) Egan, M. P., Shipman, R. F., Price, S. D., Carey, S. J., Clark, F. O., & Cohen, M. 1998, ApJ, 494, L199+
- Fiege & Pudritz (2000) Fiege, J. D. & Pudritz, R. E. 2000, MNRAS, 311, 85
- Hennebelle et al. (2001) Hennebelle, P., Pérault, M., Teyssier, D., & Ganesh, S. 2001, A&A, 365, 598
- Inutsuka & Miyama (1992) Inutsuka, S.-I. & Miyama, S. M. 1992, ApJ, 388, 392
- Kraemer et al. (1999) Kraemer, K. E., Deutsch, L. K., Jackson, J. M., Hora, J. L., Fazio, G. G., Hoffmann, W. F., & Dayal, A. 1999, ApJ, 516, 817
- Ladd et al. (2005) Ladd, N., Purcell, C., Wong, T., & Robertson, S. 2005, Publications of the Astronomical Society of Australia, 22, 62
- Marston et al. (2004) Marston, A. P., Reach, W. T., Noriega-Crespo, A., Rho, J., Smith, H. A., Melnick, G., Fazio, G., Rieke, G., Carey, S., Rebull, L., Muzerolle, J., Egami, E., Watson, D. M., Pipher, J. L., Latter, W. B., & Stapelfeldt, K. 2004, ApJS, 154, 333
- Myers (2009) Myers, P. C. 2009, ApJ, 700, 1609
- Nagasawa (1987) Nagasawa, M. 1987, Progress of Theoretical Physics, 77, 635
- Nakamura et al. (1993) Nakamura, F., Hanawa, T., & Nakano, T. 1993, PASJ, 45, 551
- Noriega-Crespo et al. (2004) Noriega-Crespo, A., Morris, P., Marleau, F. R., Carey, S., Boogert, A., van Dishoeck, E., Evans, II, N. J., Keene, J., Muzerolle, J., Stapelfeldt, K., Pontoppidan, K., Lowrance, P., Allen, L., & Bourke, T. L. 2004, ApJS, 154, 352
- Ostriker (1964) Ostriker, J. 1964, ApJ, 140, 1056
- Perault et al. (1996) Perault, M., Omont, A., Simon, G., Seguin, P., Ojha, D., Blommaert, J., Felli, M., Gilmore, G., Guglielmo, F., Habing, H., Price, S., Robin, A., de Batz, B., Cesarsky, C., Elbaz, D., Epchtein, N., Fouque, P., Guest, S., Levine, D., Pollock, A., Prusti, T., Siebenmorgen, R., Testi, L., & Tiphene, D. 1996, A&A, 315, L165
- Pillai et al. (2006) Pillai, T., Wyrowski, F., Menten, K. M., & Krügel, E. 2006, A&A, 447, 929
- Plume et al. (2000) Plume, R., Bensch, F., Howe, J. E., Ashby, M. L. N., Bergin, E. A., Chin, G., Erickson, N. R., Goldsmith, P. F., Harwit, M., Kleiner, S., Koch, D. G., Neufeld, D. A., Patten, B. M., Schieder, R., Snell, R. L., Stauffer, J. R., Tolls, V., Wang, Z., Winnewisser, G., Zhang, Y. F., Reynolds, K., Joyce, R., Tavoletti, C., Jack, G., Rodkey, C. J., & Melnick, G. J. 2000, ApJ, 539, L133
- Price et al. (2001) Price, S. D., Egan, M. P., Carey, S. J., Mizuno, D. R., & Kuchar, T. A. 2001, AJ, 121, 2819
- Rathborne et al. (2005) Rathborne, J. M., Jackson, J. M., Chambers, E. T., Simon, R., Shipman, R., & Frieswijk, W. 2005, ApJ, 630, L181
- Rathborne et al. (2006) Rathborne, J. M., Jackson, J. M., & Simon, R. 2006, ApJ, 641, 389
- Rathborne et al. (2007) Rathborne, J. M., Simon, R., & Jackson, J. M. 2007, ApJ, 662, 1082
- Simon et al. (2006) Simon, R., Jackson, J. M., Rathborne, J. M., & Chambers, E. T. 2006, ApJ, 639, 227
- Stodólkiewicz (1963) Stodólkiewicz, J. S. 1963, Acta Astronomica, 13, 30
- Tatematsu et al. (2008) Tatematsu, K., Kandori, R., Umemoto, T., & Sekimoto, Y. 2008, PASJ, 60, 407
- Tennekes et al. (2006) Tennekes, P. P., Harju, J., Juvela, M., & Tóth, L. V. 2006, A&A, 456, 1037
- Tomisaka (1995) Tomisaka, K. 1995, ApJ, 438, 226
- Tomisaka (1996) Tomisaka, K. 1996, PASJ, 48, 701
- Williams et al. (1994) Williams, J. P., de Geus, E. J., & Blitz, L. 1994, ApJ, 428, 693
- Wootten et al. (1978) Wootten, A., Evans, II, N. J., Snell, R., & vanden Bout, P. 1978, ApJ, 225, L143
- Wyrowski (2008) Wyrowski, F. 2008, in Astronomical Society of the Pacific Conference Series, Vol. 387, Massive Star Formation: Observations Confront Theory, ed. H. Beuther, H. Linz, & T. Henning, 3–+
| Coordinates | Peak Integrated HNC | Angular Size | Physical Extent | Mass | 24 m Point Source? | |
|---|---|---|---|---|---|---|
| l° | b° | (K km s) | (arcmin2) | (pc2) | ( ) | |
| 338.17 | -0.47 | 1.15 | 3 | 2 | 80 | Y |
| 338.32 | -0.41 | 2.19 | 7 | 6 | 250 | Y |
| 338.41 | -0.41 | 2.26 | 9 | 7 | 320 | Y |
| 338.46 | -0.43 | 1.03 | 2 | 1 | 50 | |
| 338.63 | -0.46 | 1.42 | 4 | 4 | 130 | |
| 338.68 | -0.46 | 0.99 | 1 | 1 | 30 | |
| 338.77 | -0.46 | 1.14 | 2 | 1 | 40 | |
| 338.8 | -0.47 | 1.2 | 4 | 4 | 110 | |
| 338.87 | -0.48 | 2.24 | 6 | 5 | 220 | |
| 338.94 | -0.49 | 3.05 | 10 | 8 | 390 | Y |
| 339.02 | -0.41 | 1.47 | 7 | 6 | 220 | |
| 339.06 | -0.41 | 2.02 | 9 | 7 | 310 | Y |