Browsing the sky through the ASI Science Data Centre Data Explorer Tool
Abstract
We present here the Data Explorer tool developed at the ASI Science Data Center (ASDC). This tool is designed to provide an efficient and user-friendly way to display information residing in several catalogs stored in the ASDC servers, to cross-correlate this information and to download/analyze data via our scientific tools and/or external services. Our database includes GRB catalogs (such as Swift and Beppo-SAX), which can be queried through the Data Explorer. The GRB fields can be viewed in multiwavelength and the data can be analyzed or retrieved.
Keywords:
Astronomy databases, algorithms for data visualization:
95.80.+p, 07.05.Rm1 Introduction
Data Explorer is a tool which allows the user to navigate through the ASDC and external catalogs and provides an easy way to access data. It can be accessed through the ASDC home page (www.asdc.asi.it), from the ’Quick Look Data’, ’Multi mission Archive’ and ’Tools’ main menu tabs, and from the ’Archive Explorer’ panel.
2 Getting Started
If you reach the Data Explorer, you have made a query to the ASDC system for a specific source or set of coordinates. The source position in the sky is displayed on the top right corner of fig. 1. The input coordinates are shown at the top of the page and below the graphic frame, enclosed in a yellow, red-bordered rectangle. These coordinates are given both in RA/Dec (decimal and sexagesimal) and l/b systems, and represent the center of a 60X60 arcmin box opened by default.
This graphical box displays all the sources collected in the ASDC default catalogs. These sources can be listed clicking the ’Source list’ link below the grafical box. Information about each source can also be gathered moving the mouse on the circle corresponding to that specific source.The default catalogs can be viewed clicking the ’i’ tab close to ’Default catalogs’.
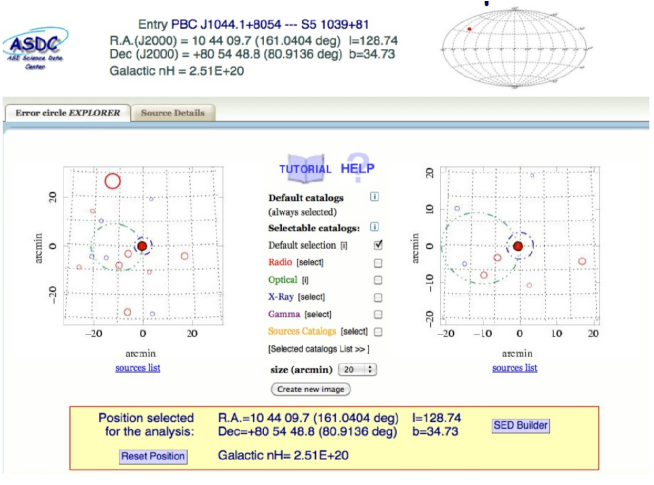
3 Refining the search criteria
The database search can be refined. Queried catalogs can be selected using the central panel in the figure below. ASDC selectable catalogs are listed by band (from lower to higher energies) and can be selected clicking the corresponding link. The list of chosen catalogs can be retrieved using the ’Selected catalogs List’ button. A full list of all selectable catalogs is also supplied.
In addition, clicking on a specific source on the left panel, will cause the coordinates in the lower box to change. The ’Create new image’ button will generate a new plot (right panel) centered on the new position. The spatial coverage of the right plot can be adjusted using the ’size (arcmin)’ toolbox. Further centerings can now be performed also clicking on the right plot. Source colors refer to catalogs according to their wavelengths, coherently with the central panel colors. The red cross in the right box represents the original set of coordinates. Finally, the new query can also be executed on a new graphical window, and a spectral energy distribution for the selected source can be accessed by clicking the ’SED Builder’ tab, located in the right region of the rectangular yellow box. The SED tool tutorial can be found at: http://tools.asdc.asi.it/SED/docs/SEDTool-Tutorial.pdf
4 Additional services
The ’Search ASDC Catalogs’ panel (fig. 2, top) allows the user to browse the internal catalogs (grouped by energy band) for sources around the current coordinates, in a user-defined search radius. The ’Search Other Services’ panel queries external databases using the current coordinates and in a user-defined search radius. Both services display the results in a new window.
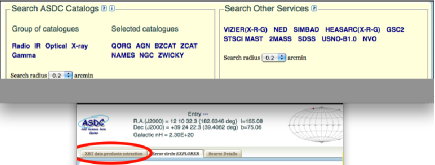

5 Access to public data archives
The quick data viewer (fig. 2, right) allows the user to search and download data from specific missions/databases in a user-defined search radius around the current coordinates. Missions and databases are ordered from top to bottom as the energy band decreases.
6 Data Explorer and GRBs
In the GRB framework Data Explorer can be used to: i) quickly check the coordinates of GRB triggers to verify the presence of possible counterparts at all wavelength bands and thus recognize triggers from known, variable sources; ii) examine the GRB fields to search for host galaxies, host candidates or possible intervening absorbers on the line of sight; iii) access the BeppoSAX and Swift archives to retrieve data and/or perform (red ellipses in fig. 2) a quick online analysis (see Stratta et al. 2010, these proceedings for a tutorial of the Swift/XRT online analysis that can be performed at the ASDC website).
7 Credits
Data Explorer is a tool provided by the ASI Science Data Centre. For any bug or request please refer to: http://www.asdc.asi.it/feedback_all. If you need assistance: http://swift.asdc.asi.it/helpdesk/login.php?cat=generic. The full documentation can be found at: http://www.asdc.asi.it/tutorial/DataExplorer/DataExplorerTutorial.html