The Atacama Cosmology Telescope: Extragalactic Sources at 148 GHz in the 2008 Survey
Abstract
We report on extragalactic sources detected in a 455 square-degree map of the southern sky made with data at a frequency of 148 GHz from the Atacama Cosmology Telescope 2008 observing season. We provide a catalog of 157 sources with flux densities spanning two orders of magnitude: from 15 mJy to 1500 mJy. Comparison to other catalogs shows that 98% of the ACT detections correspond to sources detected at lower radio frequencies. Three of the sources appear to be associated with the brightest cluster galaxies of low redshift X-ray selected galaxy clusters. Estimates of the radio to mm-wave spectral indices and differential counts of the sources further bolster the hypothesis that they are nearly all radio sources, and that their emission is not dominated by re-emission from warm dust. In a bright ( mJy) 148 GHz-selected sample with complete cross-identifications from the Australia Telescope 20 GHz survey, we observe an average steepening of the spectra between 5, 20, and 148 GHz with median spectral indices of , , and . When the measured spectral indices are taken into account, the 148 GHz differential source counts are consistent with previous measurements at 30 GHz in the context of a source count model dominated by radio sources. Extrapolating with an appropriately rescaled model for the radio source counts, the Poisson contribution to the spatial power spectrum from synchrotron-dominated sources with flux density less than 20 mJy is .
Subject headings:
surveys — radio continuum: galaxies — galaxies: active — cosmic background radiation1. INTRODUCTION
Large ( square-degrees) millimeter-wave surveys are beginning to probe arcminute angular scales, corresponding to spatial frequencies . At these small angular scales, the fluctuations in the extragalactic sky temperature become dominated by emission from galaxies and the thermal Sunyaev-Zel dovich (SZ) effect from galaxy clusters (Sunyaev & Zel’dovich, 1970), rather than primordial fluctuations in the Cosmic Microwave Background (CMB).
The predominant extragalactic point sources of emission at 148 GHz (2.0 mm) are active galactic nuclei (AGN) and dusty, star-bursting galaxies. AGN detected at 148 GHz are characterized by a synchrotron-dominated spectrum extending to lower radio frequencies. On the other hand, dusty, star-bursting galaxies at 148 GHz display a grey body spectrum increasing with frequency into the submillimeter. The source of 148 GHz flux from AGN is synchrotron emission concentrated near the central accreting super massive black hole while for dusty star-bursting galaxies the millimeter flux is sourced by re-emission from dust that is heated primarily by prodigious star formation. While the millimeter emission from the majority of dusty star-bursting galaxies is below the nominal flux density limits of current large-scale surveys, a recent 150 and 220 GHz study by Vieira et al. (2010) using the South Pole Telescope identifies a sub-population of these sources with anomalously high fluxes which likely belong to a rare, lensed population of high-redshift dusty galaxies (Negrello et al., 2007; Lima et al., 2010). It follows that current and future wide-area millimeter surveys will identify important sub-populations of core-exposed, radio-loud AGN and lensed dusty galaxies. With the members of these sub-populations identified, detailed follow-up studies will help us better understand these high-energy states of galaxy formation as well as their important role in providing energy feedback to their environments.
Because source emission is a significant contributor to the overall sky brightness at small scales, the characterization of extragalactic sources is essential for interpreting the primary CMB anisotropies and the SZ signal from galaxy clusters. Measurements of the primary CMB power spectrum at high spatial frequencies () will constrain the form of the inflationary potential (e.g., the spectral index of primordial fluctuations). Such measurements will require information about the spectral and spatial distribution of millimeter sources in order to separate foregrounds from the primordial signal. At still smaller scales (), studies of the CMB spectrum attempt to constrain fluctuations in the matter density field from the contribution of the SZ to the power spectrum (Lueker et al., 2010; Fowler et al., 2010). For these studies an in-depth understanding of the point source populations is even more critical for separating the power spectrum of the SZ from that of sources. Furthermore, an understanding of the energy feedback from AGN and star-formation to the cluster environment will be important for constraining the form of the SZ spectrum (Battaglia et al., 2010; Shaw et al., 2010; Trac et al., 2010). Finally, SZ surveys attempting to measure , , and dark energy through the evolution of the cluster mass function will likewise need to consider the spectral behavior and cluster occupation numbers for sources in order to avoid systematically biasing mass estimates based on SZ flux density (Lin et al., 2009; Sehgal et al., 2010; Vanderlinde et al., 2010).
The Atacama Cosmology Telescope (ACT) is a millimeter-wave observatory which will ultimately survey thousands of square degrees of sky at arcminute resolution with milli-Jansky sensitivity to sources. ACT is located at 5200 m in the Atacama Desert in the Andes of northern Chile.111The ACT Site is at 22.9586 south latitude, 67.7875 west longitude. This high desert site in the tropics was chosen for its excellent atmospheric transparency and its access to northern and southern celestial latitudes. ACT observes simultaneously in bands centered at 148 GHz (2.0 mm), 218 GHz (1.4 mm), and 277 GHz (1.1 mm), each band having a dedicated 1024-element array of bolometric transition edge sensors. As of mid-2010, ACT has completed three seasons of observations: 2007, 2008, and 2009, and the 2010 season is underway. In each season, ACT has conducted two surveys: a -wide survey centered at declination and a -wide stripe centered on the celestial equator.
In this paper we report on extragalactic sources in the ACT 2008 148 GHz dataset. This is the first report devoted to ACT source science and complements the 148 GHz power spectrum study in Fowler et al. (2010). In what follows we give an overview of the observations and data reduction (Section 2), describe the source catalog (Section 3 and the Appendix), and discuss implications of the study including constraints on source models (Section 4).
2. Observations and Data Reduction
The data used for this analysis were collected by ACT at 148 GHz during its second observing season in 2008. This section gives an overview of the survey observations and the reduction of the raw data to a map as well as a detailed description of the source extraction. For a more thorough introduction to the ACT facility, observations, and data reduction pipeline, we refer the reader to Fowler et al. (2010), Swetz et al. (2010) and references therein.222ACT Collaboration papers are archived at http://www.physics.princeton.edu/act/.
2.1. Observations
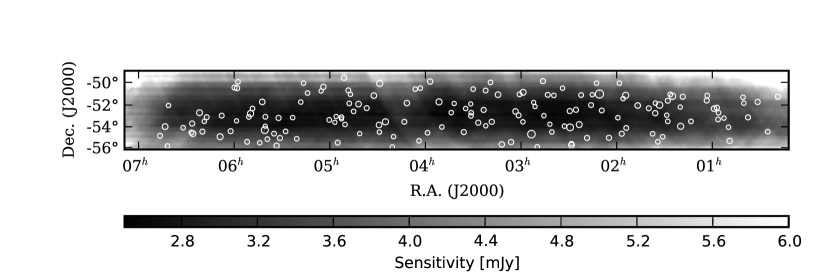
The 2008 southern observations were carried out over a survey area wide, centered on declination , and extending from right ascension to and to . The subset of these data used in the present analysis lies between right ascensions and and declinations and 00 (455 square-degrees). The area was chosen to encompass the data used for power spectrum work in Fowler et al. (2010) and represents a large fraction of the most deeply covered regions from the 2008 148 GHz dataset. Figure 1 shows the area of the sky used and associated point source sensitivies. Typical white noise levels in the map are 30-50 -arcminute, tending to higher values towards the map boundaries. As described in Section 2.4, this white noise level, when match filtered with the ACT beam, results in typical sensitivities to point source flux densities from 2.5 to 5 mJy.
The 2008 ACT observing season extended from mid-August to the final week of December. Observations took place during nighttime hours: from roughly 20:00 to 06:00 local time. Of the total observing time, approximately 85% was devoted to the southern region. ACT observed by scanning at a constant elevation of 50.5 while the survey region drifted through the scan with the rotation of the Earth. During the first half of a night, ACT scanned at azimuth 150, targeting a rising section of the survey area. During the second half of the night, ACT scanned the same section setting on the other side of the south celestial pole at azimuth 210. The rising scans cross the survey region from southwest to northeast and back (in equatorial coordinates), while the setting scans cross the survey region from southeast to northwest. Together, the rising and setting scans cross-link each point on the sky with all adjacent points. The resulting cross-linked temperature data in principle contain all information necessary to recover an unbiased, low-noise map of the millimeter sky. In addition to survey observations, ACT also executed regular observations of Uranus and Saturn during 2008 to provide gain calibration, beam profiles, and pointing.
With the telescope scan strategy described above, any given location in the survey area would be observed over a period of approximately two months during a season. Therefore, source flux densities reported here are the average flux density over a two month period. This is an important point as the vast majority of sources presented in this paper are AGNs which are known to be variable (e.g., Kesteven et al., 1977; Valtaoja et al., 1992).
2.2. Reduction to Maps
The raw 148 GHz data consist of 1024 time-ordered data streams, one per element of the detector array. Approximately 25% of the data are rejected on the basis of telescope operation and weather. After further cuts based on individual detector performance, the data from 680 148 GHz detectors over 850 hours ( GB) are retained from the 2008 southern survey.
Pointing reconstruction is accomplished in two steps. First, the relative detector pointings are established with 1.2′′ certainty through observations of Saturn. Second, absolute detector array pointings for our two southern survey configurations (rising and setting: 150 and 210 azimuth, 50.5 elevation) are established with precision through an iterative process in which the absolute pointing is adjusted based on offsets of ACT-observed radio source locations with respect to source locations taken from the Australia Telescope 20 GHz (AT20G) survey (Murphy et al., 2010).
Nightly calibrations of the detectors’ responsivity (power-to-current conversion) are based on load curves taken at the start of each night. Stability of this calibration through the night is monitored using small steps in the detector bias voltages and established at the few percent level. Relative detector flux density calibrations are based on normalizing the detector responses to the beam-filling atmospheric signal. The resulting relative calibration is shown to be constant through the season at the few percent level. The final brightness temperature calibration is based on ACT observations of Uranus throughout the season and the WMAP7 Uranus temperature (Weiland et al., 2010) extrapolated to the ACT 148 GHz band. The calibration is more fully described in Fowler et al. (2010). The overall calibration is certain to 6% rms, a number dominated by systematic uncertainties in extrapolating the temperature of Uranus to 148 GHz from WMAP frequencies.
The final step in the data reduction is map-making. An iterative preconditioned conjugate gradient solver is used to recover the maximum likelihood (ML) maps. The algorithm solves simultaneously for the millimeter sky as well as correlated noise (e.g., a common mode from atmospheric emission). The map projection used is cylindrical equal area with a standard latitude of and square pixels. For more details on the mapping and other reduction steps, refer to Fowler et al. (2010).
2.3. Data Modeling
The next step toward a source catalog is the construction of a filter which optimizes the signal-to-noise ratio (S/N) of sources in the 148 GHz map.333See Section 2.4 for the definition of S/N used in this work. In order to construct such a filter it is necessary to obtain best estimates of the power spectra of the different components, signal and noise, which contribute to the ACT data. We model the temperature at position as the sum over sources plus other components in the map:
| (1) |
where is the peak amplitude of the source, is the ACT 148 GHz beam function normalized to unit amplitude and taken to be isotropic (Hincks et al., 2009), and includes contributions from the primary CMB, undetected point sources, SZ from clusters and noise from the detectors and atmosphere.
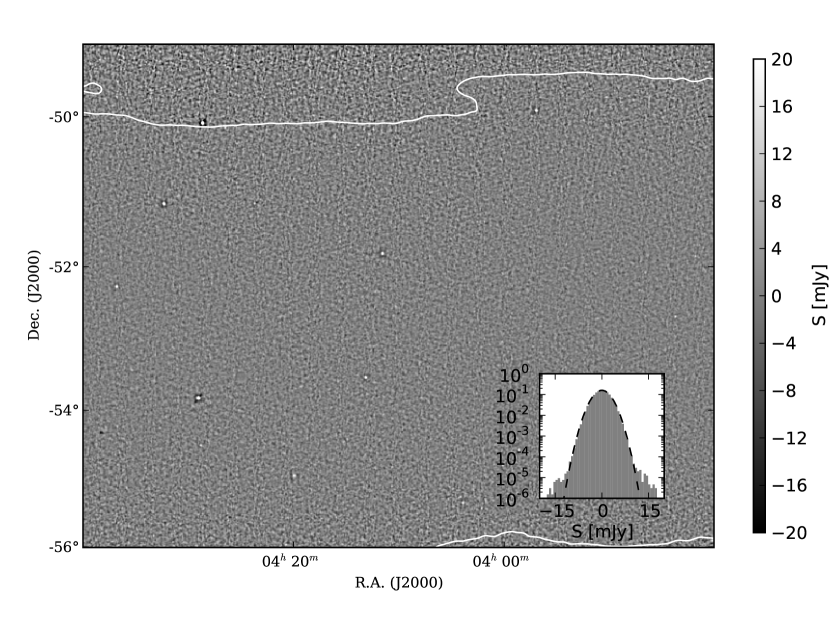
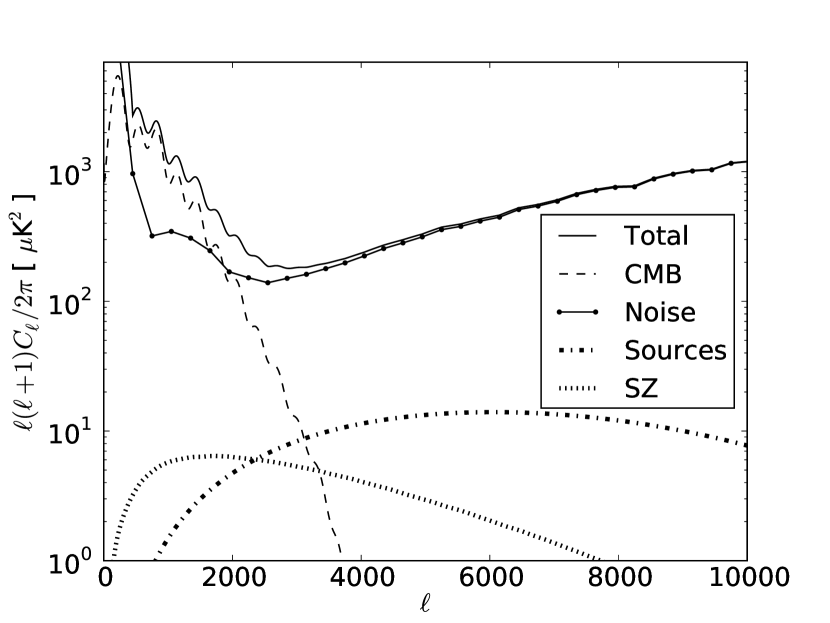
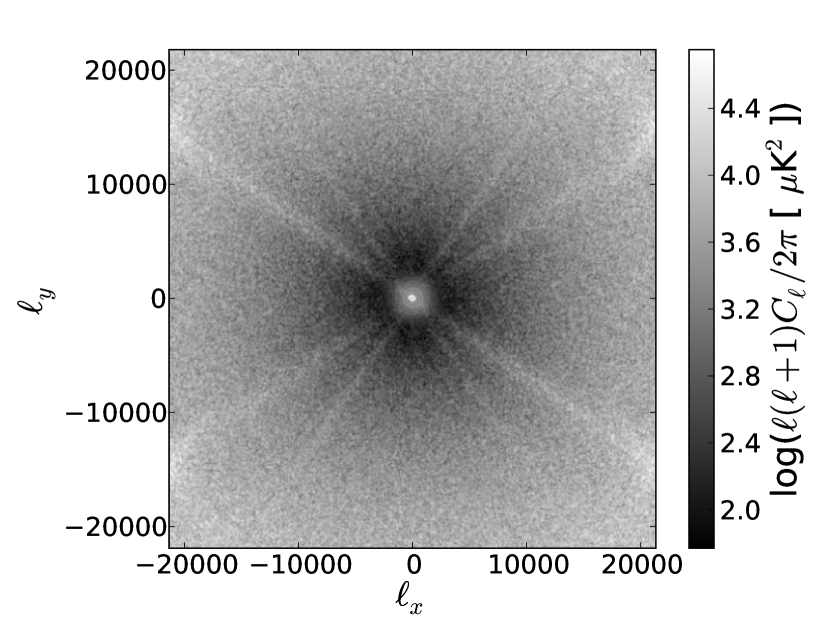
Figure 2 shows graphs of the power spectra of the contributors to . For the primary CMB component we use the WMAP5 best fit model from Nolta et al. (2009). The SZ and undetected source components are taken from models fit to the ACT 148 GHz power spectrum in Fowler et al. (2010). The spatial power spectrum from Fowler et al. (2010) was computed after masking sources from a preliminary version of the catalog presented in this paper. As such the derived contribution to from undetected sources should be a suitable estimate for the matched filter in this work. Specifically, the source model is a Poisson spectrum normalized to at , and the SZ model is a combined thermal and kinetic SZ model ( = 0.8) from Sehgal et al. (2010) normalized by a best-fit factor of 0.63. These celestial models (CMB, sources, and SZ) are all convolved with the ACT 148 GHz beam function. The celestial models are natively one-dimensional functions of multipole (as shown in the left graph in Figure 2) with corresponding azimuthally symmetric two-dimensional representations (as shown in the right graph in Figure 2). The noise term, on the other hand, is natively a two-dimensional power spectrum estimated by the average of power spectra from difference maps. The difference maps were constructed by subtracting a map made from one half of the data (with a random selection of observing days contributing) from a map made from the other half (using the remaining observing days). The two-dimensional noise power spectrum is binned radially to obtain the one-dimensional representation shown by the line of connected dots in the left graph of Figure 2.
From Figure 2 it is clear that the primary contributions to come from the CMB and atmosphere at large scales () while the white detector and photon shot noise dominates the power at small scales. In the spectral trough around the detectable sources will have their greatest signal-to-noise ratio.
An important feature of the two-dimensional power spectrum in the right graph of Figure 2 is the anisotropic nature of the noise term which corresponds to striping in the map. The stripes are a result of large scale drifts in atmospheric emission along the scan directions as well as from correlations among rows of ACT detectors perpendicular to the scan directions. Accounting for this anisotropy when filtering the map is important for extracting an uncontaminated sample of sources. To properly down-weight these noisy diagonal modes, we adopt a two dimensional noise covariance in the matched filtering technique described in Section 2.4.
The final significant noise term that is not captured in difference maps is consistent with scan synchronous noise. The noise is likely due to instabilities induced by acceleration at scan turn-arounds. The noise manifests itself as horizontal striping in the maps and as excess power isolated to a vertical strip in Fourier space. For simplicity, we set the noise power to infinity in this section of Fourier space such that modes contaminated by this noise will be completely down-weighted by the filter as described in the next section.
2.4. Detection and Catalog Construction
To optimize the S/N of the sources with respect to the background, we use a matched filter. This approach has been proposed and used in previous work to find both sources (Tegmark & de Oliveira-Costa, 1998; Wright et al., 2009; Vieira et al., 2010) and the Sunyaev-Zel’dovich effect from clusters (Melin et al., 2006; Staniszewski et al., 2009). For completeness of presentation, here we rederive the form of the filter and its basic properties. Without loss of generality, we consider a field centered on a source such that
| (2) |
We apply a filter in Fourier space such that the temperature at the center of filtered field is
| (3) |
where and are the Fourier transform of the beam and noise temperature field, respectively. The S/N of the central source is
| (4) |
A filter that maximizes this S/N is
| (5) |
where the normalization has been chosen to produce an unbiased estimate of the amplitude of the source at . The noise variance of the filtered data is
| (6) | |||||
In practice, the noise variance of the filtered map is obtained from the filtered map itself after masking the brightest six sources (S/N ). These sources increase the rms of the maps by 10%. The remaining sources contribute approximately 1% to the rms. This slightly more conservative estimate of the variance agrees with the estimate from Equation 6 in which has been constructed as described in Section 2.3. In what follows, the S/N at a location in the filtered map is defined as the temperature at that location divided by the square-root of this variance.
Before applying the global matched filter from Equation 5, we multiply the map, pixel-wise, by the square-root of the number of observations per pixel normalized by the observations per pixel in the deepest part of the map, . This is equivalent to weighting the data by the inverse of the estimated white noise rms shown in Figure 1 and accounts for local variation in the white noise amplitude. Furthermore, the map is tapered to zero in a 10 boundary region around the edge of the map to mitigate the artifacts arising from data aperiodicity when filtering. This windowed data is excluded from the final analysis, reducing the usable sky area from the total 455 square-degrees to 443 square-degrees. Next, because the ringing of the filter around the brightest sources can cause false detections, we identify and mask the six most significant ( ) sources before applying the matched filter to the map. These brightest sources are treated and included in the catalog in the same manner as the fainter sources with the exception they are recovered through an initial run of the pipeline with the S/N lower limit increased. An important final caveat: in constructing the noise term , the component models need to be tapered and weighted in the same fashion as the data for the matched filter formalism to hold. This is particularly true for components with red spatial spectra, such as the atmosphere and CMB, because aliasing due to a particular windowing scheme can significantly alter the spectrum. Figure 3 shows a sample 64 square-degrees of the filtered map. For this reason the catalog includes only detections with S/N 5.25 and above. See Section 3.3 for a discussion of purity determination.
Localized, non-white noise in the map requires that we take further measures beyond the global matched filter solution outlined above. First, local large-scale atmospheric noise requires us to add a low- taper to the term (Equation 5) which rises from zero at to one at as . This filter removes the local atmospheric noise while down-weighting only a small fraction (1%) of the data containing source power in Fourier space. Second, in areas of the map which are particularly shallow, uneven coverage leads to excess striping. In these parts of the map the noise model described in Section 2.3 is invalid and non-white noise remains even after the filter is applied. For this reason, we exclude sources from the catalog which are detected with flux densities below 50 mJy in areas of the map with exposure times less than 7 minutes per square-arcminute. This exposure time is approximately one-third the exposure time in the deepest areas of the map and corresponds to 4.6 mJy rms. The cut level of 50 mJy at 7 minutes per square-arcminute was chosen to broadly eliminate contamination observed in simulations. Future studies will make use of local noise estimation to avoid such an exclusion. The sample submap in Figure 3 demarcates the region at the edge of the map in which we exclude 50 mJy detections with a white contour. With this exclusion, the area used for sources with flux density below 50 mJy is 366 square-degrees.
The final step in the catalog generation is to derive the flux densities associated with the detections. Given the form of the filter in Equation 5, the source-centered value of the filtered map, multiplied by the solid angle of the beam profile, is the source flux density. It is this value, rescaled by the inverse of the square-root of the number of observations per pixel normalized by the number of observations per pixel in the deepest part of the map (), that we record as the raw flux density estimate for a detection. It follows that an error in source location results in an error in flux estimation. Such an error arises due to finite pixel size: a detection rarely falls in the center of a pixel. Source location error due to finite pixel size causes a systematic negative bias and increased scatter. The 0.5 ACT map pixels cause a 10% negative bias with comparable scatter in the flux density estimate. To remove this bias and scatter, we zero-pad the filtered data in Fourier space (e.g., Press et al. (1992)) such that the pixel spacing in map space is decreased by a factor of sixteen. This Fourier interpolation of the filtered data onto 0.03125 pixels is a convenient way to better locate the peak of source emission and therefore mitigate systematic errors in position and flux density estimation to less than 1%. An important caveat to this technique is that the pixel window function must be taken into account when reducing the pixel size. As discussed further in Section 3.2.3, simulations show that flux densities thus derived are unbiased at the sub-percent level.
3. Catalog
The catalog of 157 ACT extragalactic sources is given in Table The Atacama Cosmology Telescope: Extragalactic Sources at 148 GHz in the 2008 Survey of the Appendix. The catalog provides the IAU name, celestial coordinates (J2000) as well as S/N and 148 GHz flux density estimation of each ACT-detected source. Raw flux densities are estimated directly from the map as described in Section 2.4. Deboosted flux densities (Section 3.2.2) are also given. The seventh column gives the exposure time in minutes per square-arcminute at the location of the source. Finally, we provide the ID of AT20G sources collocated within 30 of an ACT source. The following subsections provide the necessary information for interpreting the catalog data.
3.1. Astrometric Accuracy
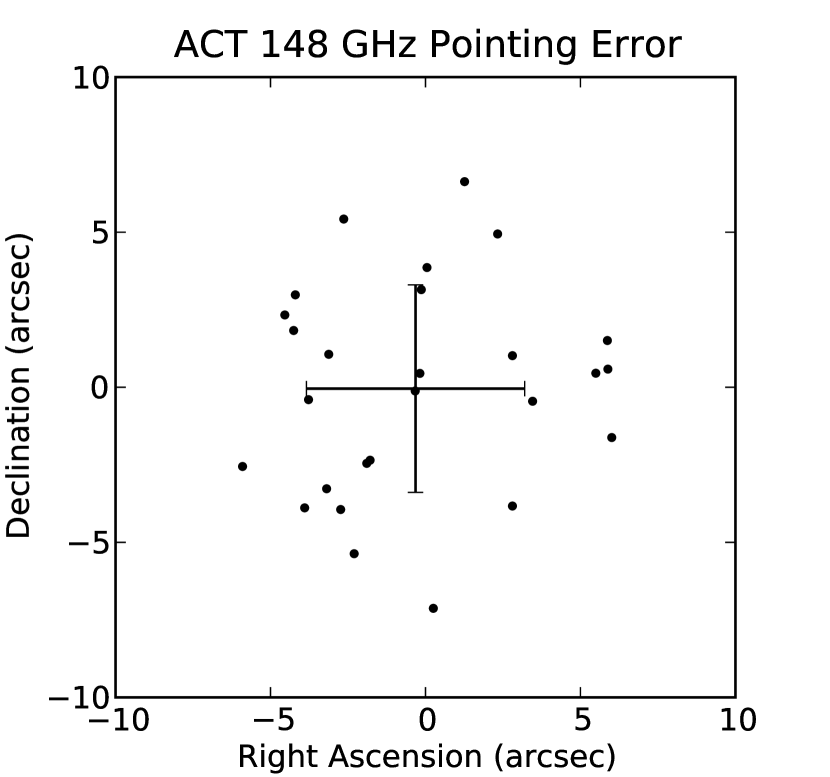
The positions of the twenty-seven ACT sources with S/N 20 were compared to positions of associated sources in the AT20G catalog. The AT20G pointing is checked against VLBI measurements of International Celestial Reference Frame calibrators and is shown to be accurate to better than one arcsecond (Murphy et al., 2010). Figure 4 shows the offsets of the twenty-seven ACT source locations with respect to associated AT20G locations. The mean of the offsets is in right ascension and in declination. The rms of offsets is 3.5 in right ascension and in declination. One ACT source with S/N 20 is cross-identified with an AT20G source away. This source is ACT-S J042906-534943 and is flagged as extended in the AT20G catalog. Furthermore, there are multiple SUMSS sources located within the search radius suggesting a nontrivial geometry. Therefore, this source represents an outlier in this analysis and is not used. For twenty-four cross-identified sources with S/N 8, the ACT location rms with respect to AT20G position was inflated by the effect of the noise: in right ascension and in declination.
We have identified a systematic shift in pointing throughout the season likely associated with movement of the telescope. A significant fraction of the scatter in Figure 4 is attributable to this systematic effect. Because of this effect, the distribution of pointing errors in Figure 4 does not appear Gaussian. We plan to eliminate this effect in a future study.
3.2. Flux Density Recovery
As discussed in Section 2.2, the overall calibration has an uncertainty of 6%, dominated by systematic errors in the temperature of Uranus. In addition to this uncertainty, errors in the flux estimation may arise due to errors in the assumed source profile, to flux boosting of lower significance candidates, and to a failure of the map-maker to converge. In this section we describe tests of these potential sources of flux density error as well as an end-to-end check of the match-filter recovery and deboosting through simulations.
3.2.1 Beam Profile
Flux density recovery is a function of the form of the source profile assumed in the filter (See Equations 2 and 5.). For the filter’s source profile we adopt the ACT 148 GHz beam from Hincks et al. (2009). Deviation of the actual source profile from the ACT 148 GHz beam will result in a biased estimate of the flux density as determined from the filtered map.
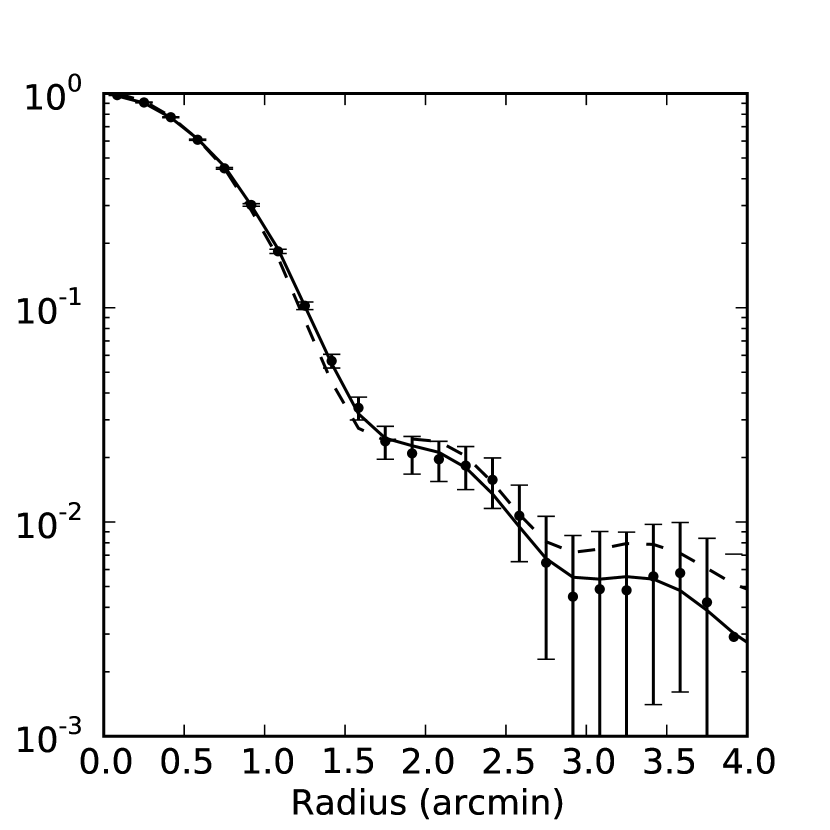
To search for a difference between the actual and assumed profiles, we examine the profiles of the twenty most significant sources in the ACT map. We fit the data with a background term plus an altered ACT beam (respectively broadened or squeezed by the convolution or deconvolution with a Gaussian). The Gaussian convolution we employed models the broadening of the beam resulting from the random pointing error. The average best-fitted profile is the beam from Hincks et al. (2009) convolved with a Gaussian with . This smearing is consistent with the pointing rms in Figure 4. The fit is performed out to a radius of 3′. Figure 5 shows the fit for the brightest source. The effect of this convolution on the 84′′ full width at half maximum (FWHM) of the ACT beam is at the sub-percent level: . Flux density misestimation will scale roughly as the ratio of the actual profile solid angle to the assumed profile solid angle. In the present case, the misestimation is below 1%.
As an additional check on the reported flux densities, the matched filter based flux density estimates are compared to -diameter aperture flux densities. The aperture flux density is defined as the background subtracted flux within a circle (the aperture) centered on the source. The aperture flux density is estimated from the unfiltered ACT maps and as such is complementary to the flux density estimates from the filtered maps. As the source profile extends well beyond a diameter, the aperture flux density estimates are expected to be biased low with respect to true flux density. For the thirty brightest sources from the ACT data, the average ratio of aperture flux density to matched filter flux density is . In simulations which featured sources with the ACT beam shape, the same ratio is . If the source profiles in the data were different from the ACT beam shape, then this ratio from the simulation would differ from the data. The agreement between data and simulation further bolsters the claim that flux density bias due to source profile misestimation is at the sub-percent level.
3.2.2 Deboosting
In a source population for which the counts are a steeply falling function of flux, a source’s measured flux density in the presence of noise is likely to be an overestimate of its intrinsic value . The overestimation is most pronounced for sources at low S/N. The process of deboosting accounts for this overestimate by constructing the posterior flux distribution based on prior knowledge of the source population. Given the relatively high flux density and significance of the detections in this work, we adopt the straightforward Bayesian approach from Coppin et al. (2005):
| (7) |
where the probability of measuring given is taken to be normal with mean and variance derived from the S/N.
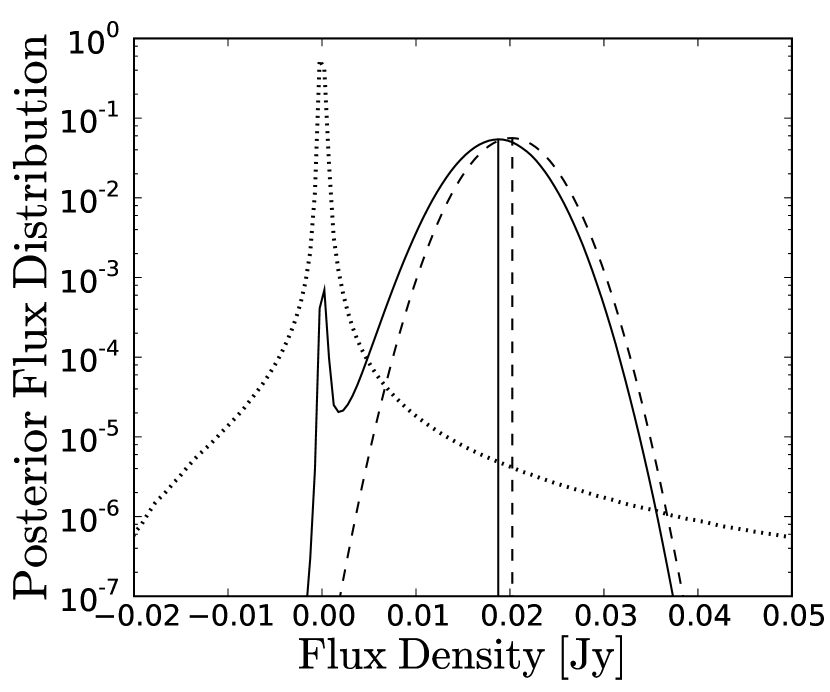
The prior probability of flux in a pixel, , is computed by generating simulations of the (filtered) intrinsic source flux distribution per pixel. Individual, filtered source profiles, , are added to a blank survey map at randomly chosen locations. The numbers and associated amplitudes, , of the sources are chosen in accordance with infrared and radio counts from Toffolatti et al. (1998) rescaled to fit the counts from this study (See Section 4.4.). The procedure for computing the prior probability based on source counts fit to our data involved an initial rescaling of the Toffolatti et al. (1998) data model to counts computed with raw flux densities. Given deboosted flux densities based on this initial prior, counts were then recomputed, the prior was re-estimated and and used to obtain new deboosted flux densities. This process was iterated until corrections to the counts and the deboosted flux densities became negligible. Only one iteration was required for the relatively small level of deboosting used in this initial study. Furthermore, we cut off the radio counts at 150 mJy, reflecting the fact that the brightest six sources ( mJy) are detected and subtracted before constructing the rest of the catalog. A function is then generated by binning the fluxes associated with map (indexed here by ) pixels in 0.5 mJy bins. The final distribution was then computed as the average of from ten-thousand independent simulations. The deboosting algorithm is illustrated for a single source in Figure 6 where the dashed Gaussian represents and the dotted profile peaking just below zero flux is the prior probability . The posterior probability is the solid line.
The deboosted flux reported in the ACT catalog for sources below 50 mJy is the median of the associated , and the reported asymmetric errors enclose the 68% confidence interval. The abrupt 150 mJy cutoff imposed on the radio counts in combination with finite pixel size effects the smoothness of the prior estimate at higher fluxes. To mitigate this effect, the simulated maps used to construct the prior feature a pixel size of half that of the data (). Furthermore, deboosted fluxes are only provided for sources with flux below 50 mJy where the computed prior is smooth: for sources above 50 mJy, we simply report the center and 68% confidence level of .
The prior probability in Figure 6 is broader and, for the range of flux densities plotted, more symmetric than analogous distributions derived in previous work (e.g., Figure 6 of Scott et al. (2008)). The difference arises because our simulations include the radio population whose source counts are much shallower than the infrared populations. The bright radio sources, in addition to having a bright positive tail, produce significant negative ringing when filtered. A more familiar form of would be generated if we were to recover fluxes using the CLEAN technique (Högbom, 1974) as described in, e.g., Vieira et al. (2010).
In future multi-band work that considers detections of lower significance, we will employ important extensions of the simple deboosting used here, e.g., Austermann et al. (2010); Crawford et al. (2009).
3.2.3 Simulations and Flux Recovery
Having established that the source profile used in the matched filter is a good approximation to that in the data (Section 3.2.1), it remains to test the flux estimation and deboosting through simulation. Source flux densities were derived from maps with celestial components and noise modeled as described in Section 2.3 with two exceptions. First, the SZ component was excluded to prevent confusion due to cluster-galaxy correlations. This effect caused negative outliers in derived flux density due to brightness cancellation by the cluster decrement. Second, we excluded several () peculiar instances of superposed, very bright, (30 mJy) infrared sources. This apparent clustering of ultra-bright dusty sources caused positive outliers in derived flux density.
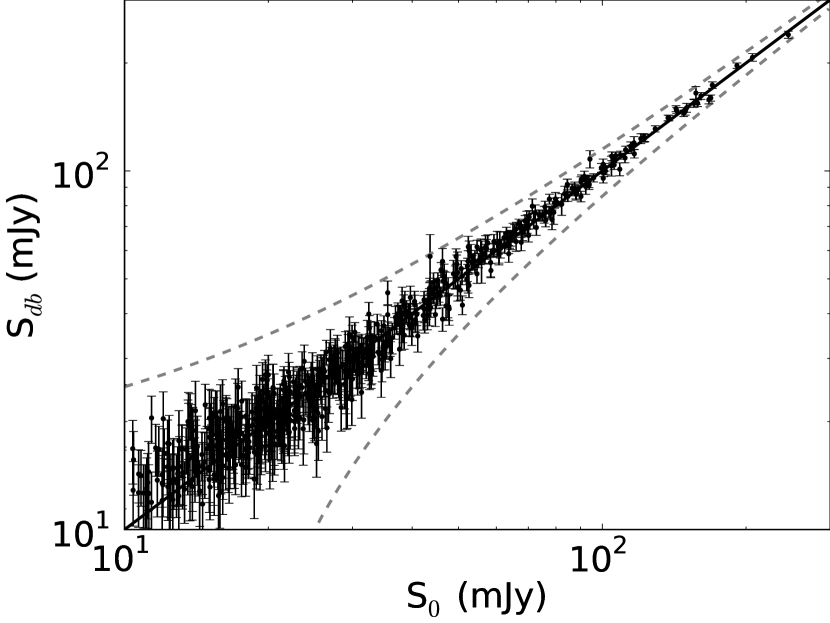
With the exceptions noted above, the simulated sources were detected with the same blind algorithm that was described for source extraction from the data. Similarly, the deboosted flux densities of the simulated sources were derived. Figure 7 shows the result. At the percent level, the derived deboosted flux density Sdb is a consistent estimate of the intrinsic flux density S0 with a best fit of
| (8) |
where the fit (reduced for 451 degrees of freedom) was performed only for sources with flux density greater than 20 mJy to restrict the analysis to a complete (and thus symmetric) distribution. The errors (68% c.l.) are derived from one thousand bootstrap samplings. Furthermore, the model Sdb = S0 fits the 451 sources with flux densities greater than 20 mJy with a reduced . This one-to-one model fits the entire population (down to the S/N=5.25) with reduced =1.19 over 651 degrees of freedom. This improbable statistic likely results from a combination of unaccounted-for astrophysics (e.g., source clustering) in Sehgal et al. (2010), errors in our deboosting, and an underestimate of flux density error.
3.2.4 Convergence
As described in Section 2, maximum-likelihood maps generated from the cross-linked ACT 148 GHz data are unbiased for modes corresponding to multipoles in excess of a few hundred (i.e., exactly those used for source flux estimation). We checked this claim through signal-only simulations and found that the flux density estimates of the sources converged to within 1% of their simulation values before the twenty-fifth iteration of the preconditioned conjugate gradient map-solver (See Fowler et al. (2010) for a fuller description of the solver.). This study uses a map from the hundredth iteration of the ACT maps. Therefore, we conclude that the flux densities are not biased by failure of the mapping algorithm convergence.
| Flux Range | # Det | # False | Completeness | AreabbFor a discussion of flux density dependent area, see Section 2.4. |
|---|---|---|---|---|
| mJy | sq-deg | |||
| 1390 – 2870 | 1 | 0 | 100% | 432 |
| 650 – 1390 | 1 | 0 | 100% | 432 |
| 330 – 650 | 2 | 0 | 100% | 432 |
| 170 – 330 | 4 | 0 | 100% | 432 |
| 90 – 170 | 12 | 0 | 100% | 432 |
| 50 – 90 | 22 | 0 | % | 432 |
| 30 – 50 | 40 | 0 | 100% | 368 |
| 20 – 30 | 44 | % | 368 | |
| 15 – 20 | 25 | % | 368 |
3.3. Purity and Completeness
The number of false detections in our catalog of 157 sources is estimated by running the detection algorithm on an inverted (negative temperature) map in which the SZ decrements from all ACT-detected and optically-confirmed clusters have been masked. A full description of the ACT SZ cluster population and optical follow-up can be found in Menanteau et al. (2010). With this approach, three spurious detections are found, giving a purity of 98% for detections above a S/N of 5.25. Below this S/N, the purity of the sample was found to decrease rapidly with only 50% purity in the range (seven false detections). These results are consistent with estimates of purity based on cross-identification of the ACT detections with other catalogs (See Section 4.1.). From simple Gaussian statistics, one expects fewer than five false detections in a sample selected with S/N 5. Thus, some fraction of the false detections are may be the result of localized noise not accounted for by the weighting and matched filter.
Simulations from Sehgal et al. (2010) with noise from difference maps (see Section 2.3) were used to estimate completeness. Table 1 summarizes the findings. Due primarily to the uneven depth of coverage, the population of sources detected between 15 and 20 mJy was found on average to be 86% complete and the population between 20 and 30 mJy to be 97% complete. Because of the strict 50 mJy lower bound set for detections in areas of the map characterized by integration times below 7 minutes, the 50 – 90 mJy range also suffers from an incompleteness of 94%. The full simulations of Sehgal et al. (2010) include a correlation between radio sources and galaxy clusters, and we have excluded the SZ component in order to simplify the current study. At 148 GHz, clusters manifest themselves as arcminute-scale temperature decrements in the map which will cancel source flux in superposed source-cluster pairs. We also ran the test described here with the SZ component from Sehgal et al. (2010) included in the simulations. The resulting cancellation of source flux density by cluster decrements was found to cause an additional few percent of the incompleteness in the source population with flux densities below 30 mJy.
4. Discussion
4.1. Comparison to Other Source Catalogs
As a first step in ACT source characterization we consider cross-identifications with other catalogs. Matches are established within a 30 radius about an ACT source. The choice of association radius was made based on the positional rms of the ACT catalog and comparison catalogs (allowing for outliers) as well as the fact that the source of low-frequency radio signals in a given system may be physically displaced from the source of high-frequency radio signal. A general search through the NASA/IPAC Extragalactic Database finds that thirty-one ACT sources have measured redshifts, ranging from 0.003 to 2.46. In what follows we consider in more detail several catalogs of particular relevance to the 148 GHz source population.
Of our 157 sources, 109 match sources in the 5, 8, and 20 GHz AT20G catalog. There are 180 AT20G sources in the survey area such that a random cross-identification would occur once in roughly 11600 cases.444This rough statistic estimates the probability of a spurious detection in the ACT data falling in the fractional area () occupied by the sources from the auxiliary catalog. The AT20G catalog is incomplete below 100 mJy (Murphy et al., 2010). Given that nearly all the radio sources detected at 148 GHz are expected to have relatively flat spectra (e.g., Vieira et al., 2010), faint ACT sources may not have matches in AT20G (See Section 4.3.). We have proposed for time on the Australia Telescope Compact Array to measure flux densities for sources in the ACT catalog that do not appear in AT20G.
All but six of the ACT sources are co-located within 30′′ of sources from AT20G or the 0.84 GHz Sydney University Molonglo Sky Survey (SUMSS) catalog (Mauch et al., 2003). Within our survey area, the sample of 14030 SUMSS sources is complete to 8 mJy. A random cross-identification with a SUMSS detection is a 1-in-150 event and thus a spurious SUMSS association is likely. Of the six ACT sources without cross-identification in AT20G or SUMSS, two (ACT-S J011830511521, ACT-S J033133515349) are within 50′′ of a SUMSS source, and the former is relatively bright with a 148 GHz flux density of 47.6 mJy. Furthermore, a preliminary reduction of the ACT 218 GHz data identifies one of the remaining four (ACT-S J031823533148) as a 5 detection. ACT-S J034157515140, ACT-S J004042511830, and ACT-S J035343534553 have no match in the auxiliary catalogs and may be false detections. This number of false detections is consistent with the study of sample purity presented in Section 3.3.
Comparing to the recently reported 2.0 mm measurements from the South Pole Telescope (SPT) (Vieira et al., 2010), we find twenty-four cross-identifications with ACT sources. The Vieira et al. (2010) study used a square survey of 87 square-degrees centered at 05h right ascension. As such, the ACT and SPT surveys have only fractional overlap. Nevertheless, 2304 of the 3496 SPT source candidates (S/N ) fall within the ACT survey. All twenty-four matching sources were categorized in Vieira et al. (2010) as synchrotron-dominated.
Finally, we compare the ACT catalog to the Infrared Astronomical Satellite Point Source Catalog (IRAS PSC; Helou & Walker, 1988). Three of the detections, ACT-S J041959545622 (NGC 1566), ACT-S J04285542959 and ACT-S J033133515352 (IC 1954), are identified with sources in the IRAS PSC. All three sources display lower frequency radio emission and have been identified in the preliminary ACT 218 GHz analysis.
4.2. Correlation with X-ray Clusters
Radio-loud AGN are frequently found in Brightest Cluster Galaxies (BCGs). From a study of radio-loud AGNs in the SDSS using data from the National Radio Astronomy Observatory (NRAO) Very Large Array (VLA) Sky Survey (Condon et al., 1998) and the Faint Images of the Radio Sky At Twenty Centimeters survey (Becker et al., 1995), Best et al. (2007) found that the probability of a BCG hosting a radio-loud AGN is significantly enhanced compared to field galaxies of the same stellar mass. Lin & Mohr (2007) found that the fraction of BCGs being radio-loud is higher compared to that of cluster galaxies of similar luminosity. This enhancement of radio activity is probably due to the fact that BCGs are located in special places - the centers of clusters - and the AGN activity is likely fueled by gas cooling, or due to galaxy interactions in these high density regions.
We performed a simple check to test whether any of the ACT 148 GHz sources were associated with clusters by cross matching against the REFLEX catalog (Böhringer et al., 2004), which is a homogeneous, X-ray selected sample with a nominal (0.1-2.4 keV) flux limit of erg s-1 covering . The REFLEX catalog is % complete above its nominal flux limit, and 23 REFLEX clusters are located within 2008 ACT survey region, spanning the redshift range . Using a generous matching radius, we find that three ACT sources are associated with REFLEX clusters: ACT-S J062142-524136 (RXC J0621.7-5242); ACT-S J042906-534943 (RXC J0429.1-5350/AS0463); and ACT-S J062620-534136 (RXC J0626.3-5341/A3391). The separation between the ACT sources and the corresponding REFLEX cluster positions is . All of these clusters are at very low redshift (0.041–0.055), and have low masses ( M☉, inferred from their X-ray luminosities).
All three of these ACT sources have corresponding matches in the AT20G catalog. For ACT-S J062142-524136, both the ACT and AT20G sources are located within of each other and are coincident with the BCG, from inspection of DSS imaging. For the other two sources, we find that either the ACT source position (in the case of RXC J0626.3-5341) or the AT20G position (in the case of RXC J0429.1-5350) is coincident with the BCG, although the AT20G and ACT positions are offset by . In all cases, the projected radial distance between the BCG and the REFLEX X-ray position is kpc.
4.3. Source Spectra
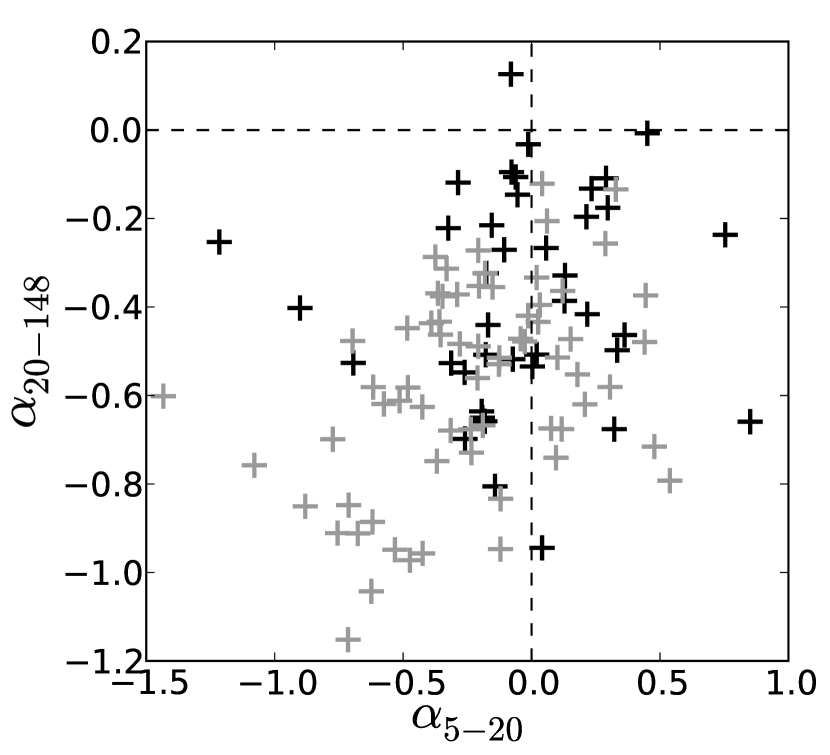
It is established that radio source spectra extending to 148 GHz are not well characterized by a simple power law S() (e.g., de Zotti et al. (2010)). Murphy et al. (2010) used a color-color comparison of spectral indices at 5–8 GHz and 8–20 GHz to show that the AT20G population may be decomposed into classical steep (and steepening) spectrum sources, sources that peak between their bands, and sources that show flat, rising or up-turned spectra. Following this example we construct a color-color comparison of 5–20 GHz and 20–148 GHz measurements, where the 5 and 20 GHz flux densities are from AT20G. The variability of these sources makes a per-source comparison difficult, but a study using the 109 ACT-AT20G cross-identifications as an ensemble is meaningful. Figure 8 is the vs. color-color diagram. The figure shows that the ACT-AT20G cross-identified sources are predominantly characterized by spectral steepening. The sample is biased towards steepened spectra at low flux density ( mJy) due to incompleteness in AT20G.
The population can be further divided according to 148 GHz flux density. In Figure 8, the black crosses correspond to the forty-two brightest sources in the ACT sample, and the gray crosses correspond to the faint half. The dividing flux density, 50 mJy, was chosen such that all but two of the ACT detections in the brighter sample have cross-identifications in AT20G. As described in Section 4.1, below this flux density the mean spectral indices of the population of ACT-AT20G cross-identified sources is biased negative by the incompleteness in AT20G below 100 mJy. The two sources in this high-flux subset which do not have AT20G counterparts are characterized by 150 GHz flux densities close to the 50 mJy cutoff and may have flatter spectra than the sample average. Including two extra sources with changes the mean spectral indices by of the statistical error, and therefore we simply use the forty sources with AT20G counterparts in the following analysis. Considering only the unbiased, bright half of the distribution, the average spectrum steepens between 5–20 GHz and 20–148 GHz. The median spectral indices of the unbiased sample of sources are and .555The errors on spectral indices are the 68% confidence levels of the distribution and, in parentheses, for the median. In obtaining the spectral indices we compare the deboosted flux densities from ACT with the raw flux densities from AT20G. Using the raw AT20G should not significantly bias the index estimates because the AT20G detections are all characterized by a S/N greater than 15.
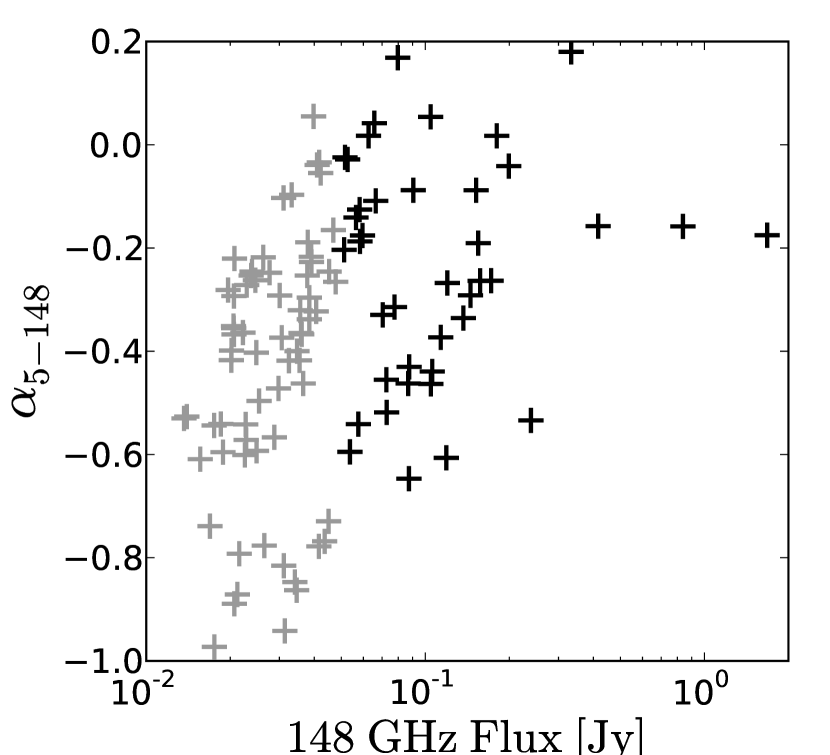
When restricted to the unbiased sample with flux densities above 50 mJy, the 5–148 GHz spectral index is . This distribution is in 2.5 tension with the SPT-reported mean 5–150 GHz spectral slope (for 57 sources) of (Vieira et al., 2010).666Note the tension arises for the center of the spectral index distribution which is better constrained than the index of any given source. Vieira et al. (2010) claim that the mean spectral index of the synchrotron-dominated species remains near to 2.0 mm ( GHz) after which it steepens such that the average slope between 2 mm and 1.4 mm ( GHz) is . This study suggests that the transition to the steep spectrum is more gradual. In fact, the spectral slope approaches the slope between 2.0 mm and 1.4 mm reported in Vieira et al. (2010). This picture is further supported by the rescaling of ACT 148 GHz source counts relative to source counts at 30 GHz (See Section 4.4). Figure 9 shows the ACT 5–148 GHz spectral indices as a function of flux density. The low flux density sample, represented by gray crosses, is incomplete for high spectral indices. Follow-up of the 148 GHz selected sources without matches in AT20G will complete the picture in the range 20–50 mJy.
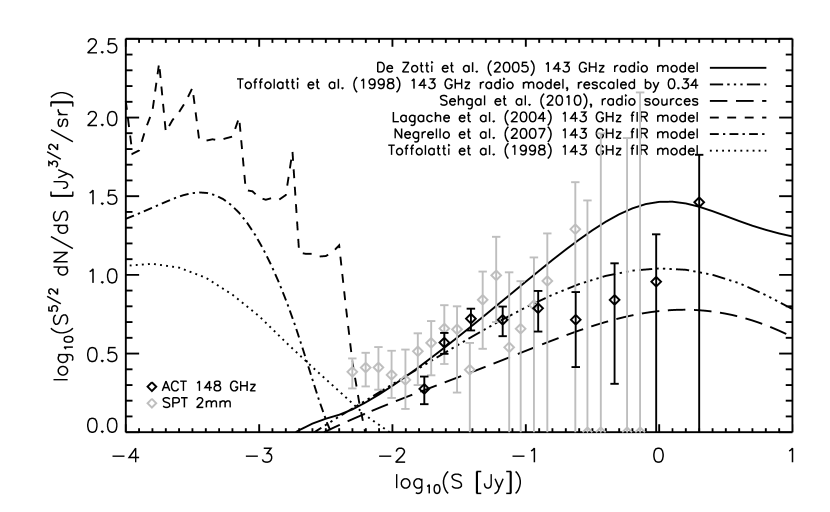
4.4. Source Counts
The differential number counts for ACT sources based on data in Table 1 are plotted in Figure 10. The figure shows that the ACT counts are fit reasonably well by the model for radio sources from Toffolatti et al. (1998) scaled by a factor of . Depending on whether the rescaling is fit to the data in log or linear coordinates the best fit value varies from 0.31 to 0.35. As in Figure 10, we adopt the rescaling of 0.34 which lies between these two values. The ACT results are also consistent with counts reported by the SPT (Vieira et al., 2010). As part of the WMAP 7-year analysis, Wright et al. (2009) fit differential source counts at 30 GHz from WMAP, the VSA (Cleary et al., 2006), CBI (Mason et al., 2003), and DASI (Kovac et al., 2002). They found that the best fit scaling for the Toffolatti et al. (1998) model at 30 GHz is 0.64. This result was also consistent with 30 GHz measurements by the SZA which covered a fainter range of flux densities (Muchovej et al., 2010). The apparent discrepancy between the 30 GHz and 148 GHz scalings can be explained by the steepening of the radio source spectrum described in Section 4.3. The source count model traditionally adopted from Toffolatti et al. (1998) uses an average spectral index of for radio sources between 20 and 200 GHz. From the unbiased sample of spectral indices (dark crosses) in Figure 8, the slope between 20 and 148 GHz is . As can be seen from Figure 10, the radio source number counts are well-approximated by a power law N(S) S-1 between 0.01 and 1 Jy (dN/dS S5/2 S1/2). It follows that the 148 GHz number counts should be rescaled by
consistent with the scaling of Toffolatti et al. (1998) to the ACT data. Also shown in the plot are radio source models from De Zotti et al. (2005) and Sehgal et al. (2010). The De Zotti et al. (2005) model is consistent with the ACT source counts at low flux densities ( Jy) and over-predicts the counts at higher flux densities. The model presented in Sehgal et al. (2010), although underestimating the source counts at Jy, seems to be consistent with ACT data at higher fluxes.
Differential source counts derived from the 150 GHz catalog from ACBAR (Reichardt et al., 2009) are consistent with Toffolatti et al. (1998) scaled by 0.64. However, ACBAR’s resolution and sensitivity made it sensitive to only the brightest sources with flux densities mainly in excess of 100 mJy where there are fewer sources. Furthermore, the ACBAR fields were chosen specifically to have bright quasars for beam measurement (Kuo et al., 2007) such that the differential source counts derived from the ACBAR data are biased high. The ACT field was chosen with no a-priori knowledge of source population. Allowing for variability, there is reasonable agreement in the flux densities reported by ACBAR and ACT for the seven sources common to both catalogs.
Also shown in Figure 10 are models for counts of dusty starburst galaxies (Toffolatti et al., 1998; Lagache et al., 2004; Negrello et al., 2007). The brightest infrared sources in these models are 10 mJy. Given that all sources in the ACT catalog have flux densities greater than 10 mJy, these models predict that the 148 GHz selected ACT catalog should have few or no infrared sources.
4.5. Contribution to the Power Spectrum
The =3000–10000 power spectrum of the 148 GHz sky is dominated by synchrotron and infrared sources as well as the thermal SZ from clusters (Hall et al., 2010; Fowler et al., 2010) . In particular, the power spectrum at the highest multipoles constrains the Poisson distributed component of the source population, and an understanding of the residual synchrotron population helps break the high- spectral degeneracy between synchrotron and infrared sources. The contribution to the power spectrum by a Poisson-distributed population of sources is a function of the number counts:
| (10) |
where is the upper-limiting flux density of the residual (i.e., unmasked) sources in the data. With a limiting flux density of 20 mJy and the rescaled model of Toffolatti et al. (1998) from Section 4.4, one expects a synchrotron contribution to the Poisson power spectrum of .
Fowler et al. (2010) used a 20 mJy cut for masking sources and found a Poisson spectrum from all residual sources of . Thus from this study we expect an infrared contribution to the Poisson spectrum of . A similar argument applied to the study of Lueker et al. (2010) results in an estimate of the residual Poisson term for infrared sources of . Thus, within the Fowler et al. (2010) errors, the two studies of the high- power spectrum at 148 GHz are consistent.
5. Conclusions
We have presented results on extragalactic sources at 148 GHz from data taken by ACT during the 2008 observing season. A catalog of 157 millimeter sources has been presented with sources detected across two decades in flux density, from 15 mJy to 1500 mJy. The flux density calibration of the sources derives from observations of Uranus with 6% error. Bias in the quoted flux densities due to beam shape uncertainty is estimated at less than 1%. Typical statistical 1 errors for the source flux density range from 2.5 mJy to 5 mJy. The catalog astrometry error for the brightest sources is characterized by an rms of . The catalog is estimated to be 98% pure and complete above 20 mJy.
Comparison to other catalogs shows that 98% of the ACT detections correspond to sources detected at lower radio frequencies. The differential source counts are also consistent with the finding that ACT detections correspond to sources detected at lower radio frequencies. In particular, the source counts are fit reasonably well by the radio model of Toffolatti et al. (1998) scaled by 0.34. This scaling, compared to a scaling 0.64 found at 30 GHz by Wright et al. (2009), suggests that the population of radio sources is characterized, on average, by spectral steepening between 30 GHz and 148 GHz. This conclusion is consistent with the average spectral indices derived from the combined AT20G and ACT datasets. Future work will address the more involved comparison with the De Zotti et al. (2005) and Sehgal et al. (2010) radio source models. With the rescaled model from Toffolatti et al. (1998) and a 20 mJy cut, the residual contribution of the synchrotron population to the Poisson power spectrum is .
Future ACT source work will incorporate the 218 GHz and 277 GHz bands, deeper coverage integrating the 2007, 2009, and (ongoing) 2010 seasons, as well as the equatorial survey overlapping the deep Sloan Digital Sky Survey Stripe 82.
References
- Austermann et al. (2010) Austermann, J. E., et al. 2010, MNRAS, 401, 160
- Battaglia et al. (2010) Battaglia, N., Bond, J. R., Pfrommer, C., Sievers, J. L., & Sijacki, D. 2010, ApJ, 725, 91
- Becker et al. (1995) Becker, R. H., White, R. L., & Helfand, D. J. 1995, ApJ, 450, 559
- Best et al. (2007) Best, P. N., von der Linden, A., Kauffmann, G., Heckman, T. M., & Kaiser, C. R. 2007, MNRAS, 379, 894
- Böhringer et al. (2004) Böhringer, H., et al. 2004, A&A, 425, 367
- Cleary et al. (2006) Cleary, K. A., et al. 2006, VizieR Online Data Catalog, 736, 340
- Condon et al. (1998) Condon, J. J., Cotton, W. D., Greisen, E. W., Yin, Q. F., Perley, R. A., Taylor, G. B., & Broderick, J. J. 1998, AJ, 115, 1693
- Coppin et al. (2005) Coppin, K., Halpern, M., Scott, D., Borys, C., & Chapman, S. 2005, MNRAS, 357, 1022
- Crawford et al. (2009) Crawford, T. M., Switzer, E. R., Holzapfel, W. L., Reichardt, C. L., Marrone, D. P., & Vieira, J. D. 2010, ApJ, 718, 513
- de Zotti et al. (2010) de Zotti, G., Massardi, M., Negrello, M., & Wall, J. 2010, A&A Rev., 18, 1
- De Zotti et al. (2005) De Zotti, G., Ricci, R., Mesa, D., Silva, L., Mazzotta, P., Toffolatti, L., & González-Nuevo, J. 2005, A&A, 431, 893
- Fowler et al. (2010) Fowler, J. W., et al. 2010, ApJ, 722, 1148
- Hall et al. (2010) Hall, N. R., et al. 2010, ApJ, 718, 632
- Helou & Walker (1988) Helou, G. & Walker, D. W., eds. 1988, Infrared astronomical satellite (IRAS) catalogs and atlases. Volume 7: The small scale structure catalog, Vol. 7
- Hincks et al. (2009) Hincks, A. D., et al. 2009, ApJS, 191, 423
- Högbom (1974) Högbom, J. A. 1974, A&AS, 15, 417
- Kesteven et al. (1977) Kesteven, M. J. L., Bridle, A. H., & Brandie, G. W. 1977, AJ, 82, 541
- Kovac et al. (2002) Kovac, J. M., Leitch, E. M., Pryke, C., Carlstrom, J. E., Halverson, N. W., & Holzapfel, W. L. 2002, Nature, 420, 772
- Kuo et al. (2007) Kuo, C. L., et al. 2007, ApJ, 664, 687
- Lagache et al. (2004) Lagache, G., et al. 2004, ApJS, 154, 112
- Lima et al. (2010) Lima, M., Jain, B., Devlin, M., & Aguirre, J. 2010, ApJ, 717, L31
- Lin & Mohr (2007) Lin, Y. & Mohr, J. J. 2007, ApJS, 170, 71
- Lin et al. (2009) Lin, Y., Partridge, B., Pober, J. C., Bouchefry, K. E., Burke, S., Klein, J. N., Coish, J. W., & Huffenberger, K. M. 2009, ApJ, 694, 992
- Lueker et al. (2010) Lueker, M., et al. 2010, ApJ, 719, 1045
- Mason et al. (2003) Mason, B. S., et al. 2003, ApJ, 591, 540
- Mauch et al. (2003) Mauch, T., Murphy, T., Buttery, H. J., Curran, J., Hunstead, R. W., Piestrzynski, B., Robertson, J. G., & Sadler, E. M. 2003, MNRAS, 342, 1117
- Melin et al. (2006) Melin, J., Bartlett, J. G., & Delabrouille, J. 2006, A&A, 459, 341
- Menanteau et al. (2010) Menanteau, F., et al. 2010, ApJ, 723, 1523
- Muchovej et al. (2010) Muchovej, S., et al. 2010, ApJ, 716, 521
- Murphy et al. (2010) Murphy, T., et al. 2010, MNRAS, 402, 2403
- Negrello et al. (2007) Negrello, M., Perrotta, F., González-Nuevo, J., Silva, L., De Zotti, G., Granato, G. L., Baccigalupi, C., & Danese, L. 2007, MNRAS, 377, 1557
- Nolta et al. (2009) Nolta, M. R., et al. 2009, ApJS, 180, 296
- Press et al. (1992) Press, W. H., Teukolsky, S. A., Vetterling, W. T., & Flannery, B. P. 1992, Numerical Recipes in C: The Art of Scientific Computing, 2nd edn. (Cambridge University Press)
- Reichardt et al. (2009) Reichardt, C. L., et al. 2009, ApJ, 701, 1958
- Scott et al. (2008) Scott, K. S., et al. 2008, MNRAS, 385, 2225
- Sehgal et al. (2010) Sehgal, N., et al. 2010, ApJ, 709, 920
- Shaw et al. (2010) Shaw, L. D., Nagai, D., Bhattacharya, S., & Lau, E. T. 2010, ApJ, 725, 1452
- Staniszewski et al. (2009) Staniszewski, Z., et al. 2009, ApJ, 701, 32
- Sunyaev & Zel’dovich (1970) Sunyaev, R. A. & Zel’dovich, Y. B. 1970, Comments on Astrophysics and Space Physics, 2, 66
- Swetz et al. (2010) Swetz, D. S., et al. 2010, arXiv:1007.0290
- Tegmark & de Oliveira-Costa (1998) Tegmark, M. & de Oliveira-Costa, A. 1998, ApJ, 500, L83
- Toffolatti et al. (1998) Toffolatti, L., Argueso Gomez, F., De Zotti, G., Mazzei, P., Franceschini, A., Danese, L., & Burigana, C. 1998, MNRAS, 297, 117
- Trac et al. (2010) Trac, H., Bode, P., & Ostriker, J. P. 2011, ApJ, 727, 94
- Valtaoja et al. (1992) Valtaoja, E., Terasranta, H., Urpo, S., Nesterov, N. S., Lainela, M., & Valtonen, M. 1992, A&A, 254, 80
- Vanderlinde et al. (2010) Vanderlinde, K., et al. 2010, ApJ, 722, 1180
- Vieira et al. (2010) Vieira, J. D., et al. 2010, ApJ, 719, 763
- Weiland et al. (2010) Weiland, J. L., et al. 2011, ApJS, 192, 19
- Wright et al. (2009) Wright, E. L., et al. 2009, ApJS, 180, 283
| ACT ID | RA (J2000) Dec | S/N | SmaaFlux density as measured directly from the ACT 148 GHz map. | SdbbbDeboosted flux densities as described in Section 3.2.2 for sources with mJy. For sources measured flux in above 50 mJy, the measured flux together with S/N derived errors are reported (See Section 3.2.2.). | tintccfootnotemark: | AT20G ID | |
|---|---|---|---|---|---|---|---|
| hms | ° ′ ″ | (mJy) | (mJy) | (min) | |||
| ACT-S J001850511454 | 10.4 | 53.7 | 53.7 | 6.1 | ATG20 J001849511455 | ||
| ACT-S J001851492949 | 7.4 | 52.8 | 52.8 | 3.0 | … | ||
| ACT-S J002513542737 | 6.7 | 26.1 | 24.8 | 10.0 | ATG20 J002511542739 | ||
| ACT-S J003134514308 | 13.9 | 52.7 | 52.7 | 10.3 | ATG20 J003134514325 | ||
| ACT-S J003734530729 | 11.9 | 39.1 | 38.5 | 13.9 | ATG20 J003735530733 | ||
| ACT-S J004012514950 | 5.7 | 20.2 | 18.7 | 12.2 | … | ||
| ACT-S J004042511830 | 5.6 | 22.9 | 21.1 | 9.5 | … | ||
| ACT-S J004906552106 | 14.1 | 62.6 | 62.6 | 7.5 | ATG20 J004905552110 | ||
| ACT-S J004949540240 | 6.7 | 21.8 | 20.7 | 14.2 | … | ||
| ACT-S J005240531127 | 5.5 | 17.6 | 16.2 | 14.5 | … | ||
| ACT-S J005605524154 | 8.2 | 28.6 | 27.6 | 12.5 | … | ||
| ACT-S J005622531845 | 9.7 | 32.4 | 31.6 | 13.5 | … | ||
| ACT-S J005706521423 | 13.9 | 47.4 | 46.8 | 12.7 | ATG20 J005705521418 | ||
| ACT-S J005855521925 | 20.3 | 70.4 | 70.4 | 12.4 | ATG20 J005855521926 | ||
| ACT-S J010309510907 | 8.8 | 33.5 | 32.5 | 10.4 | ATG20 J010306510907 | ||
| ACT-S J010330513544 | 11.7 | 41.9 | 41.2 | 12.0 | ATG20 J010329513551 | ||
| ACT-S J011324532938 | 7.2 | 22.4 | 21.4 | 15.4 | ATG20 J011323532949 | ||
| ACT-S J011654544653 | 5.8 | 21.0 | 19.5 | 11.3 | … | ||
| ACT-S J011830511521 | 13.0 | 48.4 | 47.7 | 11.0 | … | ||
| ACT-S J011950535714 | 46.9 | 157.2 | 157.2 | 15.4 | ATG20 J011950535717 | ||
| ACT-S J012006521104 | 6.1 | 19.6 | 18.4 | 14.8 | ATG20 J012008521102 | ||
| ACT-S J012457511309 | 51.0 | 199.1 | 199.1 | 11.4 | ATG20 J012457511316 | ||
| ACT-S J012501532514 | 5.3 | 15.5 | 14.2 | 17.6 | … | ||
| ACT-S J012623510305 | 7.0 | 26.0 | 24.8 | 11.1 | ATG20 J012624510309 | ||
| ACT-S J012755513642 | 12.1 | 39.5 | 38.8 | 14.1 | ATG20 J012756513641 | ||
| ACT-S J012756532933 | 9.6 | 27.6 | 26.9 | 18.1 | … | ||
| ACT-S J012834525520 | 6.3 | 18.5 | 17.4 | 17.7 | ATG20 J012834525519 | ||
| ACT-S J013107545707 | 6.3 | 23.8 | 22.3 | 10.3 | … | ||
| ACT-S J013225512903 | 5.3 | 18.4 | 16.8 | 12.9 | … | ||
| ACT-S J013306520003 | 74.7 | 239.0 | 239.0 | 17.1 | ATG20 J013305520003 | ||
| ACT-S J013409552612 | 6.0 | 24.7 | 23.1 | 8.8 | ATG20 J013408552616 | ||
| ACT-S J013541514943 | 6.6 | 19.8 | 18.8 | 16.7 | ATG20 J013540514945 | ||
| ACT-S J013548524414 | 18.2 | 51.6 | 51.6 | 18.8 | ATG20 J013548524417 | ||
| ACT-S J013727543942 | 7.4 | 25.3 | 24.2 | 12.6 | … | ||
| ACT-S J013949521739 | 12.1 | 35.2 | 34.6 | 17.7 | ATG20 J013949521746 | ||
| ACT-S J014648520232 | 25.3 | 77.5 | 77.5 | 16.0 | ATG20 J014648520233 | ||
| ACT-S J015358540649 | 11.4 | 33.7 | 33.1 | 16.9 | ATG20 J015358540653 | ||
| ACT-S J015420510750 | 49.3 | 172.1 | 172.1 | 14.2 | ATG20 J015419510751 | ||
| ACT-S J015559512538 | 5.8 | 18.2 | 16.9 | 15.0 | ATG20 J015557512545 | ||
| ACT-S J015649543940 | 13.4 | 42.2 | 41.6 | 15.1 | ATG20 J015649543949 | ||
| ACT-S J015817500415 | 5.8 | 24.6 | 22.8 | 8.3 | ATG20 J015817500419 | ||
| ACT-S J015914530902 | 9.2 | 25.3 | 24.7 | 19.8 | ATG20 J015913530853 | ||
| ACT-S J020448550257 | 14.7 | 48.4 | 47.9 | 13.6 | … | ||
| ACT-S J020649534528 | 5.4 | 15.2 | 13.9 | 19.4 | ATG20 J020647534543 | ||
| ACT-S J020920522921 | 11.1 | 30.5 | 29.9 | 20.2 | … | ||
| ACT-S J021046510100 | 470.3 | 1677.6 | 1678.0 | 13.6 | ATG20 J021046510101 | ||
| ACT-S J021519510435 | 5.5 | 17.3 | 15.9 | 15.1 | … | ||
| ACT-S J021603520007 | 12.7 | 34.6 | 34.1 | 20.1 | ATG20 J021603520012 | ||
| ACT-S J021709542750 | 5.8 | 17.3 | 16.1 | 16.4 | … | ||
| ACT-S J021835550354 | 12.5 | 43.0 | 42.4 | 12.5 | ATG20 J021834550350 | ||
| ACT-S J022216510627 | 9.4 | 29.7 | 28.9 | 15.1 | ATG20 J022215510629 | ||
| ACT-S J022330534737 | 40.5 | 119.9 | 119.9 | 19.4 | ATG20 J022330534740 | ||
| ACT-S J022530522547 | 15.3 | 40.2 | 39.8 | 21.4 | ATG20 J022529522555 | ||
| ACT-S J022820553732 | 5.6 | 21.9 | 20.2 | 9.8 | ATG20 J022820553725 | ||
| ACT-S J022821554601 | 25.9 | 104.7 | 104.7 | 9.0 | ATG20 J022821554603 | ||
| ACT-S J022912540324 | 112.5 | 333.1 | 333.1 | 19.9 | ATG20 J022912540324 | ||
| ACT-S J022925523226 | 17.2 | 45.3 | 44.9 | 21.7 | ATG20 J022925523226 | ||
| ACT-S J023245535634 | 8.1 | 21.9 | 21.2 | 20.7 | … | ||
| ACT-S J023357503014 | 6.3 | 21.4 | 20.2 | 13.0 | ATG20 J023356503020 | ||
| ACT-S J023924510824 | 8.5 | 25.2 | 24.4 | 16.8 | … | ||
| ACT-S J024040542942 | 6.9 | 21.7 | 20.7 | 15.3 | ATG20 J024040542933 | ||
| ACT-S J024154534541 | 6.7 | 17.8 | 16.9 | 20.9 | … | ||
| ACT-S J024313510512 | 11.5 | 35.1 | 34.5 | 16.2 | ATG20 J024313510517 | ||
| ACT-S J024539525756 | 7.6 | 19.1 | 18.4 | 23.4 | … | ||
| ACT-S J024614495346 | 10.3 | 42.8 | 41.9 | 8.5 | ATG20 J024614495350 | ||
| ACT-S J024947555619 | 5.4 | 22.8 | 20.9 | 8.2 | ATG20 J024948555615 | ||
| ACT-S J025112520822 | 5.7 | 15.0 | 13.9 | 21.8 | … | ||
| ACT-S J025204514554 | 5.4 | 14.4 | 13.2 | 20.7 | … | ||
| ACT-S J025328544151 | 246.7 | 837.5 | 837.5 | 15.3 | ATG20 J025329544151 | ||
| ACT-S J025629522711 | 5.3 | 14.1 | 12.8 | 21.0 | … | ||
| ACT-S J025838505200 | 33.2 | 113.6 | 113.6 | 14.6 | ATG20 J025838505204 | ||
| ACT-S J025849533210 | 7.2 | 19.5 | 18.6 | 20.6 | … | ||
| ACT-S J030056510229 | 11.2 | 36.8 | 36.1 | 14.0 | ATG20 J030055510229 | ||
| ACT-S J030132525603 | 15.0 | 39.7 | 39.3 | 21.6 | … | ||
| ACT-S J030327523427 | 24.8 | 66.4 | 66.4 | 21.0 | ATG20 J030328523433 | ||
| ACT-S J030616552808 | 15.2 | 56.4 | 56.5 | 10.9 | ATG20 J030616552808 | ||
| ACT-S J031206554135 | 18.3 | 72.7 | 72.7 | 9.5 | ATG20 J031207554133 | ||
| ACT-S J031426510430 | 29.0 | 90.6 | 90.5 | 15.2 | ATG20 J031425510431 | ||
| ACT-S J031823533148 | 18.6 | 51.6 | 51.6 | 19.6 | … | ||
| ACT-S J031910500031 | 7.5 | 30.2 | 28.9 | 9.3 | … | ||
| ACT-S J032207535419 | 6.5 | 18.3 | 17.3 | 19.6 | … | ||
| ACT-S J032212504229 | 11.0 | 35.5 | 34.8 | 14.5 | … | ||
| ACT-S J032327522627 | 14.9 | 41.0 | 40.5 | 19.7 | ATG20 J032327522630 | ||
| ACT-S J032650533658 | 17.0 | 48.0 | 47.6 | 18.9 | ATG20 J032650533701 | ||
| ACT-S J033002503518 | 6.5 | 21.9 | 20.7 | 13.5 | ATG20 J033002503519 | ||
| ACT-S J033114524149 | 9.0 | 24.4 | 23.7 | 21.1 | ATG20 J033114524148 | ||
| ACT-S J033126525829 | 11.9 | 31.6 | 31.0 | 21.5 | ATG20 J033126525830 | ||
| ACT-S J033133515352 | 5.9 | 16.1 | 15.0 | 19.8 | … | ||
| ACT-S J033444521851 | 7.1 | 19.2 | 18.4 | 20.4 | … | ||
| ACT-S J033554543028 | 14.8 | 44.0 | 43.6 | 16.6 | ATG20 J033553543025 | ||
| ACT-S J034157515140 | 6.3 | 16.6 | 15.7 | 22.1 | … | ||
| ACT-S J034348524112 | 8.3 | 21.9 | 21.2 | 21.5 | ATG20 J034349524116 | ||
| ACT-S J034940540111 | 7.4 | 21.7 | 20.7 | 17.1 | ATG20 J034941540106 | ||
| ACT-S J035128514254 | 50.7 | 145.2 | 145.2 | 21.6 | ATG20 J035128514254 | ||
| ACT-S J035343534553 | 5.6 | 16.3 | 15.0 | 17.9 | … | ||
| ACT-S J035700495549 | 14.1 | 58.3 | 58.3 | 8.7 | ATG20 J035700495547 | ||
| ACT-S J035840543403 | 8.3 | 27.4 | 26.4 | 14.0 | … | ||
| ACT-S J040401552022 | 7.0 | 27.6 | 26.3 | 10.2 | ATG20 J040400552023 | ||
| ACT-S J040621503509 | 5.5 | 20.5 | 18.8 | 10.8 | … | ||
| ACT-S J041137514918 | 22.8 | 72.5 | 72.5 | 14.9 | ATG20 J041137514923 | ||
| ACT-S J041247560044 | 5.4 | 23.4 | 21.4 | 8.1 | ATG20 J041247560035 | ||
| ACT-S J041313533157 | 13.2 | 39.5 | 38.9 | 16.6 | ATG20 J041313533200 | ||
| ACT-S J041959545618 | 7.2 | 23.8 | 22.7 | 13.8 | … | ||
| ACT-S J042503533201 | 49.8 | 152.1 | 152.1 | 18.6 | ATG20 J042504533158 | ||
| ACT-S J042842500532 | 33.1 | 154.7 | 154.7 | 6.9 | ATG20 J042842500534 | ||
| ACT-S J042852543001 | 6.8 | 21.8 | 20.8 | 14.5 | ATG20 J042852543007 | ||
| ACT-S J042906534943 | 31.7 | 87.4 | 87.4 | 19.9 | ATG20 J042908534940 | ||
| ACT-S J043221510926 | 26.5 | 86.8 | 86.8 | 14.1 | ATG20 J043221510925 | ||
| ACT-S J043651521632 | 14.1 | 38.4 | 38.0 | 20.4 | ATG20 J043652521639 | ||
| ACT-S J044115543848 | 6.1 | 19.4 | 18.2 | 14.9 | … | ||
| ACT-S J044158515456 | 30.4 | 87.5 | 87.5 | 18.2 | ATG20 J044158515453 | ||
| ACT-S J044502523426 | 9.1 | 25.5 | 24.8 | 19.4 | … | ||
| ACT-S J044746515103 | 9.7 | 27.2 | 26.5 | 19.3 | ATG20 J044748515100 | ||
| ACT-S J044821504140 | 10.8 | 37.1 | 36.3 | 13.1 | ATG20 J044822504133 | ||
| ACT-S J045028534659 | 8.9 | 24.8 | 24.1 | 19.5 | … | ||
| ACT-S J045103493632 | 12.1 | 58.2 | 58.2 | 6.3 | ATG20 J045102493626 | ||
| ACT-S J045239530637 | 8.4 | 23.3 | 22.6 | 19.3 | ATG20 J045238530635 | ||
| ACT-S J045503553119 | 9.8 | 36.7 | 35.8 | 10.8 | ATG20 J045503553112 | ||
| ACT-S J045559530236 | 6.9 | 18.3 | 17.4 | 21.2 | ATG20 J045558530239 | ||
| ACT-S J050018532122 | 10.6 | 28.2 | 27.6 | 21.3 | ATG20 J050019532121 | ||
| ACT-S J050401502314 | 15.8 | 59.6 | 59.5 | 10.7 | ATG20 J050401502313 | ||
| ACT-S J051355505543 | 6.5 | 22.0 | 20.9 | 13.4 | ATG20 J051355505541 | ||
| ACT-S J051812514359 | 8.7 | 24.7 | 23.9 | 18.6 | ATG20 J051811514404 | ||
| ACT-S J052044550832 | 7.0 | 24.1 | 22.9 | 12.7 | ATG20 J052045550824 | ||
| ACT-S J052317530836 | 8.4 | 22.9 | 22.1 | 20.5 | ATG20 J052318530837 | ||
| ACT-S J052743542614 | 8.9 | 26.0 | 25.3 | 17.3 | ATG20 J052743542616 | ||
| ACT-S J053117550431 | 14.1 | 47.9 | 47.3 | 13.0 | … | ||
| ACT-S J053208531035 | 18.9 | 51.2 | 51.2 | 20.3 | ATG20 J053208531035 | ||
| ACT-S J053323554941 | 16.7 | 65.7 | 65.7 | 9.7 | ATG20 J053324554936 | ||
| ACT-S J053458543903 | 10.0 | 30.8 | 30.1 | 15.7 | ATG20 J053458543901 | ||
| ACT-S J053909551059 | 8.9 | 30.6 | 29.7 | 12.8 | ATG20 J053909551059 | ||
| ACT-S J054025530354 | 11.5 | 31.7 | 31.1 | 19.9 | ATG20 J054025530346 | ||
| ACT-S J054029535628 | 5.5 | 14.8 | 13.6 | 21.2 | ATG20 J054029535632 | ||
| ACT-S J054046541825 | 133.4 | 416.2 | 416.2 | 17.4 | ATG20 J054045541821 | ||
| ACT-S J054223514259 | 27.4 | 79.7 | 79.7 | 18.1 | ATG20 J054223514257 | ||
| ACT-S J054357553206 | 6.2 | 22.2 | 20.9 | 11.3 | … | ||
| ACT-S J054830521836 | 9.3 | 25.2 | 24.6 | 20.2 | … | ||
| ACT-S J054943524629 | 63.4 | 180.3 | 180.3 | 21.8 | ATG20 J054943524625 | ||
| ACT-S J055047530502 | 9.0 | 24.5 | 23.8 | 20.1 | … | ||
| ACT-S J055152552642 | 8.6 | 31.5 | 30.4 | 11.1 | ATG20 J055152552632 | ||
| ACT-S J055811502957 | 16.0 | 57.5 | 57.5 | 11.8 | ATG20 J055811502948 | ||
| ACT-S J055830532640 | 6.1 | 16.6 | 15.6 | 19.7 | ATG20 J055830532631 | ||
| ACT-S J055946502656 | 12.5 | 45.9 | 45.2 | 11.2 | ATG20 J055947502652 | ||
| ACT-S J060213542509 | 12.5 | 38.3 | 37.7 | 15.9 | ATG20 J060212542507 | ||
| ACT-S J060749525747 | 13.1 | 36.0 | 35.5 | 19.6 | ATG20 J060749525744 | ||
| ACT-S J060849545650 | 38.4 | 136.9 | 136.9 | 13.7 | ATG20 J060849545642 | ||
| ACT-S J061715530615 | 13.1 | 39.6 | 39.0 | 16.2 | … | ||
| ACT-S J061846532948 | 6.3 | 18.7 | 17.6 | 16.8 | … | ||
| ACT-S J061955542718 | 12.1 | 39.1 | 38.5 | 13.8 | ATG20 J061955542713 | ||
| ACT-S J062142524136 | 37.3 | 118.9 | 118.9 | 17.4 | ATG20 J062143524132 | ||
| ACT-S J062552543856 | 28.5 | 105.9 | 105.9 | 10.8 | ATG20 J062552543850 | ||
| ACT-S J062620534136 | 15.1 | 46.7 | 46.3 | 15.8 | ATG20 J062620534151 | ||
| ACT-S J062649543233 | 8.9 | 32.8 | 31.8 | 11.0 | ATG20 J062648543214 | ||
| ACT-S J063200540501 | 6.1 | 21.0 | 19.7 | 12.7 | ATG20 J063201540455 | ||
| ACT-S J064111520223 | 5.8 | 19.4 | 18.1 | 13.5 | … | ||
| ACT-S J064319535850 | 32.1 | 104.5 | 104.5 | 14.0 | ATG20 J064320535846 | ||
| ACT-S J064629545120 | 9.7 | 37.7 | 36.7 | 10.1 | ATG20 J064629545116 | ||