The third version of the AMBER data reduction software.
Abstract
We present the third release of the AMBER data reduction software by the JMMC. This software is based on core algorithms optimized after several years of operation. An optional graphic interface in a high level language allows the user to control the process step by step or in a completely automatic manner. Ongoing improvement is the implementation of a robust calibration scheme, making use of the full calibration sets available during the night. The output products are standard OI-FITS files, which can be used directly in high level software like model fitting or image reconstruction tools. The software performances are illustrated on a full data set of calibrators observed with AMBER during 5 years taken in various instrumental setup.
keywords:
AMBER Instrument, Data Reduction, Visibility Calibration, Optical Interferometry, Multiaxial Recombination, Transfer Function1 INTRODUCTION
AMBER is the near infrared (– nm), three-telescope, interferometric beam combiner of the VLTI [1]. AMBER recombination scheme provides spatially coded fringes on an infrared camera. The data processing involves the modeling of the interferogram in the detector plane. Most of the basic data reduction involves the calibration, and the use of a linear relationship between the pixels of the interferogram and the three instantaneous complex visibilities, known as Pixel-to-Visibility Matrix (P2VM) [2].
The data reduction algorithms of AMBER have been incorporated in the instrument software itself [3], early in its building, in the form of a C library of functions named amdlib [4]. The AMBER consortium has developed the library for some time and the last version implemented at ESO is amdlib v2. This library provides the basic functions like the computation of the P2VM, the real-time measurement of various quantities used in monitoring the observation: atmospheric pistons between telescopes, instantaneous photometries, estimates of , fringe contrast…The same library is also used in the ESO data reduction pipeline for AMBER [5]. The C package is complete in the sense that it provides also the basic command-line tools necessary to “reduce” observations and its final product is uncalibrated OI-FITS files.
Following the delivery of the instrument to ESO, the amdlib library maintenance has been taken over by the Jean-Marie Mariotti Expertise Centre111http://www.jmmc.fr/amberdrs, however retaining most of the initial authors, and has now been augmented by a Graphical User Interface and scripting facility written in Yorick[6] (Sect. 3), with supplementary absolute calibration procedures (Sect. 3.3). Besides, after several years of use of the instrument, that produced numerous scientific results (see, e.g., the A&A special issue 464, 2007), the knowledge of the instrument behaviour (“true instrument”) that we have acquired during several commissioning runs allowed us to improve considerably the calibration procedure and data reduction scheme. The sum of all this effort is now available with version 3 of the “Amber Data Reduction Package”, whose changes compared to the previous versions are highlighted here.
2 amdlib v3 core Library Improvements
The amdlib core library, which is responsible for computing the instantaneous correlated fluxes and all the basic interferometric observables (, differential phases and phase closures), has been completely rewritten between versions 2 and 3. It implements most of the algorithms published by Chelli et al. (2009)[7] as well as workarounds of some of the problems audited by the AMBER Task Force team[8].
2.1 Data and Noise Model

The amdlib v3 library implements the new algorithms based on an improved data and noise model as described in Chelli et al. (2009)[7]. In a nutshell, the previous version of amdlib, based upon theoretical assumptions on the instrument, gave biased visibilities especially at low signal-to-noise ratios due to:
-
•
an incomplete data model overlooking both the presence of stray light and optical ghosts in the spectrograph and non-linearity effects in the detector at very low fluxes,
-
•
a too simplistic noise model. Both effects were enhanced at low S/N, where noise estimate and stray light level was becoming dominant.
As shown in Fig. 1, the biases at low fluxes have disappeared with amdlib v3. Actually these biases had less severe implications than it may appear here since they would be removed by the use of a calibrator of similar flux, which has always been enforced by the instrument’s observation policy. More details are given in the reference publication[7].
2.2 Algorithms
A number of improvements were also added to the core library:
-
•
The wavelength displacement between the three photometric beams is automatically taken into account.
-
•
In low-resolution mode, the algorithm detects the H-K interband phase shift and compensate the defects of repositioning of the spectrograph prism by displacing the wavelength table of the amount needed to bring the H-K interband to its nominal position.
-
•
amdlib v3 provides on-the-fly bad pixel detection.
-
•
amdlib v3 uses a refined algorithm to compute pistons, and an heuristic scheme to evaluate this piston “goodness of fit”. Also, we added a piston closure algorithm to improve piston estimate.
-
•
amdlib v3 uses a goodness of fit test to tag individual visibilities which are not well fitted by the carrying waves of the interferogram.
-
•
similarly, the program tags all visibilities where one of the photometries is below a used-defined value (0 being the default).
-
•
Finally, all bad values of the instantaneous or averaged interferometric observables are tagged in the OI-FITS file using the FLAG columns.
3 Yorick User Interface
 |
 |
 |
 |
 |
 |

The amdlib interface has been developed in Yorick [6], an open-source interactive scientific language which provides a set of nice interactive graphics plot windows (see Figs. 2, 3, 4 and 5).
This Yorick front-end goes beyond the mere interface of the amdlib library functions as we specifically developed:
-
1.
a file-browser graphical user interface (GUI), completely written in vanilla yorick,
-
2.
advanced scripts to handle many files in batch mode,
-
3.
display commands to check the quality of the data,
-
4.
several functions to change the behavior of amdlib like the default values for the the different parameters.
The file browser GUI is a side-development of amdlib, which is designed and provided as a separate module called yoco (for yorick contributions). This module also provides a cfitsio interface, a specific set of astronomy-related functions, plus several other utility scripts made to ease the use of some yorick functionality. For now this module is only distributed as a part of the amber data reduction package, but it will soon be distributed as a standalone yorick plugin since most of its functions could be used in contexts far beyond those of AMBER.
3.1 Set of batch scripts
A set of batch-mode scripts have all their names appended with “All” compared to the standard c-type amdlib functions. For example, the command-line C-filter proposes the commfunction amdlibComputeOiData, whereas the yorick command-line proposes both amdlibComputeOiData and amdlibComputeAllOiData. While the yorick function amdlibComputeOiData provides the same functionality as the C-filter complemented with a convenient GUI to select files graphically, the function amdlibComputeAllOiData computes the raw visibilities for a full night, automatically selecting observation, darks, and P2VM files.
3.2 Diameter of calibrator stars
This step consists in browsing all the calibration stars observed during a night and finding their associated angular diameters to correct in a further step their observed visibility from the expected one.
A filter called amdlibSearchAllStarDiameters has been implemented[9] to retrieve the diameters from the coordinates of the star included in the OI-FITS file, by browsing the CDS database222http://vizier.u-strasbg.fr. It has been included in amdlib v3 as amdlibQueryStarDiam and amdlibSearchAllStarDiameters. This filter fills in a text file located in a directory (the home directory by default) which contains a weighted-average of the diameters of the star found in all the known catalogs of stellar diameters.
This filter was already browsing through the following list of catalogs[10, 11, 12, 13, 14, 15]. We have added two catalogs to the previous list [9]:
-
•
the PTI catalog[16] which lists Northern stars, and which has some overlap with other catalogs.
-
•
a catalog made of all possible queries through the JMMC Searchcal333http://www.jmmc.fr/searchcal tool [17] (JMMC Stellar Diameter Catalog, JSDC). This tool is based on the work of Bonneau et al. (2006)[18], which determines stellar diameters using a series of color-color relations, and which selects calibration stars using generic flags such as multiplicity or variability flags contained in the simbad444http://simbad.u-strasbg.fr/simbad/ database. The corresponding catalog contains entries of calibration stars, up to the K-magnitude of .
We added the possibility to retrieve the diameters using a local copy of the catalogs, which allows one to get the diameter even without an internet connexion.
3.3 Absolute Calibration of Visibilities and Night Transfer Function
The yorick interface of amdlib v3 aims at allowing the user to compute the transfer function throughout the night with identification of the different set-ups and calibrators. Then the user would choose the right time interval and the right wavelength range to produce calibrated data. We are testing new ways to automate the visibility calibration in order to provide this feature in a forthcoming version of amdlib. We provide in the early release of amdlib v3 a library called amdlibCalibrate and two alternative ways to calibrate:
-
•
search the diameter of the calibrators in various catalogs described in Sect. using the Yorick command amdlibSearchAllDiameters and then using the software suite provided by F. Millour consisting of: amdlibComputeAllTransferFunction, amdlibShowTransferFunctionVsTime, amdlibShowTransferFunctionVsWlen, and amdlibCalibrateOiData.

Figure 6: Example of a night calibration for night 2008-01-01. The coloured markers are science objects and the black markers are calibrators. The solid and dashed lines correspond to the best estimate of the transfer function. -
•
or search the diameters using the same amdlibSearchAllDiameters and then using the amdlibCalibrateAllOiData provided by J.-B. Le Bouquin (see example in Fig. 6).
4 Application to long-term trending of AMBER
We have applied amdlib v3 to the complete set of calibrator data retrieved from the ESO archive between May 2004 and March 2010. It corresponds to 582 nights and files. The data has been reduced on a night-by-night basis using the amdlib...All... yorick scripts (see Sect. 3). Then we retrieved their diameters using the command amdlibSearchAllStarDiameters in order to compute the intrinsic visibilities and therefore compute transfer function. The transfer function is computed by averaging the transfer function between 2.1 and 2.4 m. Because sometimes the data were not consistent and could not lead to a visibility computation, because all calibrator data are not taken in the K band and because we have not found diameters for all targets, then the number of data fell from 5,400 to about 5,000 (by doing a more careful analysis, we would have kept much more data). The data (see Table 1) has been stored in a “comma-separated-value” database file to be further analyzed with TOPCAT555http://www.star.bris.ac.uk/~mbt/topcat/, an interactive graphical viewer and editor for astronomical tabular data.
| Config | Number of | Total number | Total number |
|---|---|---|---|
| observations | of observations | of files | |
| LR | 3925 | 6694 | 43,087 |
| MRK | 1478 | ||
| Total LR+MRK | 5403 |


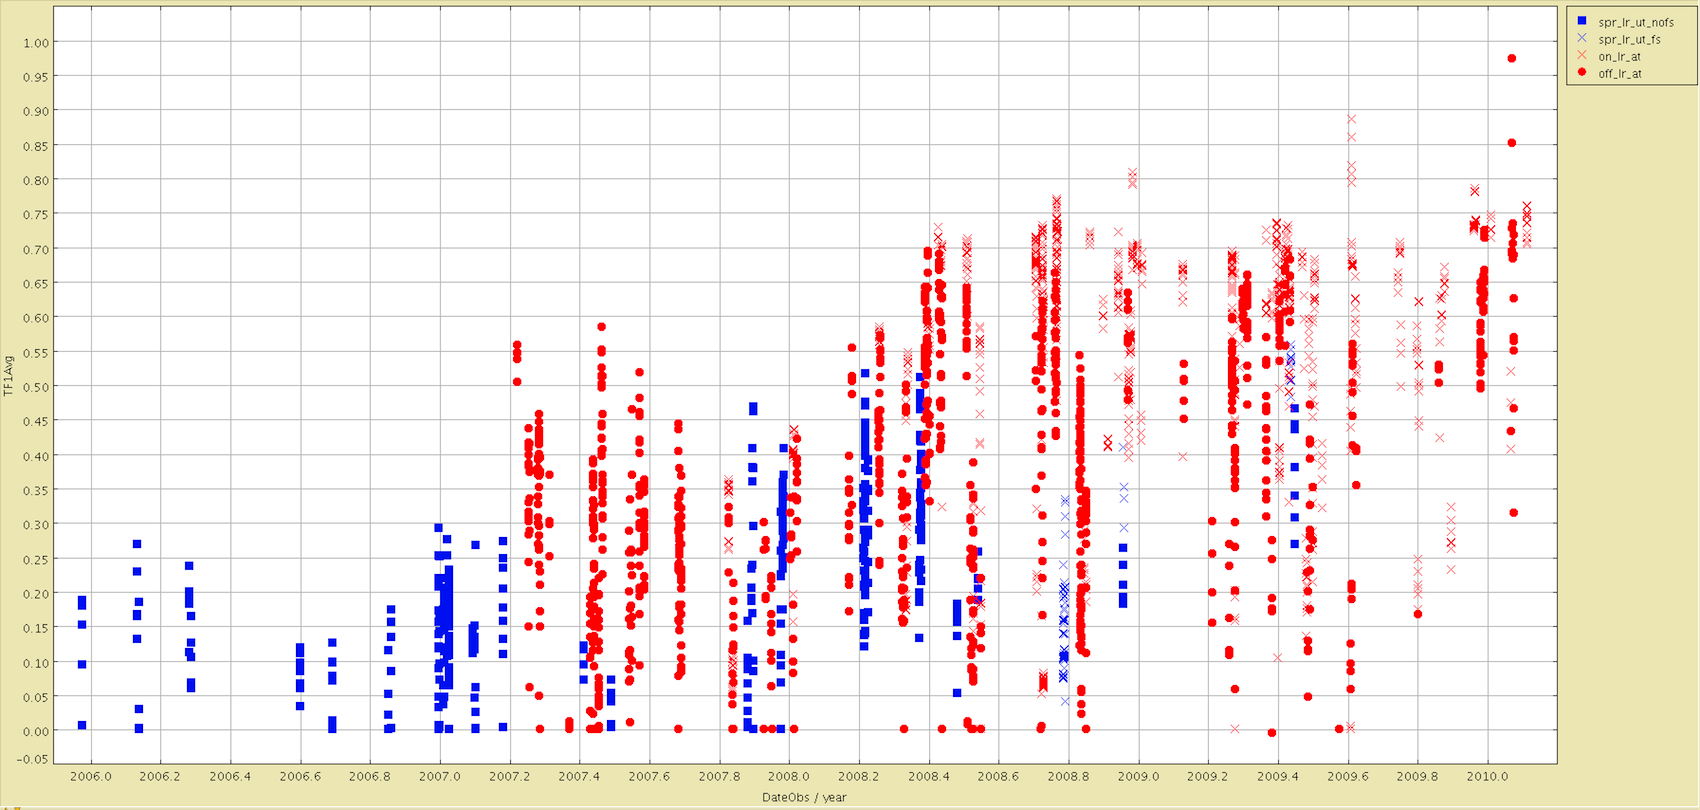
Figure 7 shows the distribution of the transfer function in LRK with time. Before the installation of the ATs in 2007, the averaged transfer functions were low because of the high level of vibrations on the UTs. It never went above 30%. The averaged value then increases with time to up to 50% with the UTs and 60% with the ATs. After 2008, the transfer function increases again with the ATs after the replacement of the polarizer. Most of the observations taken with FINITO ensure a function transfer above 50% with ATs.
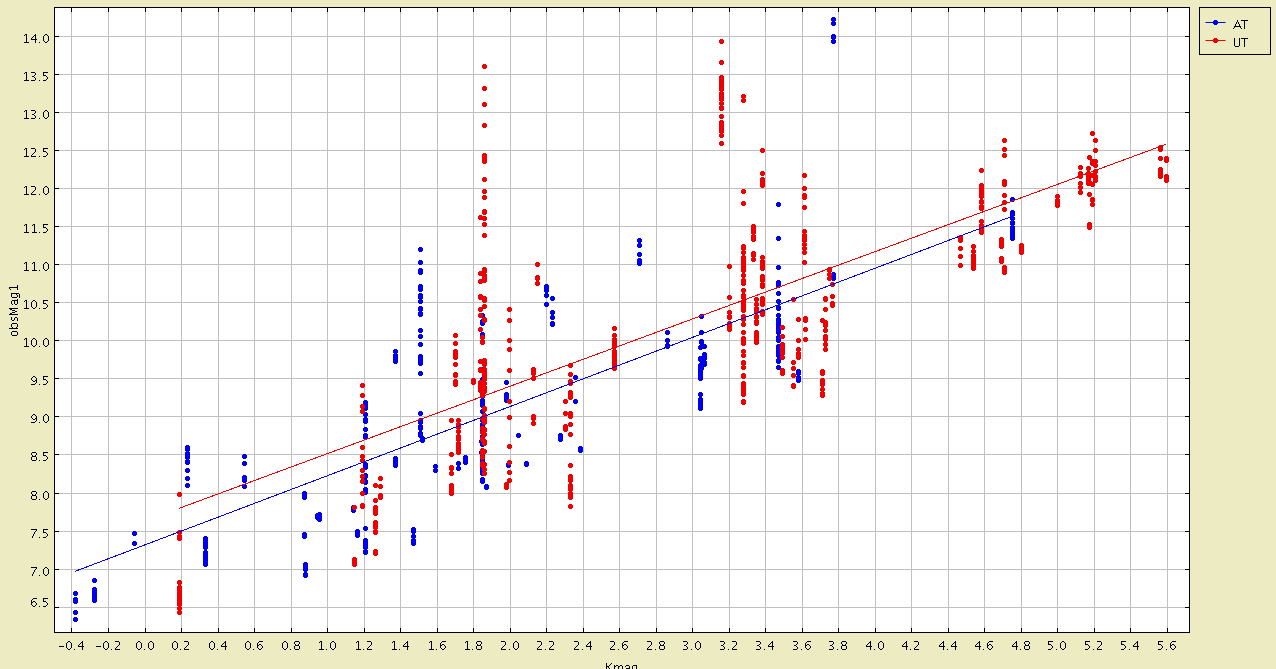
Figure 8 shows the correlation between the averaged flux measured by AMBER in MRK and translated in magnitude and the catalog -magnitude. The number of photons received have been divided by the surface of the mirror and the detector integration time so that the values measured with ATs and UTs can be compared (see the two lines). There is a difference of about 7 mag between the measured flux and the actual one leading to 0.15% of efficiency. However this takes into account not only the AMBER transmission but also the average seeing condition, the atmospheric absorption, the VLTI transmission,… In best cases, the total transmission is around 0.4%. Taking an atmospheric condition of 80%, VLTI transmission of 30%, a Strehl ratio of 0.3, this leads to an AMBER transmission of 5% which is very similar to what has been measured in the Assembly, Integration and Test report in 2004.

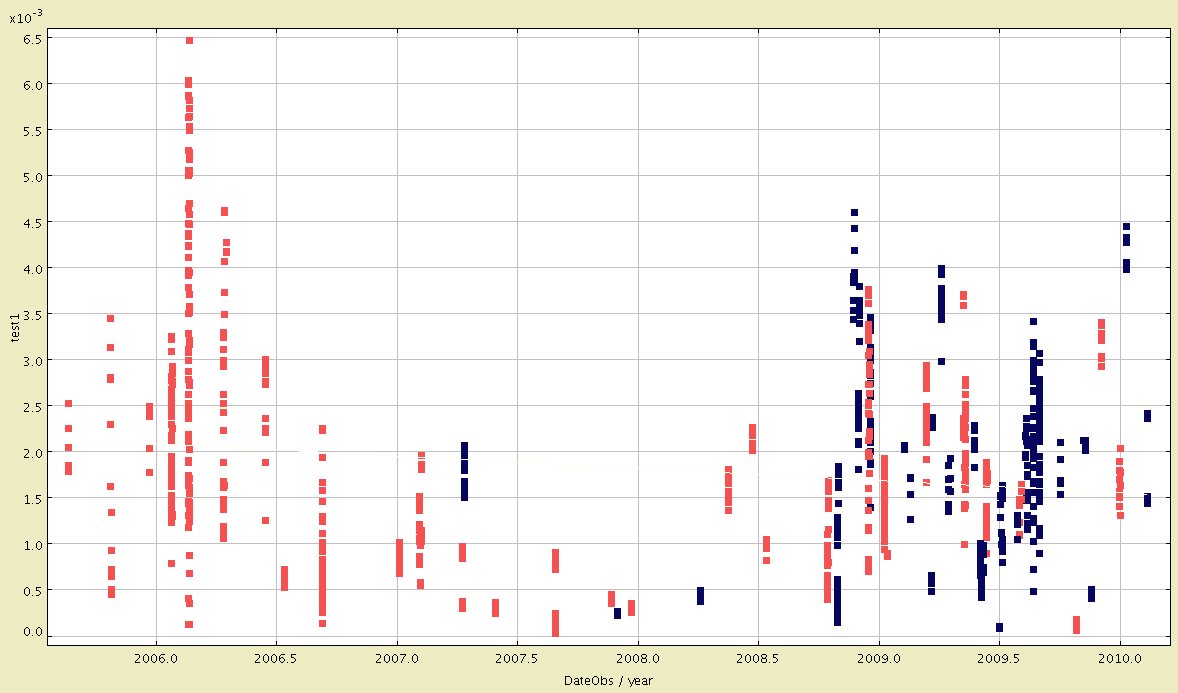
Figure 9 gives the transmission (ratio of flux measured in Fig. 8) measured on AMBER along the years. It seems that the instrument was correctly aligned in the beginning of the period and recently with a peak of transmission in spring 2006 when the AT commissioning occurred. An advice to ESO Paranal would be to follow these numbers in order to detect an anomalous lost of light.

Figure 10 displays the transfer function in presence of the fringe tracker FINITO as a function of the residual phase error of FINITO. The coherence time is also coded in colour. The lower the phase error on FINITO, the higher transfer function. Here again the performance is correlated with the value of the coherence time. This could be used to calibrate the response function of FINITO with AMBER.

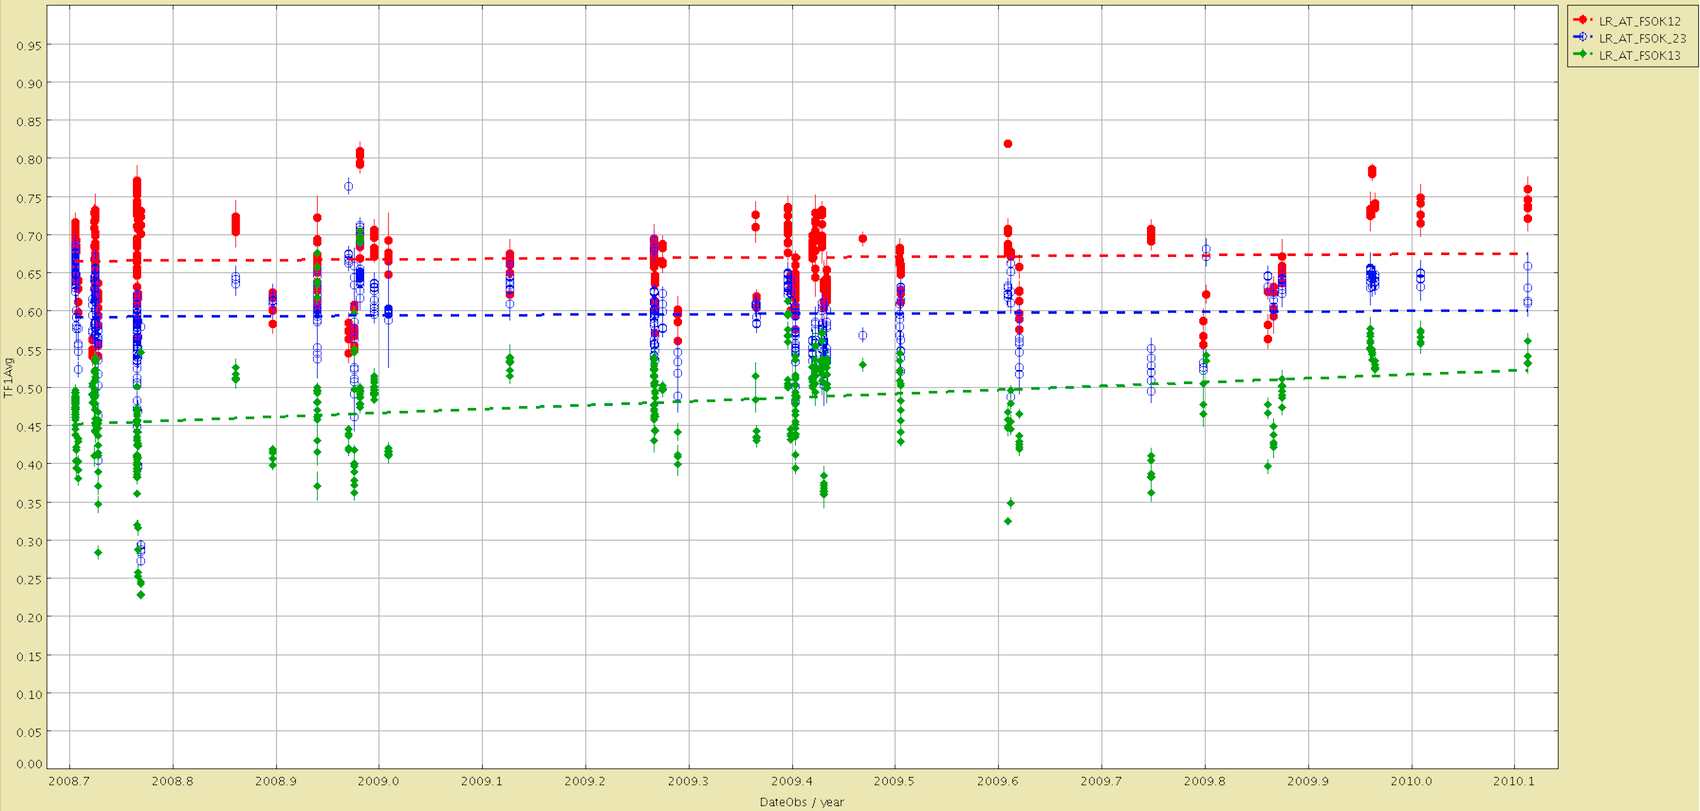
Figure 11 represents the status of the transfer function when FINITO is used with good phase errors on the ATs. One sees that the transfer function remains stable with time and that the 3 baselines do not have exactly the same value which is due to the concept of multiaxial beam combination.
5 Conclusion
We have presented here amdlib v3 and its functionalities. We have applied this to a data base of calibrators showing the long-term trending of AMBER both in transmission and transfer function.
The release to the community of the AMBER data reduction package containing amdlib v3 has been effective on 21 July 2010. All users are invited to download amdlib v3 and use it. Users should not hesitate to contact the JMMC User Support either by sending an email to jmmc-usr-support@obs.ujf-grenoble.fr or by visiting the JMMC support webpage666http://www.jmmc.fr/support in case of problems. This version will be maintained and upgraded whenever possible.
References
- [1] Petrov, R. G., Malbet, F., Weigelt, G., and coll., “AMBER, the near-infrared spectro-interferometric three-telescope VLTI instrument,” A&A 464, 1–12 (2007).
- [2] Tatulli, E., Millour, F., Chelli, A., Duvert, G., Acke, B., Hernandez Utrera, O., Hofmann, K.-H., Kraus, S., Malbet, F., Mège, P., Petrov, R. G., Vannier, M., Zins, G., and coll., “Interferometric data reduction with AMBER/VLTI. Principle, estimators, and illustration,” A&A 464, 29–42 (2007).
- [3] Le Coarer, E. P., Zins, G., Gluck, L., Duvert, G., Driebe, T., Ohnaka, K., Heininger, M., Connot, C., Behrend, J., Dugue, M., Clausse, J. M., and Millour, F., “AMBER instrument control software,” in [Society of Photo-Optical Instrumentation Engineers (SPIE) Conference Series ], A. F. M. Moorwood & M. Iye, ed., Society of Photo-Optical Instrumentation Engineers (SPIE) Conference Series 5492, 1423–1430 (2004).
- [4] Millour, F., Tatulli, E., Chelli, A. E., Duvert, G., Zins, G., Acke, B., and Malbet, F., “Data reduction for the AMBER instrument,” in [Society of Photo-Optical Instrumentation Engineers (SPIE) Conference Series ], W. A. Traub, ed., Society of Photo-Optical Instrumentation Engineers (SPIE) Conference Series 5491, 1222–+ (2004).
- [5] Hummel, C. A., “Pipeline reductions of AMBER calibrator data,” in [Society of Photo-Optical Instrumentation Engineers (SPIE) Conference Series ], Society of Photo-Optical Instrumentation Engineers (SPIE) Conference Series 7013 (2008).
- [6] Munro, D. H., “Using the yorick interpreted language,” Comput. Phys. 9(6), 609–615 (1995).
- [7] Chelli, A., Utrera, O. H., and Duvert, G., “Optimised data reduction for the AMBER/VLTI instrument,” A&A 502, 705–709 (2009).
- [8] Malbet, F., Duvert, G., Kern, P., and Chelli, A., “February 2008 AMBER Task Force run report,” tech. rep., ESO Doc No. VLT-TRE-AMB-15830-7120, issue 1.2, dated 16/04/2008 (arXiv: 0808.1315) (2008).
- [9] Millour, F., Valat, B., Petrov, R. G., and Vannier, M., “”Advanced” data reduction for the AMBER instrument,” in [Society of Photo-Optical Instrumentation Engineers (SPIE) Conference Series ], Presented at the Society of Photo-Optical Instrumentation Engineers (SPIE) Conference 7013 (2008).
- [10] Richichi, A. and Percheron, I., “First results from the ESO VLTI calibrators program,” A&A 434, 1201–1209 (2005).
- [11] Mérand, A., Bordé, P., and Coudé du Foresto, V., “A catalog of bright calibrator stars for 200-m baseline near-infrared stellar interferometry,” A&A 433, 1155–1162 (2005).
- [12] Richichi, A., Percheron, I., and Khristoforova, M., “CHARM2: An updated Catalog of High Angular Resolution Measurements,” A&A 431, 773–777 (2005).
- [13] Bordé, P., Coudé du Foresto, V., Chagnon, G., and Perrin, G., “A catalogue of calibrator stars for long baseline stellar interferometry,” A&A 393, 183–193 (2002).
- [14] Richichi, A. and Percheron, I., “CHARM: A Catalog of High Angular Resolution Measurements,” A&A 386, 492–503 (2002).
- [15] Pasinetti Fracassini, L. E., Pastori, L., Covino, S., and Pozzi, A., “Catalogue of Apparent Diameters and Absolute Radii of Stars (CADARS) - Third edition - Comments and statistics,” A&A 367, 521–524 (2001).
- [16] van Belle, G. T., van Belle, G., Creech-Eakman, M. J., Coyne, J., Boden, A. F., Akeson, R. L., Ciardi, D. R., Rykoski, K. M., Thompson, R. R., Lane, B. F., and PTI Collaboration, “The Palomar Testbed Interferometer Calibrator Catalog,” ApJS 176, 276–292 (2008).
- [17] Lafrasse, S., Mella, G., Bonneau, D., Duvert, G., Delfosse, X., Chesneau, O., and Chelli, A., “Building the JMMC Stellar Diameters Catalog using SearchCal,” in [Society of Photo-Optical Instrumentation Engineers (SPIE) Conference Series ], 7734 (2010).
- [18] Bonneau, D., Clausse, J., Delfosse, X., Mourard, D., Cetre, S., Chelli, A., Cruzalèbes, P., Duvert, G., and Zins, G., “SearchCal: a virtual observatory tool for searching calibrators in optical long baseline interferometry. I. The bright object case,” A&A 456, 789–789 (2006).