The Energetics of Molecular Gas in NGC 891 from H2 and FIR Spectroscopy
Abstract
We have studied the molecular hydrogen energetics of the edge-on spiral galaxy NGC 891, using a 34-position map in the lowest three pure rotational H2 lines observed with the Spitzer Infrared Spectrograph. The S(0), S(1), and S(2) lines are bright with an extinction corrected total luminosity of L⊙, or 0.09% of the total-infrared luminosity of NGC 891. The H2 line ratios are nearly constant along the plane of the galaxy – we do not observe the previously reported strong drop-off in the S(1)/S(0) line intensity ratio in the outer regions of the galaxy, so we find no evidence for the very massive cold CO-free molecular clouds invoked to explain the past observations. The H2 level excitation temperatures increase monotonically indicating more than one component to the emitting gas. More than 99% of the mass is in the lowest excitation (Tex 125 K) “warm” component. In the inner galaxy, the warm H2 emitting gas is 15% of the CO(1-0)-traced cool molecular gas, while in the outer regions the fraction is twice as high. This large mass of warm gas is heated by a combination of the far-UV photons from stars in photo-dissociation regions (PDRs) and the dissipation of turbulent kinetic energy. Including the observed far-infrared [OI] and [CII] fine-structure line emission and far-infrared continuum emission in a self-consistent manner to constrain the PDR models, we find essentially all of the S(0) and most (70%) of the S(1) line arises from low excitation PDRs, while most (80%) of the S(2) and the remainder of the S(1) line emission arises from low velocity microturbulent dissipation.
Subject headings:
galaxies: individual (NGC 891) — dust, extinction — infrared: galaxies — infrared: ISM — ISM: molecules1. Introduction
Half the interstellar medium in late type spiral galaxies is in molecular gas clouds, and about 90% by number of the atoms within these clouds are tied up in the H2 molecule. Stars form within molecular clouds, and the pure rotational lines of H2 are important coolants enabling cloud collapse. The cooling radiation from these lines is also important to the formation of the giant molecular clouds (GMCs) themselves. Despite its abundance and importance, very little is known about cool H2 on galactic scales. This is because H2 has no dipole moment, so that dipole radiation from its low-lying rotational energy levels is forbidden. The low lying levels instead radiatively decay by emitting relatively weak quadrupole (J = 2) radiation. Therefore the pure rotational lines of H2 are challenging to observe. Three of the low lying lines: the S(1) (17.0m), S(2) (12.3m), and the S(4) (8.0m) lines are transmitted through the Earth’s atmosphere, and have been detected from regions as diverse as supernovae remnants (Richter et al., 1995), photo-dissociation regions (PDRs) associated with OB star formation sites (e.g. Parmar et al., 1991), and disks enveloping young stellar objects (e.g. Bitner et al., 2007). However, detection of the lowest lying S(0) (28.2m) line, and detection of these lines from cool molecular clouds in external galaxies awaited the advent of the Short Wavelength Spectrometers (SWS) on the Infrared Space Observatory (ISO, e.g. Valentijn & van der Werf, 1999). A few years later, the Infrared Spectrograph (IRS111The IRS was a collaborative venture between Cornell University and Ball Aerospace Corporation funded by NASA through the Jet Propulsion Laboratory and the Ames Research Center. Support for this work was provided by NASA through Contract Number 1257184 issued by JPL/Caltech.) of the Spitzer Space Telescope became available and the detection of these lines from a wide variety of external galaxies became routine (e.g. Armus et al., 2004; Smith et al., 2004; Bernard-Salas et al., 2009).
H2 exists in two varieties: para (nuclear spins anti-aligned) and ortho (spins aligned). The relative ortho-to-para () abundances reflect the local gas temperature since proton exchange reactions with H+, H and H are effective in thermalizing the ratio (Sternberg & Neufeld, 1999, and references therein). At high temperatures (T200 K) the o/p ratio is set by the ratio of statistical weights at 3:1. Since there is no radiative coupling between the ortho and para species, when analyzing radiative transitions they can be treated as independent molecules. The lowest lying transitions for the para species are: J=2-0 (S(0), 28.2m), and 4-2 (S(2), 12.3m), and for the ortho species: J=3-1 (S(1), 17.0m), and J=5-3 (S(3), 9.7m). With their very small Einstein A coefficients the H2 level populations are easily thermalized at molecular cloud densities, and the emitted lines are nearly always optically thin. Therefore, the line intensities trace the column density of the emitting level, and since the line emitting levels are thermalized and lie hundreds of degrees above the ground state (larger than typical molecular gas temperatures), the line ratios within a species should reflect the gas temperature, Tgas. For example, the S(2)/S(0) line ratio gets larger by a factor of 150 as Tgas goes from 70 to 100 K. The para J=2 level lies just 510 K above the ground so it can be emitted by cool (T K) molecular gas and is an important coolant for molecular clouds in, for example, the early stages of collapse into protostars (T100 K, n100cm-3).
Are the rotational lines of H2 detectable from normal star forming galaxies, and if so, is the emitting gas important? Work with the ISO-SWS demonstrated that the answer to both questions is an emphatic yes. Large scale S(0) and S(1) line emission is reported both from the face-on Sc galaxy NGC 6946 (Valentijn et al., 1996), and the edge on Sb galaxy NGC 891 (Valentijn & van der Werf, 1999). The strong emission indicates surprisingly large masses of warm molecular gas. Spitzer IRS studies confirm that strong H2 rotational line emission and large masses of warm molecular gas are common in a wide variety of galaxies including nuclei of starburst galaxies (Devost et al., 2004; Bernard-Salas et al., 2009) and ULIRGs (Higdon et al., 2006b), in disk of galaxies (Roussel et al., 2007), extragalactic regions such as Stephan’s Quintet (Appleton et al., 2006), as well as tidal dwarf galaxies (Higdon et al., 2006a).
NGC 891 (catalog NGC891) is a nearby (d = 9.5 Mpc van der Kruit & Searle (1981)) Sb galaxy that is presented to us nearly edge-on and is thought to be a close Milky Way analogue. Since an edge-on galaxy presents the largest column densities to our telescopes, and the H2 rotational lines are optically thin, NGC 891 provides the best opportunity to study warm H2 in the outer reaches of galaxies. With the ISO-SWS, Valentijn & van der Werf (1999) detected the S(0) and S(1) lines at eight positions along the plane of NGC 891. The lines were surprisingly strong even in the outer regions of the stellar disk. Assuming = 3 they find warm (T130 to 230 K) molecular cloud component pervades the galactic disk with a total mass comparable to both the atomic HI and the cold molecular gas as traced through its CO emission: M M MHI. It would be a surprise if half the molecular ISM in the galaxy is warm, and it is a challenge to provide a heating mechanism for this gas. Furthermore, based on a drop in the S(1)/S(0) line intensity ratio at radii greater than 8 kpc, Valentijn & van der Werf (1999) argue for an additional cool (T 90 K) component which becomes dominant at large radii. With 2 to 3, the cooler component is massive: M 5-15 MHI in the outer disk. The cool molecular gas mass is so large that it can be a substantial fraction of the ”dark matter” required to drive the rotation curve out to the edge of the opitical disk of NGC 891. This is particularly intriguing due to theoretical work that suggests a large fraction of the “dark” baryonic matter in galaxies may be in CO free H2 clouds (e.g. Pfenniger & Combes, 1994). The detection of a massive cooler component, if proven correct, is a very significant result. These results need verification so we have repeated the observations of the S(0) and S(1) lines along the plane of NGC 891 using the more sensitive spectrograph on the Spitzer Space Telescope (Houck et al., 2004). In addition, the important S(2) line is included in the large instantaneous bandwidth of the Spitzer IRS. The addition of the S(2) line mapping provides a key element in tracing the gas excitation.
2. Observations
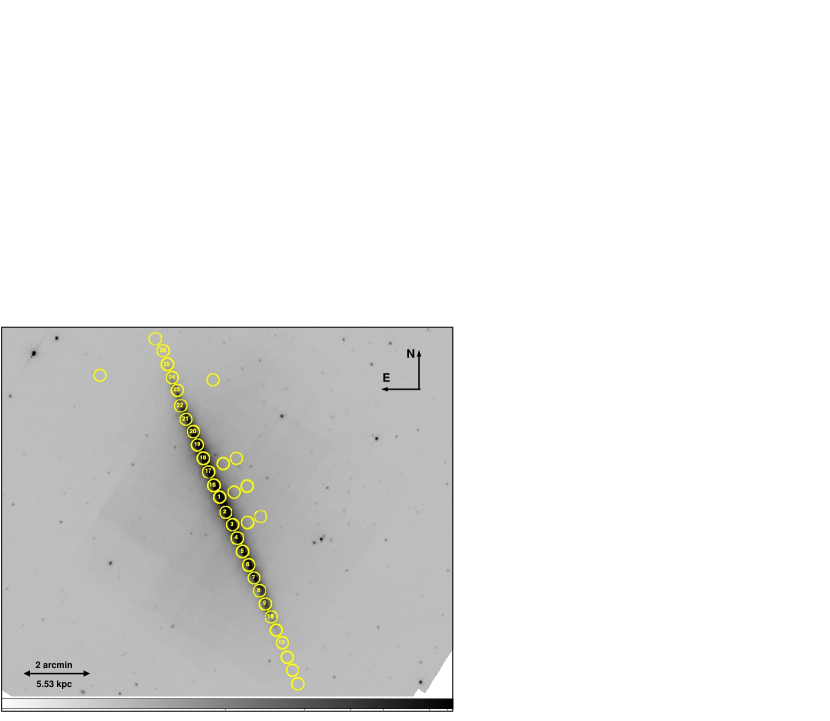
The galaxy was observed on 2004 August 7 as part of the IRSguaranteed time (GT) program (PID 97) (catalog ADS/Sa.Spitzer#0004935936) with the two high resolution (R600) modules, Short-High (SH) and Long-High (LH). We also obtained supplemental, deep integrations in selected positions through a Spitzer Cycle 4 open time (OT) program with PID 40877. For all observations, the SH slits covers the 9.7-19.5m range and it is 4.7 in size, while LH covers the 18.8-37.2m range and its size is 11.1. The width of each slit was designed so that it is equal to the first Airy ring of an unresolved point source at their short wavelength (see Houck et al., 2004). We obtained spectra for a total of 27 positions symmetrically sampled around the nucleus of the galaxy at a uniform spacing of 30 (1.53 kpc) with a position angle of 23 degree along the galactic plane of NGC 891. Six positions off the galactic plane to the northwest were also included to search for possible extended H2 emission. For each pointing, the on-source integration time was 60 and 28 secs for SH and LH respectively. In addition two off positions to the northeast and northwest away from the galaxy, which were used for background subtraction, were also obtained with twice the integration time. The IRS pointings are indicated in Figure 1 with circles of 25′′ in diameter, slightly larger than the length of the LH slit. The enumeration of the pointings follows the notation of Table 1, which provides the RA and Dec of each pointing along with its distance in arcsec along the disk of the galaxy from the central pointing (ID=1). Within the OT program, we obtained on-source integration times of 750 and 900 seconds for 9 positions (positions 1,6,8,10,12,20,22,24 and 26 in the notation of Figure 1) and 5 positions (positions 1,6,8,20,22) in SH and LH respectively. We also re-observed the off possitions for background subtraction.
Given the fact that IRS has no moving parts and that the long axis of the SH slit is perpendicular to that of the LH slit, we could not modify at will the orientation of the IRS slits on the sky. The slit orientation is determined by the ecliptic coordinates of the science target and the time of observations. By properly selecting the time of the observations, we were able to ensure that for the SH observations, which contain the S(1) and S(2) lines, the SH slit was placed with the long axis perpendicular to the plane of the galaxy. The LH observations, which trace the S(0) line, were obtained at the same time, with the LH slit placed with the long axis along the plane of the galaxy, since the two slits are perpendicular.
The data were processed by the Spitzer Science Center (SSC) pipeline version 17.2. As it is discussed in detail in the IRS manual, for each pointing, two observations are made by placing the target on two nod positions along the slit. The 128128 pixel detectors are read with successive non destructive reads before the final n-th read which also resets the array. For our observations N=16 for SH and 8 for LH. The SSC pipeline starts with the 128 SH data cubes and converts them to a 128 two-dimensional image after linearization correction, subtraction of darks, cosmic-ray removal, stray light and flat field correction. Each image, called basic calibrated data (BCD) contains the ten echelle orders of the SH and LH slits respectively. Our analysis started from these BCD files. At each pointing, we subtracted the dedicated off-source background image in order to remove the sky emission from our slit. Then, the two dimensional images were cleaned with the IRSCLEAN package to remove the bad pixels as well as to correct the so called “rogue” pixels. These are pixels whose values depend not only on the photons they collect, but also on the total number of photons hitting the whole 128 array, in a nonlinear manner 222For more details see the IRS manual at http://ssc.spitzer.caltech.edu/irs and http://ssc.spitzer.caltech.edu/dataanalysistools/tools/irsclean/ Finally, the cleaned images were used to extract the spectra using the full slit extraction method of the IRS data analysis package SMART (Higdon et al., 2004). The outputs from SMART produced one spectrum at each nod position, and thene the two nod position spectra are combined. The data from the edge pixels within each echelle order were manually cleaned by truncating a few pixels at the beginning and end of each order and when there was inconsistency, the blue end of the order was preferred. No scaling was needed between the adjacent grating orders within the same module. The final errors include both statistical and systematic effects, and we report them in Table 1. The overall absolute spectrophotometric uncertainty of IRS is 5%, so that spectrophotometric uncertainty is small compared with the signal-to-noise ratio of our spectra.
3. Results
3.1. Line Morphology
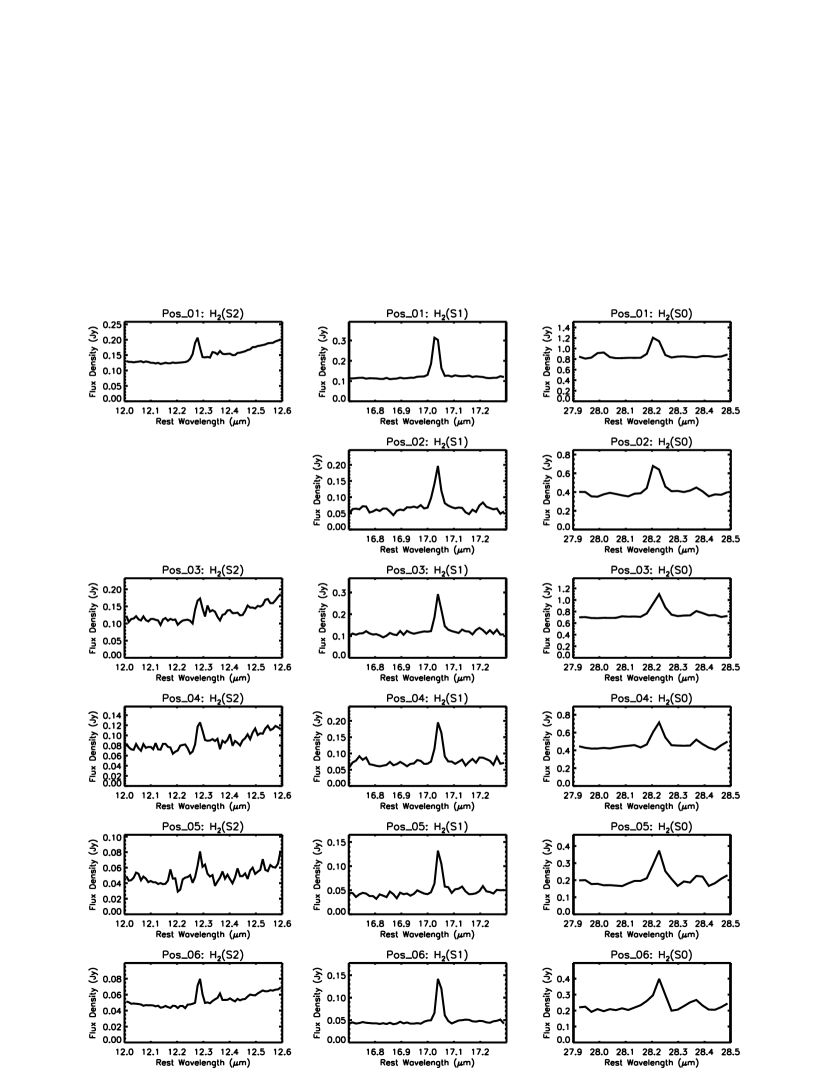
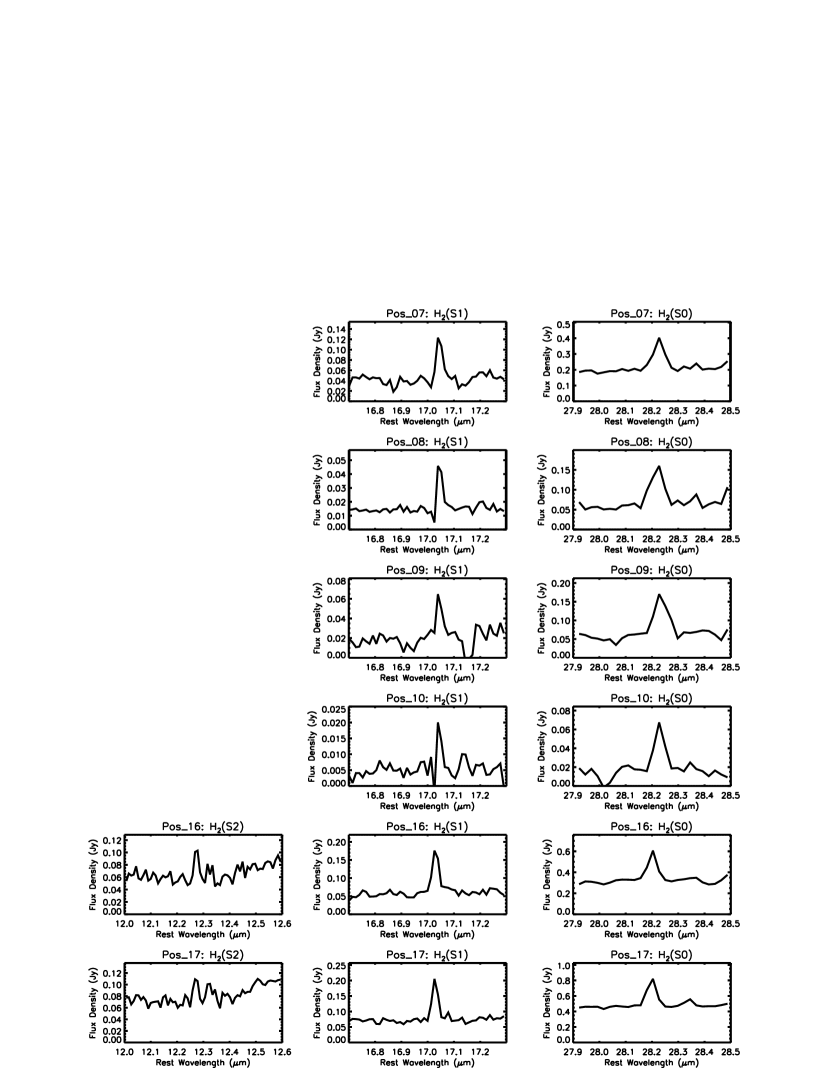
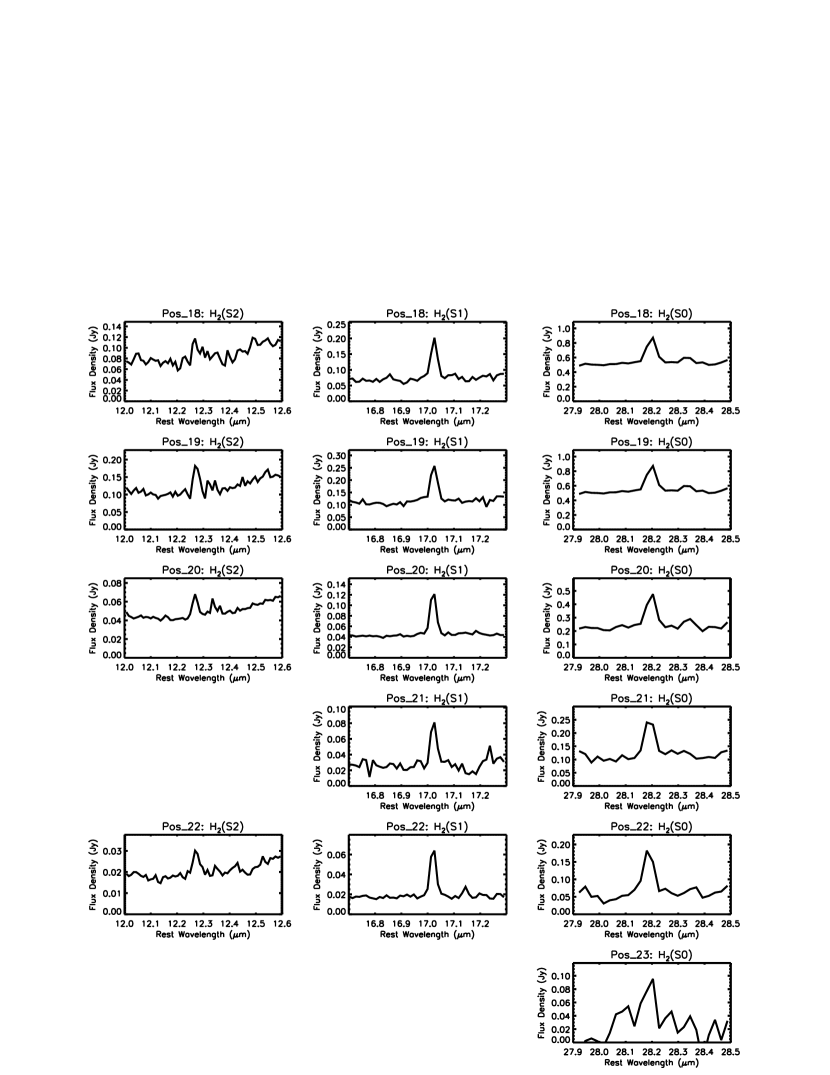
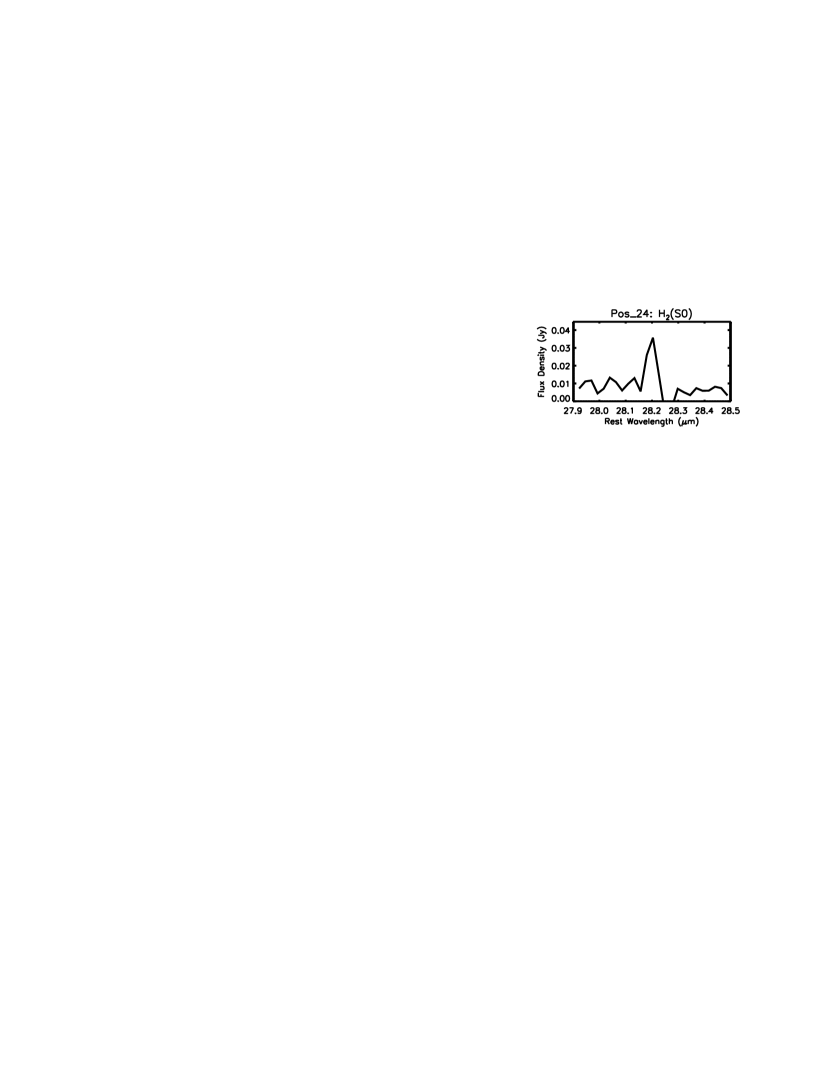
Table 1 lists the observed line fluxes and upper limits at all positions, while the locations on the galaxy where these spectra were obtained superposed on an 8m Spitzer/IRAC image of the galaxy, are indicated in Figure 1. We also plot in Figure 2 the spectra around the S(0), S(1), and (S3) H2 lines from locations where at least one line has been detected. Both the S(0) and S(1) lines are clearly detected at 17 of the positions along the galactic plane. Figure 3a plots the line intensity distributions along the plane of galaxy. The lines have fairly uniform intensities in the inner galaxy, with some enhancement at the nucleus, beginning to fall off at 6.1 kpc NE and 4.6 kpc SW of the nucleus to values below our detection threshold at regions beyond 13.8 kpc NE and SW of the nucleus. The S(2) line was only detected in 11 positions, all within 10 kpc of the nucleus, but this is very likely a sensitivity issue. The detection limit is similar for all three lines, but the S(2) is typically 4 times fainter than the S(0) line and 1.7 times fainter than the S(1) line. Therefore, its distribution could well be nearly identical to the lower J lines. The line intensity ratios are also fairly constant across the galaxy, with the exception of enhanced S(1) line emission at the nucleus.
We do not detect H2 line emission off the plane of the galaxy. However, our integration time is rather modest, so perhaps this is not too surprising: Rand et al. (2008) obtained substantially deeper integrations (nearly 6.5 hours, or 400 times longer than ours) at two positions 1 kpc off the disk, where they clearly detected the S(1) line. Based on these results Rand et al. (2008) estimate the scale height of the S(1) line emission is 8.4 to 9.9” (390-490 pc, based on a distance of 9.5 Mpc). Correcting their results for the expected extinction of the lines by dust, they estimate that the intrinsic width of the warm molecular gas is 4.8 to 5.7 (220 to 260 pc).
3.2. Comparison with ISO Results: No Evidence for a Massive Cold Component
It is important to compare our Spitzer IRS results to those from the ISO SWS study reported in (Valentijn et al., 1996). Howevever both the ISO and Spitzer maps are sparsely sampled, and neither was obtained with a large enough beam to detect all of the extra-planar emission if it is as extensive as the results of Rand et al. (2008) suggest. We first correct for the missing extra-planar emission, by assuming the apparent (exponential) scale height for the H2 line emission is the average of Rand et al. (2008)’s values: 9.1. We took Spitzer LH (S(0) line) data with the slit width extending 5.55 perpendicular to the plane, and SH (S1) and S(2) line data with the long axis of the slit expending 5.65 perpendicular to the plane of the galaxy. For these cases, we calculate that 45% and 46% of the line flux (integrated perpendicular to the plane) is detected within our LH and SH beams respectively. The (rectangular) ISO beams were 20 and 14 for the S(0) and S(1) lines respectively, and these beams were tilted so that the long axis of the rectangle traced the plane of NGC 891 (Valentijn et al., 1996). For these cases, and again comparing against an assumed scale height of 9.1 and integrated perpendicular to the plane, we calculate that 45% and 53% of the line flux was detected by the ISO SWS spectrometer. We apply these extra-planar corrections to both data sets for proper comparisons. We also must correct for flux not detected along the plane of the galaxy, since neither ours, nor the ISO data sets are fully sampled. The ISO SWS slit along the plane of the galaxy (point-to-point, along the diagonal) was 34 and 24 for the S(0) and S(1) lines respectively. Since the Spitzer data are only sampled every 30′′, we must interpolate between Spizer samplings to properly compare with the ISO data. For both the S(0) and S(1) data sets, we interpolate linearly between the Spitzer sampled regions, then integrate within a region covering the angular extent of the ISO beam along the plane. This should be a good estimator for most of the galaxy, especially for the S(0) line, where the ISO and Spitzer beam sizes are nearly the same. A possible exception is the nucleus in the S(1) line, where the relatively much smaller Spitzer beam may emphasize any strong central peak. Figure 3b illustrates the comparison between Spitzer and ISO observations including all the effects described above. For the inner (r 7 kpc) galaxy our Spitzer line fluxes are about a factor 1.55 and 1.85 larger than those of ISO in the S(0) and S(1) lines respectively, but the Spitzer S(1)/S(0) line ratio is not much different than the ISO S(1)/S(0) ratio. Therefore, we derive similar excitation temperatures for the inner galaxy as those presented in Valentijn et al. (1996)(see section 4.1.1 below).
However, in the outer galaxy (r 7 kpc) the S(1)/S(0) line ratios diverge. The Spitzer S(1) line flux does not fall off nearly as rapidly as that measured by ISO, so that the Spitzer/ISO ratio grows to 2.57 in the outer regions. In addition, the Spitzer S(0) line flux falls off more rapidly in the outer galaxy than does the ISO S(0) line flux, so that Spitzer/ISO ratio gets smaller, to 0.81 in the outer regions. Therefore, unlike our Spitzer results, where the S(1)/S(0) line ratio is nearly constant over the disk, the ISO results show a marked decrease in the S(1)/S(0) ratio for the 3 regions sampled at r 7 kpc from the nucleus. It is this change in line ratios for the outer regions that led Valentijn & van der Werf (1999) to invoke a second, cool gas contributor to the observed S(0) line emission. Beam size is not the source of this discrepancy: since the ISO beam has its diagonal along the plane of the galaxy, it was equally sensitive to extraplaner emission as the Spitzer beam. Furthermore, it is not just the added S(0) line flux in the outer disk, but it is also the dearth of S(1) line radiation in the outer disk reported in the ISO observations that changes the observed S(1)/S(0) line ratio, hence the derived gas excitation. The nearly constant line ratios revealed by the Spitzer observations are consistent with warm molecular gas, with near uniform excitation conditions over the galaxy - there is no evidence for an additional cool gas component. Furthermore, as we will show below, this warm molecular gas component is far less massive (13%) than the cold H2 emitting molecular component ( M⊙) invoked by Valentijn & van der Werf (1999).
3.3. Extinction Correction
To begin an analysis of mid-IR line emission from the edge-on galaxy NGC 891, we need to first make corrections for the non-negligible extinction in the lines due to dust along the line of sight. The H2 line emission is likely to be highly correlated with that of the CO(1-0) line which is tightly confined to the plane of the galaxy, so that to make a good extinction correction, we need high spatial resolution proxies. Fortunately, there exist high resolution images of NGC 891 in the two primary tracers of the neutral ISM – the HI 21cm line which traces atomic hydrogen, and the CO(1-0) line which traces cold molecular hydrogen. We calculate the total column density in the molecular gas and atomic gas components within our Spitzer beams as a function of distance along the plane of the galaxy as follows.
For the CO(1-0) distribution, we use the data contained in Figure 2 of Scoville et al. (1993). These data were obtained with a 2.3′′ beam, but are plotted in their Figure 2 by integrating the emission perpendicular to the plane of the galaxy, then refering it to a 1′′ strip along the plane. To compare with our data, we therefore re-expand their strip to follow an exponential fall-off perpendicular to the plane of the galaxy with the local CO(1-0) scale height (also given in Figure 2 of Scoville et al. (1993)). The observed scale height (given as full-width-at-half-maximum) varies and corresponds to a 1/e scale height ranging from about 2.9′′ at the nucleus to 4.3′′ in the outer regions. For regions just exterior (further removed from the nucleus along the galactic plane) to those explored by Scoville et al. (1993) (r200′′) we have added in the IRAM 30 m telescope (20′′ beam) observations of Garcia-Burillo et al. (1992), scaled assuming the line emission follows the 4.3′′ scale height observed in the outer galaxy by Scoville et al. (1993). We used a CO(1-0) integrated intensity to H2 column density conversion factor of X = cm-2/(K km s-1) as for the solar neighborhood (Dame et al., 2004)333A different choice of X will not change our results in any important way. For example, if X = cm-2/(K km s-1), then the extinction corrected luminosities of the H2 lines go up 10%, and the overall calculated warm (H2 line emitting) to cold (CO(1-0) line emitting) molecular mass fraction goes down to 11% from 16% (see section 4.2.2). The derived physical parameters of the gas, and its excitation mechanisms do not change significantly., and derived an expected hydrogenic column density within 1′′ strips parallel to the galactic plane with an exponential fall-off as given in Scoville et al. (1993).
The HI column density is taken from the 21 cm line map of Rupen (1991) with a 7′′ beam. Since the scale height of the HI emission is relatively large ( 6′′, Oosterloo et al. (2007), we estimate the HI column density within our Spizer beams by direct inspection of the HI maps. Note that since the HI column is a small fraction of the H2 column (as traced by CO) in the the regions of the galaxy where extinction is important (within 5 kpc of the nucleus, see Figure 4a), a more detailed model of the HI distribution is not warranted.
The total neutral gas mass is nearly equally divided into molecular ( M⊙, Scoville et al. 1993), using X = cm-2/(K km s-1) , and atomic ( M⊙ Oosterloo et al., 2007) components. We plot the calculated column density of hydrogen nuclei derived from the CO and HI observations, smoothed to our S(0) beam size along the plane of the galaxy in Figure 4a. The column plotted only includes mass within our Spitzer beam which extends 5.55′′ perpendicular to the galactic plane: the mass missed at high galactic latitude is not included in this plot. The total column density of hydrogen nuclei within our beam peaks at cm-2 at the nucleus and is above cm-2 from -10 to +10 kpc along the galactic plane.
Such large columns lead to sizable extinction even for the S(0) line at 28m. To find the extinction, we take the column density of hydrogen nuclie as traced by the CO distribution (modeled as an exponential fall-off) and the observed HI distribution within our beam to calculate the expected extinction as a function of distance from the galactic plane. The extinction calculation is broken up into 1′′ strips parallel to the plane. For each strip, we first find Aλ, and then we calculate the local extinction correction, C() as defined below. We then average these extinction corrections within our beam to get an estimate for the total correction that must be applied to the observed H2 line emission. Extinction is estimated using the “Galactic” dust model of Draine (2003) for which A(28m)/N(H) mag cm2, A(17m)/N(H) A(12m)/N(H) mag cm2, and make the correction for the higher gas to dust mass ratio observed in NGC 891 (260, see Alton et al., 2000) as compared with the Galaxy (160, see Sodroski et al., 1994). We assumed a “mixed” extinction scenario, where the dust is mixed with the warm H2 gas, and for which the extinction correction, C() is given by C() = (1 - e)-1. At the nucleus we derive a (beam averaged) extinction correction for the S(0) line of C(28m)1.38, and for the S(1) and S(2) lines C(12m), C(17m)1.71. The extinction correction as a function of offset from the nucleus is plotted in Figure 4b. The correction is significant for much of the inner (r ¡ 5 Kpc) galaxy, and larger for the S(1) and S(2) lines, so that the extinction correction will change the line ratios.
3.4. Line Luminosity
The line fluxes change only gradually over the plane of the galaxy, and the slits likely enclose nearly all of the flux perpendicular to the plane. Therefore, to find the total line luminosity, we simply integrate the line fluxes along the plane of the galaxy, interpolating in a linear manner between samplings. For both the S(0) and S(1) lines, this amounts to integrating the observations and multiplying by the ratio of the sampling interval to the beam size along the plane: 30/22.3 = 1.35 and 30/4.7 = 6.38 for the S(0) and S(1) lines respectively. The total line fluxes so obtained are F(S(0)) W m-2, and F(S(1)) W m-2. At a distance of 9.5 Mpc, the corresponding line luminosities are , and L⊙ for the S(0) and S(1) lines respectively. The S(2) line is not as well sampled as the S(1) line due to sensitivity limits, but assuming the S(2)/S(1) line ratio for the detected positions ( 0.59) is the same throughout the galaxy, the S(2) line luminosity would be L⊙. The total observed (and interpolated) power for these three low-lying lines is therefore L⊙, or of the total IR (TIR, 3-1100 m) luminosity, L⊙ (flux densities from Brauher, Dale and Helou (2008), TIR as defined in Dale & Helou (2002)). The low J molecular hydrogen lines are therefore 1.5 times as bright relative to the TIR continuum when compared to the sample of 57 normal galaxies surveyed by Roussel et al. (2007) who find a typical ratio near with a scatter of about a factor of two.
Correction for extinction before integrating along the plane (factors of 1.16, 1.32, and 1.32 for the S(0), S(1) and S(2) lines respectively, section 3.3, above), which is bound to be more important for the edge-on NGC 891 than for the typically less inclined galaxies in the Roussel et al. (2007) sample, the total H2 luminosity is L⊙ or of the TIR luminosity, or twice the typical values found in Roussel et al. (2007).
The question of line flux at high scale heights missed by the Spitzer beam is more difficult to quantify. If the scale height derived by Rand et al. (2008) applies the flux we observe is roughly equal to that we miss at scale heights greater than that of our beam ( 5.6′′). The missed (high z) emission summed over the three lines is in this case therefore L⊙. The high-z emission would suffer very little extinction, so the the total luminosity in all three lines would be L⊙ in the case of a 9.1′′ (Rand et al., 2008) scale height. Another estimate is presented by presuming the H2 scale height is the same as that of the CO(1-0) line. Since the CO scale height is observed along the entire galactic plane, this is the correction we prefer. For this case, the flux exterior to our beam (without extinction correction) is just 16 of the flux within our beam (before extinction correction) so that the total luminosity in all three lines is L⊙. Correcting for both extinction and extra-planar emission, the H2 luminosity is therefore to of the TIR luminosity.
4. Discussion
4.1. Intensity Ratios
To derive the physical properties of the emitting gas, we need to compute ratios between lines measured within different apertures. Inspecting Figure 3, it is clear that for the most part, the flux in the three lines changes gradually at the scale of LH slit length (22.3′′) along the plane of the galaxy. The S(1) and S(2) lines are observed with the long (11.3′′) axis of the SH slit perpendicular to the plane so that it matches the z-sampling of the S(0) beam. Therefore, to take ratios among the H2 lines, we need only correct for the beam size along the galactic plane. We do this by linearly interpolating between S(1) and S(2) samples (taken with a 4.7′′ beam along the plane of the galaxy), and then estimating the average intensity expected in the 22.3′′ S(0) beam from this interpolation. To obtain the physical parameters of the gas, we use the extinction corrected values of the fluxes contained within our Spitzer beams presented in Figure 5a. The extinction corrected line ratios are presented in Figure 5b.
4.2. Gas Excitation: Analytical Models
4.2.1 The Ortho to Para ratio
The low lying rotational lines of H2 are optically thin and easily thermalized so that the lines and their ratios probe the temperature and column density of the emitting gas. The S(2) and S(0) lines both arise from the para species of H2 so that it in the high density limit (nncrit(J=4) cm-3, Le Bourlot et al. (1999)), the IS(2)/IS(0) ratio is given by the para excitation temperature Tex:
| (1) |
where Ai is the Einstein A coefficient for spontaneous emission of level i (AS(2) = 2.75, AS(0) = 2.94, AS(1) = 4.76 Wolniewicz et al., 1998), is the frequency of transition, gi is the statistical weight of the level (gS(2)=9, gS(0)=5), and E is the energy difference between the emitting levels (= 1172 K). We plot the J=4 level excitation temperature so derived in Figure 6 (marked as S(2)/S(0)). The excitation temperature is remarkably uniform over the disk at Tex(2,0)=2048.5 K.
Between the para and ortho species, the line intensity ratios have the additional factor of the relative abundance, the ortho to para ratio, . For a high temperature (T 200 K) gas in local thermodynamic equilibrium, this ratio is given by the ratio of the statistical weights, of the two species, = 3. Assuming the ratio is 3, then averaged over the eleven positions for which the S(2) line is detected (hereafter, the “S(2) region”), the average extinction corrected S(1)/S(0) and S(2)/S(1) line intensity ratios (1.92 and 0.59) yield level excitation temperatures of Tex(1,0) = 125 K, Tex(2,0) = 204 K, and Tex(2,1) = 388 K respectively. The level excitation temperatures are monotonically increasing with J, which is permitted if there is more than one emitting components within the beam, each with a different gas excitation temperature. For temperatures less than K, the equilibrium ratio is less than 3. Burton et al. (1992) calculate the equilibrium ratio as a function of gas temperature. Making use of this work, we arrive at a self consistent solution for Tex(1,0) = 134 K with = 2.30. Since the S(1)/S(0) line intensity ratios are fairly uniform across the galaxy, we assume this ratio applies everywhere, and use it to compute Tex(1,0). Notice that Tex(2,0) is not affected by the ratio, and Tex(2,1) is much greater than 200 K, so that . Figure 6 shows the computed excitation temperatures across the disk of the galaxy. As we found for Tex(2,0), Tex(1,0) is also remarkably uniform across the plane with a mean value of Tex(1,0)=1326 K. Tex(2,1) shows more variation, but this is largely not statistically significant. Excluding the data point 6 kpc to the NE of the nucleus, the mean value is Tex(2,1) = 372 41 K. The position at 6 kpc NE of the nucleus is statistically higher excitation, with Tex(2,1) = 556 +127/-87 K.
4.2.2 Warm H2 Gas Mass Fraction: Enhancement of the Northern Ring
Since the line emission is optically thin, the line intensity yields the gas column of the emitting level, Nu: I = h AS(n) N, where AS(n) is the Einstein A coefficient for the S(n) transition at frequency for n = 0,1,2. Averaged over the eleven positions from which the S(2) line is detected, the column densities are Ncm-2, N cm-2, and N cm-2. The total column density of molecular hydrogen is given by: Ntot = (Nu/gu) Z(T) e where gu = (o/p)/(2J+1), and Z(T) is the partition function:
| (2) |
The symbols have their meanings as before. Since the level excitations are not all the same, there must be more than one warm molecular gas component. The simplest model has two gas components, a “warm” component, which will emit most of the observed S(0) line, and a “hot” component that will emit most of the observed S(2) line. Both components will emit in the S(1) line. With a two component model there can be no unique solution as there are 4 variables (2 components, each with a Tex and N(H2)), and just 3 observables (the lines). We model the line emission averaged within the “S(2) region”. The minimum mass solution will have a high gas temperature for the warm component. The largest gas temperature permitted by the data is the observed 1-0 excitation temperature. For this temperature, all of the observed S(0) and S(1) line emission arises from the warm component. Therefore, there can be no self-consistent solution for all three H2 lines since the warm component is too cool to emit much in the S(2) line, and hot component, which will emit most of the the S(2) line, will also emit in the S(1) line. Using the partition function, and the relationship between line intensity and column density (IJ,J-1 = hJ,J-1AJ,J-1NJ/(4)), we have explored the gas temperature, column density parameter space for self consistent solutions, and find the minimum mass solution has gas temperatures of Twarm = 127 K (o/p ratio shifts to 2.2), and Thot = 1700 K, and H2 column densities of N(H2,warm) = 3.8 cm-2, and N(H2,hot) = 8.2 cm-2. Within this model, 75 and 25 of the observed S(1) line emission arises from the warm and hot components respectively. The warm component emits less than 5 of the observed S(2) line, while the hot component emits less than 1 of the S(0) line. The case where 25 and 75 of the observed S(1) line emission arises from the warm and hot components respectively is obtained for gas temperatures of Twarm = 107 K (o/p ratio shifts to 1.65), and Thot = 465 K, and H2 column densities of N(H2,warm) = 5.8 cm-2, and N(H2,hot) = 3.4 cm-2. For this case, less than 1 of the observed S(2) (S(0) line) arise from the warm (hot) component. For all cases, the warm component completely dominates (more than ) the H2 column density.
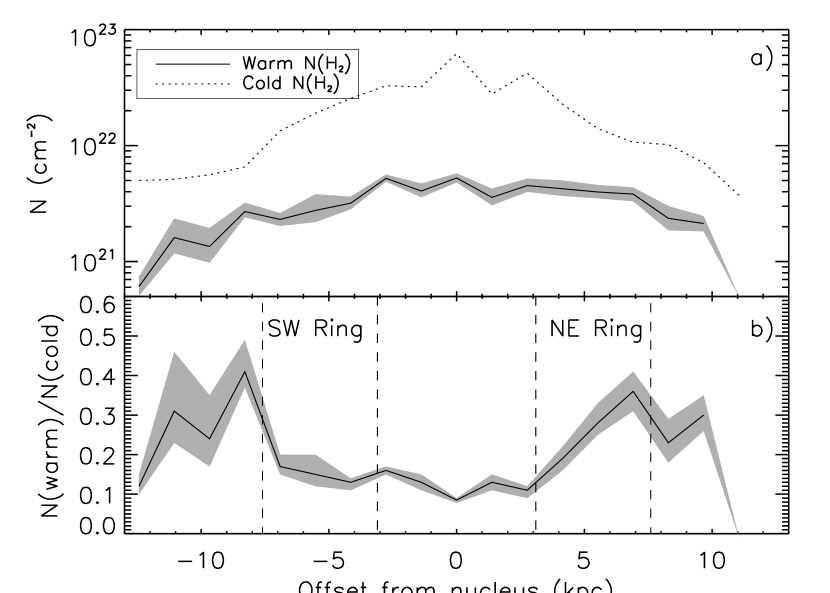
We use the minimum mass self consistent model (75/25 split of S(1) line flux into warm and hot components) to calculate the total column density in H2 line emitting molecular gas (esssentially the warm component from above) across the disk of NGC 891. The results, along with the column traced in CO(1-0) are plotted in Figure 7a. The warm molecular gas column peaks at the nucleus at a value of cm-2, and is above cm-2 out to 8 kpc from the nucleus. Figure 7b shows the ratio of the warm molecular gas to that traced in its CO(1-0) line emission (within the Spitzer beam), i.e. the fraction of the total molecular gas that is emitting in the H2 lines. This fraction is modest (13%) and nearly constant in the inner galaxy from 3 kpc NE of the nucleus to 6 kpc SE of the nucleus, but rises to 30% in the outer galaxy. This could be a true enhancement of the warm molecular gas mass in the outer galaxy, or it could be due to a change in the conversion factor, X between CO intensity and H2 column density with distance from the nucleus. If the X factor were larger by a factor of two in the outer galaxy compared with the inner galaxy, at first glance, this could explain our apparent change in the warm/cold molecular gas fraction. However, we do not believe this is the case, as there is a significant NE-SW asymmetry in the warm/cold molecular gas fraction apparent within the molecular ring (r = 3 to 7 kpc). Averaged over the ring positions, the NE portion of the ring has twice the warm molecular gas fraction ( 28%) as the SW portion of the ring (14%). The total molecular gas as traced by CO is very close to the same in both sides of the ring (Scoville et al., 1993): it is the warm molecular gas column that is enhanced (Figure 7, top). To cancel out this effect, one would need to invoke an X factor twice as large for the NE ring as for the SW ring. This enhanced warm molecular mass fraction is more likely the result of enhanced starformation in the NE ring, which is reflected in the stronger [CII] and [OI] line emission observed to the NE as well (see Figure 8). Integrated over the galaxy, the warm molecular gas totals M⊙, or about 16% of the total molecular gas mass as traced by CO ( M⊙) within our Spitzer beams (which extend 5.5′′ of the galactic plane).
4.3. Gas Heating
The power to heat large amounts of molecular gas to temperatures above a hundred degrees can be provided by far-UV (stellar) photons, by the dissipation of molecular gas turbulent kinetic energy in cloud-cloud collisions and on smaller scales within clouds, by X-ray photons, or by cosmic rays. For normal star-forming galaxies, only the first two may provide enough power to be important.
4.3.1 Photodissociation Regions – Motivation
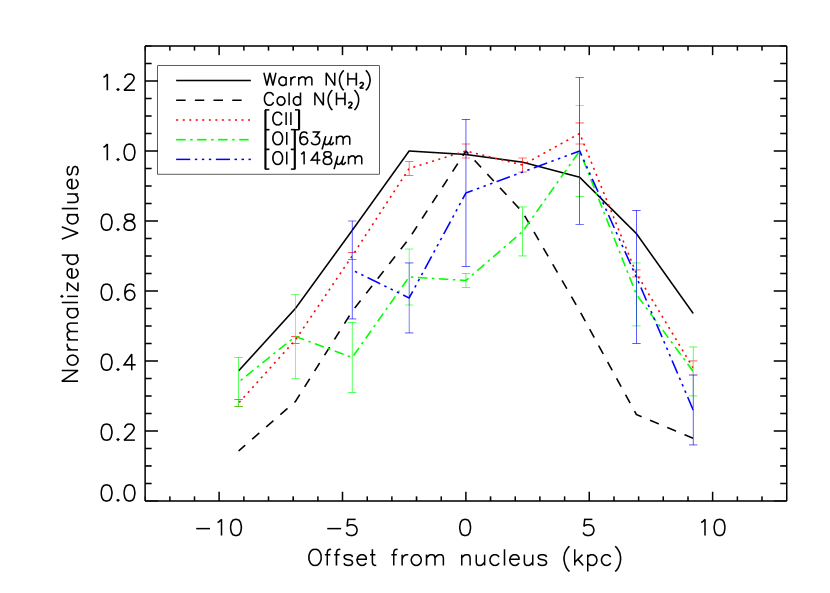
Figure 8 provides insights into the source for the heating of the molecular gas. In this figure we plot the “cold” molecular gas mass (traced in its CO emission) the “warm” molecular gas mass (traced in its H2 line emission), and the [CII] 158 m and the [OI] 63 fine-structure lines obtained with the ISO LWS spectrometer (Brauher, Dale and Helou, 2008). We also include weak detections of the [OI] 146 m at 6 positions along the galactic plane that we obtained through close inspection of the LWS L02 scans of the line obtained within the ISO data archive. These data were calibrated as described in Brauher, Dale and Helou (2008) so as to be consistent with their [CII] and [OI] 63 m fluxes, and their [NII] 122 fluxes which we use below. The cold and warm molecular gas distributions have been smoothed to the significantly coarser spatial resolution (75′′) of the ISO LWS beam for proper comparisons, and the tracers are normalized to their nuclear values (excepting the [OI] lines which are normalized to their peaks) for ease of comparision. The cold molecular gas mass is centered on the nucleus with a significantly narrow distribution along the galactic plane than the warm molecular gas mass. In addition, the warm molecular gas mass distribution is asymetrical, with near nuclear values extending to the molecular ring, 4.6 kpc to the NE of the nucleus.
The [CII] line predominantly arises from photodissociation regions formed on the surfaces of molecular clouds exposed to the far-UV (6 eV eV) radiation from nearby OB stars or the general interstellar radiation field. The [CII] line is also an important coolant for low density ionized gas, and “atomic clouds”, but most ( 70% Stacey et al., 1991; Abel et al., 2005; Oberst et al., 2006) of the [CII] flux from external galaxies likely arises from PDRs, so that the line is an indicator of OB star formation activity (Stacey et al., 1991). The very close correspondance between the [CII] distribution and that of the warm molecular gas is strongly suggestive of a PDR origin for the H2 line emission.
The ionization potential for O (13.62 eV) is essentially the same as that of H, so that the FIR [OI] 63 and 146 m line emission also arises from neutral gas within PDRs. The [OI] lines have significantly higher critical densities ( 4.7 105 and 9.4 104 cm-3 for the 63 and 146 m lines respectively) than that of the [CII] line ( 2.8 103 cm-3) so that the [OI] lines trace denser PDRs. The strong peaking of the [OI]63 m line line on the northern molecular ring is strongly suggestive of enhanced gas densities in this region.
The remarkable spatial correlation between the warm H2 mass and the [CII] line including the extension to the NE suggests a common origin in PDRs. Indeed, warm molecular gas is expected within PDRs. The penetration of carbon ionizing photons into neutral gas clouds is limited by the extinction of these photons by dust to visual extinctions, A mag (corresponding to an N cm-2), and along half this column, hydrogen is typically molecular in form (Tielens & Hollenbach, 1985).
4.3.2 Photodissociation Regions: Constraints on G0
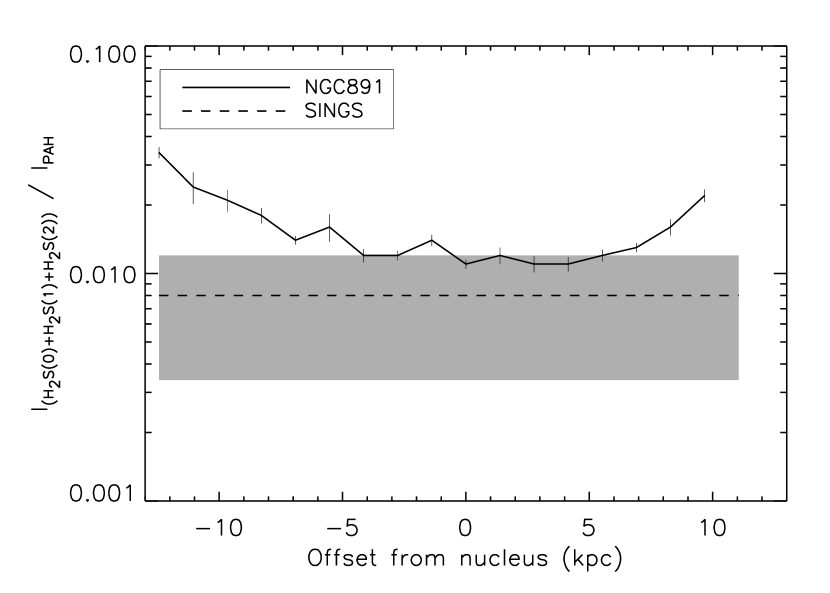
We have argued for a PDR orgin for much of the H2 line emission. As such, one might expect a correlation between the observed H2 line emission and that of an independent tracer of PDRs, the PAH 7.7 m emission feature (e.g. Habart et al. (2004),Peeters, Spoon, & Tielens (2004). In Figure 9, we compare the PAH 7.7m emission with the H2 line emission, by plotting the H2-to-PAH emission ratio along the plane of NGC 891. The PAH emission is measured from IRAC 8 m imaging data (Whaley et al., 2009) using the same apertures than those used for the H2 spectroscopy. To compute the PAH emission from the 8 m flux, we use the same effective bandwith ( ) as Roussel et al. (2007). The H2 line emission is the sum of the S(0), S(1) and S(2) lines. All tracers were corrected for extinction (see section 3.3). The extinction at 7.7 m is similar to that at 12.3 and 17 m (Draine, 2003), so that the H2 to PAH emission ratio is not very sensitive to the specific choice of the extinction curve. Rigopoulou et al. (2002) and Roussel et al. (2007) have shown that the H2 emission of star forming galaxies is tightly correlated with the PAH emission. Figure 9 extends this correlation to the distribution of both tracers within a galaxy. The H2 to PAH emission ratio is remarkably constant within the NGC 891 disk, with a mean value only slightly larger than that measured for the SINGS galaxies.
A striking outcome of the SINGS data analysis is that the H2/PAH emission ratio is independent of the dust heating as measured by the m to FIR dust emission ratio. Roussel et al. (2007) argue that this result is easiest to understand if the H2 and dust emission come both from PDRs, and are powered by a common energy source, the UV light from young stars. However, from their discussion it is not fully clear how this interpretation fits with the modeling of the dust spectral energy distribution in Draine et al. (2007), where the PAH emission comes mainly from interstellar matter in a low UV radiation field (typically G ). Here, we quantify the constraint set by the H2/PAH emission ratio on the UV field. Using the Draine & Li (2007) models available on line, we computed that the PAH emission, as it appears in Figure 9, is
| (3) |
where the dus-to-gas mass ratio is assumed to be Galactic and qPAH is the fraction of the dust mass in PAHs (Draine & Li, 2007). The default value of qPAH corresponds to the median value derived by (Draine et al., 2007) for metallic galaxies in the SINGS sample. The model output may be combined with the observed value of H2/PAH ( 0.012), to estimate the effective radiation field, G, within the warm H2 gas. For NGC 891, we find L(H2)/M(H2,warm) 1/20, so that putting this all together we have:
| (4) |
Here we have left in an explicit scaling factor for the warm molecular gas mass. Clearly, this calculation only provides a rough upper limit for G, since it assumes that the PAH emission arises exclusively from PDRs containing the warm H2 gas, while some PAH emission is expected from the H I and cold H2 gas. However, within the current understanding of PAH emission, the H2 to PAH comparison therefore suggests that the bulk of the warm H2 mass (the S(0) emitting gas) is located in PDRs exposed to modest far-UV radiation fields. We use this as a constraint in our PDR models that we develop below. It is important to note that this constraint on G only applies for the gas that radiates in the S(0) and S(1) lines, not the gas radiating in the S(2) line. The S(2) line emission could arise from a much higher G environment without increasing the PAH flux very much since the mass of this component will be so small.
4.3.3 Photodissociation Regions: Modeling
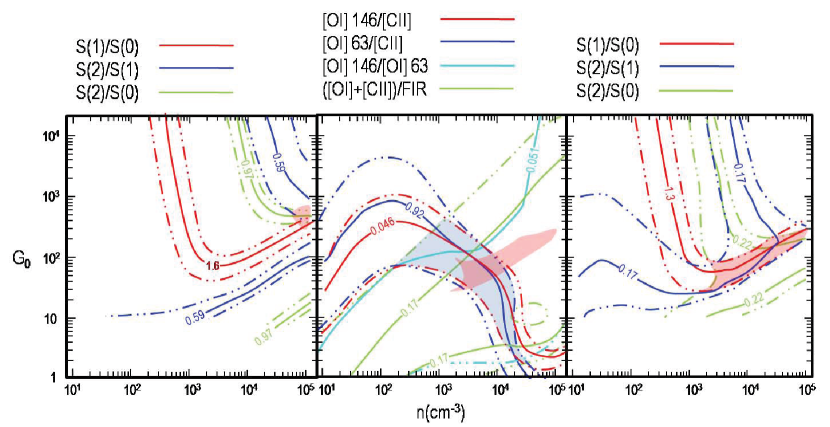
Kaufman et al. (2006) have made available a grid of PDR model outputs, which include the expected rotational line emission from H2 as a function of G, the strength of the local far-UV (6 eV) radiation field normalized to the Habing field (G erg s-1 cm-2), and the cloud number density n. The model computes the local heating and cooling, chemistry and radiative transfer as a function of depth from the cloud surface into its dust-shielded core. Diagnostic line ratios and line intensities appropriate for a single face-on slab geometry are posted on-line, and available interactively in the “Photodissociation Region Toolbox (PDRT)444See dedicated web site at http://dustem.astro.umd.edu”. Table 2 lists our observed H2 S(0), S(1) and S(2) luminosities and those of the [CII], and [OI] lines integrated over the galaxy. We estimate that the errors for the H2 luminosities are roughly given by their corrections for extinction, and high latitude flux missed by the Spitzer beam. Figure 10 (left) plots our observed galactic average H2 line ratios as a function of G and n from PDRT. The model results do not give a good fit to the NGC 891 line ratios. The best fit is for high density (n cm-3) and moderate far-UV radiation fields (G 200 to 400).
Figure 10 (center) plots the [OI], [CII] and ([OI] 63 m + [CII])/FIR continuum ratios as averaged over the galaxy onto a PDR diagnostic diagram from PDRT. For this FIR data set we make corrections to the observed luminosities of our tracers. The first correction is for optical depth and geometry. The PDRT models are appropriate for face-on single slab geometry. Since the ISO beams encompass regions 2.5 kpc in size at the distance to NGC 891, there is an ensemble of clouds within our beam. For a spherical cloud, the projected surface area is only 1/4 the total surface area, so that a beam filled with spherical clouds will have 4 times the intensity as a unit filling factor single slab if the lines are optically thin. If all the tracers are optically thin, taking the line ratios eliminates this geometric factor. Although it is almost certainly true that all the H2 lines are optically thin, optical depth may be an issue for the FIR lines. In fact, the 63 m [OI] is most likely optically thick (Stacey et al., 1983; Tielens & Hollenbach, 1985) in star formation regions, so that the observed [OI] line intensity should be corrected for geometry, multiplying by as much as a factor of four for high optical depth in the line in spherical geometry. For our study, we make a more modest correction, multiplying the 63 m line by a factor of two. We take the [OI] error boundary to be 50 due to this factor of two correction, and note that this error bound will encompass geometry effects up to a factor of 3. The [CII] and [OI] 146 m lines are likely optically thin, or thinish as is the FIR continuum, so we make no optical depth correction to their fluxes.
Next, we correct the observed [CII] line emission for that fraction expected to arise from diffuse ionized gas. This correction is perhaps best done by comparing the observed [CII] line flux to that of the ground state fine structure lines of N+ at 205 and 122 m. With an ionization potential of 14.5 eV, these lines only arise from within ionized gas regions, and one can show that the [CII]/[NII] line ratios are a measure of the observed fraction of the [CII] line that arises from the ionized interstellar medium (cf. Petuchowski & Bennett, 1993; Heiles, 1994; Oberst et al., 2006). We use the [NII] 122 m lines observed by the ISO LWS (Brauher, Dale and Helou, 2008), averaged over the plane of the galaxy. The [NII] 122m line to [CII] line ratio in NGC 891 is 1:9: somewhat smaller than that of the Milky Way Galaxy (1:6, Wright et al., 1991). Assuming Galactic C/N abundance ratios the line ratio indicates that between 50% (low density limit) and 4% (high density limit) of the observed [CII] comes from ionized gas regions (Oberst et al., 2006). Here we will assume 27% of the [CII] line arises from HII regions as found for the low density (ne 30 cm-3) gas in the Carina nebula(Oberst et al., 2006). We take the error bound for the [CII] luminosity to be equal to the fraction (27) we have subtracted off.
Finally, not all of the FIR continuum luminosity from galaxies will arise from dense PDRs. A significant fraction can arise from the diffuse ISM. Alton et al. (1998) and Popescu et al. (2004) have fit “warm” (PDR) and “cool” (diffuse) fractions of the total FIR luminosity from NGC 891. The warm dust likely arises from H II regions and PDRs, while the cool dust arises from the cold interiors of molecular clouds and the diffuse ISM (Draine et al., 2007). We therefore take 50 of the total FIR luminosity of NGC 891 to arise from PDRs. Finally, we correct LFIR to L30-1000μm which is appropriate for the PDRT models (see footnote to Table 2). Considering these corrections, we take the error bound for the FIR luminosity to be 50. Putting the FIR line and continum corrections together, the PDR cooling line/cooling continuum ratio integrated over NGC 891 is ([OI] + [CII])/FIR 1.7% (Table 2).
Let us now examine the overall properties of NGC 891, integrated along the galactic plane. Taken within themselves, the S(2)/S(0) and S(1)/S(0) line ratios (1.08 and 1.69 respectively) indicate G 200-400, and n 6 104 cm-3. However, the [OI] 146m/[CII], [OI] 63m/[CII] and ([OI]+[CII])/FIR ratios indicate lower far-UV fields with best fit near G100, and a significantly lower density with best fit near n 3 (Figure 9, center). The solution spaces for the H2 and FIR line models do not overlap. The closest approach for the two models is obtained for similar Gs ( 100 to 200), but the FIR lines require a lower gas density (n 104 to 4 cm-3, as G ranges from 100 to 200) than the H2 lines (n cm-3). If we imagine the PDRs to be the surfaces of externally illuminated molecular clouds, then since the H2 lines arise from deeper within the PDR than the FIR lines, it is likely they will arise from denser gas regions, so perhaps this is an acceptable solution. If so, then the beam filling factors of the two components should match as well. For the FIR component, the average [CII] line intensity (less 27% for ionized gas) referred to an 11′′ region along the plane of the galaxy is erg s-1 cm-2 sr-1. At the closest approach solution between the H2 and FIR models (n cm-3 and G200), the [CII] intensity predicted by PDRT is erg s-1 cm-2 sr-1 so that the beam filling factor for the FIR lines is 1.3. For n, G200, PDRT predicts a S(0) line intensity erg s-1 cm-2 sr-1. The extinction corrected value within our 11′′ beam averaged over the plane of the galaxy is erg s-1 cm-2 sr-1, so that the beam filling factor is 1.7, in fair agreement with the FIR value.
4.3.4 Is some of the H2 emission powered by the dissipation of turbulence?
The H2 lines, the FIR lines, and the FIR continuum are consistent with PDR models but only if there is a rather large (factor of 10) density gradient between the (denser) H2 emitting region and the (less dense) FIR line emitting regions. In addition, the requisite far-UV field strength is significantly larger than the value we derive using the observed PAH distribution in section 4.3.2 above. These difficulties motivate us to investigate the possibility that a fraction of the observed H2 line emission arises from the dissipation of turbulence in molecular clouds. This possibility has been proposed to account for diffuse H2 line emission in the Milky Way (Falgarone et al., 2005) and the galaxy-wide shock in Stephan’s Quintet (Guillard et al., 2009).
The S(1)/S(0) line ratio is fully consistent with the far-UV fields and densities as derived from the FIR lines and continuum (see Figure 10, left). What drives the H2 solution is the S(2) line, which is a factor of six too bright. The C-shock models of Draine et al. (1983) and, more recently Flower & Pineau-Des-Forets (2010) are in good agreement, and indicate that the S(2) line is brighter than the S(1) line for vshock 15 km s-1. For example, using the Flower & Pineau-Des-Forets (2010) model, for shock velocities, v20 to 30 km s-1, with preshock density nH = n(H)+2n(H2)= 2104 cm-3, the S(2) line is 1.6 as bright as the S(1) line, and 75 times brighter than the S(0) line. If 80% of the observed S(2) line flux were to arise from such C-shocks, and the remainder from PDRs, then 30% of the S(1) line would also arise from shocks, and the PDR line ratios would shift to S(2)/S(1) 0.17, and S(2)/S(0) 0.22. The allowed values for G and n for this PDR plus shocks solution are shaded blue in Figure 10 (right). Clearly there is now a large region of overlap between the PDR solution for the FIR lines, and that for the H2 lines. This solution space is centered at about G60 40, n 5 +5/-3 cm-3 (Figure 10, center). The revised filling factors are reasonably self-consistent with 1.9, and 2.8. With v 25 km s-1, there is significant cooling in other molecular hydrogen lines: the S(3) and S(4) lines are predicted to be 47 and 4 times brighter respectively than the S(2) line. The total luminosity in the molecular hydrogen lines from the shocked gas would be very large: L L⊙. For a 25 km s-1 C-shock, the common cooling lines of [OI] and CO are more than 100 and 15 times less important energetically than those of H2 , and H2O is predicted to have a total cooling that of H2 (Flower & Pineau-Des-Forets, 2010). A similar analyis of the region centered on the north-east ring has a solution centered on modestly enhanced excitation, G80, n cm-3, and requires somewhat higher area filling factors 2.7, and 3.6 to account for the enhanced [OI] 63 m line emission there.
Leaving aside the question of the H2 excitation, we can assess the contribution of mechanical energy dissipation to the H2 emission, from the point of view of energetics. Is the dissipation rate of the interstellar medium turbulent kinetic large enough to provide a significant contribution to the H2 emission? Various groups have discussed the dissipation of turbulence using numerical magneto-hydrodynamic simulations (Stone et al., 1998; Mac Low, 1999, e.g.). As in Bradford et al. (2003), one can rearrange equation (7) from Mac Low (1999) to parameterize the energy released by the dissipation of turbulence per unit mass in terms of the dispersion of the turbulent velocity, vrms, and the scale length of energy injection, :
| (5) |
The default values for vrms and correspond to the upper end of the line width-size relation for giant molecular clouds in the Galaxy (Solomon et al., 1987). We invoke shocks to account for 80% of the S(2) luminosity, and 25% of the S(1) line luminosity. By dividing the sum of these line luminosiites , by the molecular mass , derived from the CO(1-0) luminosity, we obtain . Therefore, the expected turbulent dissipation rate is greater than the luminosites of the lines, so that a significant contribution from turbulent energy dissipation is likely.
In summary, the observed H2 line emission from NGC 891 is well fit by a model that combines a low excitation PDR (G 60, n5 103 cm-3) with dissipation of turbulent energy within molecular clouds. The (adjusted) [OI] (63 and 146 m) and [CII] 158 m fine structure line fluxes, (half) of the observed FIR continuum flux, the H2 S(0) line flux and 70 of the S(1) line flux arise from the PDR component, while the H2 S(2) line and 30 of the S(1) line flux arise from gas heated by turbulent dissipation. It is interesting to note that based on observations of the H2 lines along a line of sight within the Milky Way galaxy, Falgarone et al. (2005) reached much the same conclusion: the S(0) line emission may be accounted for by UV heated H2 in the diffuse interstellar medium and low excitation PDRs, but the UV emission cannot be the unique energy source, because their PDR models fall short of the observed S(1) and S(2) lines by large factors (2-10). As we outline here, they propose that the S(1) and S(2) H2 line emission is powered by the localized dissipation of turbulent kinetic energy, albeit in a low density gas (n) within the diffuse interstellar medium. The presence of a diffuse component of H2 line emission has been confirmed by additional Galactic observations (Hewitt et al., 2009; Goldsmith et al., 2010).
It should be clear that the solutions presented here are by no means unique. On galactic scales there will certainly be a range of PDRs along the line of sight with varying degrees of excitation, that could mimic the observed line ratios, perhaps negating the need to invoke shocks. Furthermore, a single parameter shock model is also simplistic: there will very likely be a superposition of shocks of various parameters only any given line of sight. What we present here is intended to be only a representative solution.
5. Conclusions
We have mapped the distribution of the S(0), S(1), and S(2) pure rotational lines of H2 along the plane of the edge-on galaxy NGC 891. The lines are remarkably bright. After making an extinction correction, the total line flux from the three transitions is L⊙ or 0.09% of the TIR luminosity of the galaxy. Unlike the ISO results that suggest a change in the S(1)/S(0) line intensity ratio in the outer regions of the galaxy, we find the line ratios are nearly constant along the plane of the galaxy indicating uniform excitation of the gas. In particular, there is no reason to invoke a massive cold component of the molecular gas in the outer galaxy as the ISO results appear to require. Through analytical modeling, we find the bulk of the mass traced in its H2 line emission has an excitation temperature near 125 K. This “warm” molecular component is a substantial fraction of the total molecular gas mass: about 10 to 15% in the inner (3 kpc NE r 6 kpc SW) galaxy rising to more than 30% in the outer regions. Integrated over the galaxy, M 16% M.
We compare our H2 observations with detailed PDR models to show that the observed line intensities and ratios are consistent with high density (n cm-3) molecular clouds exposed to moderate far-UV fields (G200-400). We refine our PDR modeling by using available ISO [OI] and [CII] data, which indicate smaller far-UV fields (G5-300), and lower gas densities (n cm-3). The solutions spaces for the H2 and FIR line PDRs do not overlap, but a reasonably close solution is obtained for G 200, and a large (factor of ten) density gradient between the FIR emitting gas and the H2 emitting gas. This solution may be possible if the clouds are externally illuminated, but the high field invoked by this solution is in contradiction to the more modest far-UV fields (G) one would expect by comparing the observed H2 line luminosity to that of the 7.7 m PAH features. A consistent solution is obtained within a two component model. The first component is a low excitation PDR, with G 60, and the second component is heated by the dissipation of turbulent kinetic energy. We find a very good fit for the H2 and FIR lines and continuum if all the observed S(0) line emission arises from the PDR component, and 80 of the S(2) line arises from the turbulent component. The S(1) line emission is split 70% into the PDR component, and 30% into the turbulent component. This solution is only representative of a range of solutions that could be obtained by allowing more PDR and/or shock components with different excitation parameters.
This is the first analysis of the H2 rotational line emission from a galaxy together with the FIR lines and continuum in the context of PDR models. A complication with this modeling is the relatively large beams and modest sensitivies of the ISO spectrometers for detection of the FIR lines. These issues will become much less important in the near future with the arrival of FIR data from the 3 m class Stratospheric Observatory for Infrared Astronomy (SOFIA) and the Herschel Space Telescope spectrometers and photometers.
References
- Abel et al. (2005) Abel, N. P., Ferland, G. J., Shaw, G., & van Hoof, P. A. M. 2005, ApJS, 161, 65
- Alton et al. (1998) Alton, P. B., Bianchi, S., Rand, R. J., Xilouris, E. M., Davies, J. I., & Trewhella, M. 1998, ApJ, 507, L125
- Alton et al. (2000) Alton, P. B., Xilouris, E. M., Bianchi, S., Davies, J., & Kylafis, N. 2000, A&A, 356, 795
- Appleton et al. (2006) Appleton, P. N., et al. 2006, ApJ, 639, L51
- Armus et al. (2004) Armus, L., et al. 2004, ApJS, 154, 178
- Bell et al. (2006) Bell, T. A., Roueff, E., Viti, S., & Williams, D. A. 2006, MNRAS, 371, 1865
- Bernard-Salas et al. (2009) Bernard-Salas, J., et al. 2009, ApJS, 184, 230
- Bitner et al. (2007) Bitner, M. A., Richter, M. J., Lacy, J. H., Greathouse, T. K., Jaffe, D. T., & Blake, G. A. 2007, ApJ, 661, L69
- Bradford et al. (2003) Bradford, C. M., Nikola, T., Stacey, G. J., Bolatto, A. D., Jackson, J. M., Savage, M. L., Davidson, J. A., & Higdon, S. J. 2003, ApJ, 586, 891
- Brauher, Dale and Helou (2008) Brauher, J. R., Dale, D. A., & Helou, G. 2008, ApJS, 178, 280
- Burton et al. (1992) Burton, M. G., Hollenbach, D. J., & Tielens, A. G. G. 1992, ApJ, 399, 563
- Dame et al. (2004) Dame T.M., Hartmann, D., Thaddeus, P., 2001, ApJ, 547, 792
- Dale & Helou (2002) Dale, D.A., & Helou, G. 2002, ApJ, 576, 159
- Devost et al. (2004) Devost, D., et al. 2004, ApJS, 154, 242
- Draine et al. (1983) Draine, B. T., Roberge, W. G., & Dalgarno, A. 1983, ApJ, 264, 485
- Draine (2003) Draine, B. T. 2003, ARA&A, 41, 241
- Draine & Li (2007) Draine, B. T., & Li, Aigen 2007, ApJ, 657, 810
- Draine et al. (2007) Draine, B. T., et al. 2007, ApJ, 663, 866
- Falgarone et al. (2005) Falgarone, E., Verstraete, L., Pineau Des Forêts, G., & Hily-Blant, P. 2005, A&A, 433, 997
- Flower & Pineau-Des-Forets (2010) Flower, D. R., & Pineau-Des-Forets, G. 2010, MNRAS, in press
- Garcia-Burillo et al. (1992) Garcia-Burillo, S., Guelin, M., Cernicharo, J., & Dahlem, M. 1992, A&A, 266, 21
- Goldsmith et al. (2010) Goldsmith, P.F, Velusamy, T., Li, D., & Langer, W.D. 2010, ApJ, 715, 1370
- Guelin et al. (1993) Guelin, M., Zylka, R., Mezger, P. G., Haslam, C. G. T., Kreysa, E., Lemke, R., & Sievers, A. W. 1993, A&A, 279, L37
- Guillard et al. (2009) Guillard, P., Boulanger, F., Pineau Des Forêts, G., & Appleton, P. N. 2009, A&A, 502, 515
- Habart et al. (2004) Habart, E., Boulanger F., Verstraete, L., Walmsley, C.M., & Pineau des Forets, G. 2004, A&A, 414, 531
- Habart et al. (2010) Habart, E., Abergel, A., Boulanger F. et al. 2010, A&A, (in press)
- Heiles (1994) Heiles, C. 1994, ApJ, 436, 720
- Hewitt et al. (2009) Hewitt, J. W., Rho, J., Andersen, M., & Reach, W. T. 2009, ApJ, 694, 1266
- Higdon et al. (2004) Higdon, S. J. U., et al. 2004, PASP, 116, 975
- Higdon et al. (2006a) Higdon, S. J. U., Higdon, J. L., & Marshall, J. 2006a, ApJ, 640, 768
- Higdon et al. (2006b) Higdon, S. J. U., Armus, L., Higdon, J. L., Soifer, B. T., & Spoon, H. W. W. 2006b, ApJ, 648, 323
- Houck et al. (2004) Houck, J. R., et al. 2004a, ApJS, 154, 18
- Israel et al. (1999) Israel, F. P., van der Werf, P. P., & Tilanus, R. P. J. 1999, A&A, 344, L83
- Kaufman et al. (2006) Kaufman, M. J., Wolfire, M. G., & Hollenbach, D. J. 2006, ApJ, 644, 283
- Le Bourlot et al. (1999) Le Bourlot, J., Pineau des Forêts, G., & Flower, D. R. 1999, MNRAS, 305, 802
- Mac Low (1999) Mac Low, M.-M. 1999, ApJ, 524, 169
- Oberst et al. (2006) Oberst, T. E., et al. 2006, ApJ, 652, L125
- Oosterloo et al. (2007) Oosterloo, T., Fraternali, F., & Sancisi, R. 2007, AJ, 134, 1019
- Parmar et al. (1991) Parmar, P. S., Lacy, J. H., & Achtermann, J. M. 1991, ApJ, 372, L25
- Peeters, Spoon, & Tielens (2004) Peeters, E., Spoon, H. W. W., & Tielens, A. G. G. M 1004, ApJ, 613, 986
- Petuchowski & Bennett (1993) Petuchowski, S. J., & Bennett, C. L. 1993, ApJ, 405, 591
- Pfenniger & Combes (1994) Pfenniger, D., & Combes, F. 1994, A&A, 285, 94
- Popescu & Tuffs (2003) Popescu, C. C., & Tuffs, R. J. 2003, A&A, 410, L21
- Popescu et al. (2004) Popescu, C. C., Tuffs, R. J., Kylafis, N. D., & Madore, B. F. 2004, A&A, 414, 45
- Rand et al. (2008) Rand, R. J., Wood, K., & Benjamin, R. A. 2008, ApJ, 680, 263
- Richter et al. (1995) Richter, M. J., Graham, J. R., Wright, G. S., Kelly, D. M., & Lacy, J. H. 1995, ApJ, 449, L83
- Rigopoulou et al. (2002) Rigopoulou, D., Kunze, D., Lutz, D., Genzel, R., & Moorwood, A. F. M. 2002, A&A, 389, 374
- Roussel et al. (2007) Roussel, H., et al. 2007, ApJ, 669, 959
- Rupen (1991) Rupen, M. P. 1991, AJ, 102, 48
- Sanders et al. (2003) Sanders, D. B., Mazzarella, J. M., Kim, D.-C., Surace, J. A., & Soifer, B. T. 2003, AJ, 126, 1607
- Scoville et al. (1993) Scoville, N. Z., Thakkar, D., Carlstrom, J. E., & Sargent, A. I. 1993, ApJ, 404, L59
- Smith et al. (2004) Smith, J. D. T., et al. 2004, ApJS, 154, 199
- Sodroski et al. (1994) Sodroski, T. J., et al. 1994, ApJ, 428, 638
- Solomon et al. (1987) Solomon, P. M., Rivolo, A. R., Barrett, J., & Yahil, A. 1987, ApJ, 319, 730
- Stacey et al. (1983) Stacey, G. J., Smyers, S. D., Kurtz, N. T., & Harwit, M. 1983, ApJ, 268, L99
- Stacey et al. (1991) Stacey, G. J., Geis, N., Genzel, R., Lugten, J. B., Poglitsch, A., Sternberg, A., & Townes, C. H. 1991, ApJ, 373, 423
- Sternberg & Neufeld (1999) Sternberg, A., & Neufeld, D. A. 1999, ApJ, 516, 371
- Stone et al. (1998) Stone, J. M., Ostriker, E. C., & Gammie, C. F. 1998, ApJ, 508, L99
- Tielens & Hollenbach (1985) Tielens, A. G. G. M., & Hollenbach, D. 1985, ApJ, 291, 747
- Valentijn et al. (1996) Valentijn, E. A., van der Werf, P. P., de Graauw, T., & de Jong, T. 1996, A&A, 315, L145
- Valentijn & van der Werf (1999) Valentijn, E. A., & van der Werf, P. P. 1999, ApJ, 522, L29
- van der Kruit & Searle (1981) van der Kruit, P. C., & Searle, L. 1981, A&A, 95, 116
- Whaley et al. (2009) Whaley, C. H., Irwin, J. A., Madden, S. C., Galliano, F., & Bendo, G. J. 2009, MNRAS, 395, 97
- Wolniewicz et al. (1998) Wolniewicz, L., Simbotin, I., & Dalgarno, A. 1998, ApJS, 115, 293
- Wright et al. (1991) Wright, E. L., et al. 1991, ApJ, 381, 200
| ID | RA | Dec | DistanceaaOffset of each pointing along the disk of NGC 891, from the pointing on the nucleus (position ID=1) | S(2) 12.3m | S(1) 17.0m | S(0) 28.2m |
|---|---|---|---|---|---|---|
| J2000 | J2000 | arcmin | (W m | (W m | (W m | |
| 26 | 2:22:44.10 | +42:26:2.450 | 5.65 | 1.40 | 1.24 | 1.44 |
| 25 | 2:22:43.35 | +42:25:33.85 | 5.53 | 1.47 | 1.39 | 2.10 |
| 24 | 2:22:42.37 | +42:25:06.67 | 4.97 | 1.74 | 1.37 | 0.770.26 |
| 23 | 2:22:41.44 | +42:24:40.09 | 4.42 | 1.67 | 1.58 | 2.410.63 |
| 22 | 2:22:40.78 | +42:24:07.65 | 3.87 | 0.670.11 | 1.450.11 | 5.080.62 |
| 21 | 2:22:39.83 | +42:23:39.90 | 3.32 | 1.89 | 1.770.30 | 5.770.85 |
| 20 | 2:22:38.38 | +42:23:13.93 | 2.76 | 1.090.09 | 2.490.16 | 8.841.07 |
| 19 | 2:22:37.59 | +42:22:46.22 | 2.21 | 4.110.45 | 4.100.48 | 10.910.68 |
| 18 | 2:22:36.47 | +42:22:18.77 | 1.66 | 2.150.20 | 4.130.68 | 11.370.45 |
| 17 | 2:22:35.47 | +42:21:50.29 | 1.11 | 2.790.63 | 3.820.50 | 11.070.48 |
| 16 | 2:22:34.67 | +42:21:21.43 | 0.55 | 2.140.59 | 3.880.57 | 10.440.80 |
| 1 | 2:22:33.41 | +42:20:56.88 | 0.00 | 3.430.19 | 6.860.57 | 14.640.58 |
| 2 | 2:22:32.37 | +42:20:25.85 | -0.55 | 1.58 | 4.350.59 | 11.660.54 |
| 3 | 2:22:31.02 | +42:19:59.96 | -1.11 | 3.230.61 | 5.150.30 | 13.650.51 |
| 4 | 2:22:30.16 | +42:19:31.63 | -1.66 | 1.900.50 | 3.800.40 | 9.290.59 |
| 5 | 2:22:29.15 | +42:19:03.34 | -2.21 | 1.820.55 | 2.510.75 | 7.390.44 |
| 6 | 2:22:28.07 | +42:18:35.81 | -2.76 | 1.280.11 | 2.810.21 | 6.820.68 |
| 7 | 2:22:26.99 | +42:18:08.74 | -3.32 | 2.70 | 2.610.44 | 7.200.34 |
| 8 | 2:22:25.98 | +42:17:41.93 | -3.87 | 2.19 | 0.920.24 | 3.450.64 |
| 9 | 2:22:24.88 | +42:17:14.69 | -4.42 | 2.40 | 1.580.50 | 4.240.53 |
| 10 | 2:22:23.74 | +42:16:46.54 | -4.97 | 1.41 | 0.560.08 | 1.860.21 |
| 11 | 2:22:22.70 | +42:16:19.70 | -5.53 | 1.64 | 1.05 | 2.24 |
| 12 | 2:22:21.65 | +42:15:52.55 | -6.08 | 1.44 | 1.07 | 1.66 |
| Line | Luminosity | Corrected LuminosityaaH2 correction factor from extinction (1.16, 1.32, and 1.32 for the S(0), S(1) and S(2) lines respectively), and high latitude emission missed by our beam (1.16 correction factor). The [OI] 63 m corrected by factor of 2 for geometry and [CII] line is corrected by 0.7 for HII region contribution. The FIR (42.5 to 122.5 m) luminosity is divided by two to account for cirrus emission, then multiplied by 1.5 for flux longward of 122.5 m as required by the PDRT models. The factor of 1.5 is appropriate for galaxies in the Revised Bright Galaxy Survey (Sanders et al., 2003) | Error |
|---|---|---|---|
| (L⊙) | (L⊙) | ||
| H2 S(0) | 5.44 | 7.18 | 24% |
| H2 S(1) | 8.94 | 1.32 | 24% |
| H2 S(2) | 5.26 | 7.80 | 32% |
| [OI] 63 m | 4.67 | 9.34 | 50% |
| [OI] 146 m | 4.74 | 4.74 | 50% |
| [CII] 158 m | 1.40 | 1.02 | 37% |
| LFIR | 1.51 | 1.13 | 30% |
.


- 1.