Multidimensional chemical modeling of young stellar objects.
III. The influence of geometry on
the abundance and excitation of diatomic hydrides
Abstract
The Herschel Space Observatory opens the sky for observations in the far infrared at high spectral and spatial resolution. A particular class of molecules will be directly observable; light diatomic hydrides and their ions (CH, OH, SH, NH, CH+, OH+, SH+, NH+). These simple constituents are important both for the chemical evolution of the region and as tracers of high-energy radiation. If outflows of a forming star erode cavities in the envelope, protostellar far UV (FUV; eV) radiation may escape through such low-density regions. Depending on the shape of the cavity, the FUV radiation then irradiates the quiescent envelope in the walls along the outflow. The chemical composition in these outflow walls is altered by photoreactions and heating via FUV photons in a manner similar to photo dominated regions (PDRs).
In this work, we study the effect of cavity shapes, outflow density, and of a disk with the two-dimensional chemical model of a high-mass young stellar object introduced in the second paper in this series. The model has been extended with a self-consistent calculation of the dust temperature and a multi-zone escape probability method for the calculation of the molecular excitation and the prediction of line fluxes.
We find that the shape of the cavity is particularly important in the innermost part of the envelope, where the dust temperatures are high enough ( K) for water ice to evaporate. If the cavity shape allows FUV radiation to penetrate this hot-core region, the abundance of FUV destroyed species (e.g. water) is decreased. On larger scales, the shape of the cavity is less important for the chemistry in the outflow wall. In particular, diatomic hydrides and their ions CH+, OH+ and NH+ are enhanced by many orders of magnitude in the outflow walls due to the combination of high gas temperatures and rapid photodissociation of more saturated species. The enhancement of these diatomic hydrides is sufficient for a detection using the HIFI and PACS instruments onboard Herschel. The effect of X-ray ionization on the chemistry is found to be small, due to the much larger luminosity in FUV bands compared to X-rays.
Subject headings:
stars: formation – stars: individual: AFGL 2591 – molecular processes – ISM: molecules – X-rays: ISM1. Introduction
Observations of young stellar objects (YSOs) envelopes reveal a rich variety of morphologies (e.g. Arce & Sargent 2006, Jørgensen et al. 2007). Many of the observed features are associated with outflows: For example, strong high- CO emission along a cavity, etched out by the outflow, is found in the class I object HH 46 (van Kempen et al. 2009b). They explain the CO narrow emission with a warm and FUV heated region, with FUV photons from either the bow shock, internal jet working surfaces or the accretion disk boundary layer. In this scenario, FUV radiation may travel freely in the low-density cavity without being absorbed or scattered. Similarly, Bruderer et al. (2009a) have observed molecular tracers for warm, dense and FUV irradiated gas along the outflow of the high-mass young stellar object AFGL 2591. Since the line shape does not show clear signs of shocks, they suggest the FUV radiation to be of protostellar origin. Indeed, the hot photosphere of a luminous young O or B star emits mostly at FUV wavelengths and a cavity that allows protostellar radiation to escape has also been observed in that source (Preibisch et al. 2003).
This scenario of irradiated outflow walls along a cavity, swept out by an outflow, has also been used to explain other observations. For example, Jørgensen (2004) found emission of FUV enhanced CN along an outflow of a low-mass class 0 source. Van Kempen et al. (2009c) explain the water maser emission at 183 GHz in Ser SMM 1 with the increased water abundance in the warm, FUV or shock heated outflow walls. Outflow walls can also be sites of anomalous molecular excitation. For example Hogerheijde et al. (1998, 1999) observe strong emission of HCN and HCO+ along the outflow of L 1527 and Ser SMM 1. These molecules have a large dipole moment and are efficiently excited by collisions with electrons, mixed from the ionized outflow into the outflow wall. Rawlings et al. (2004) explain the strong HCO+ emission by shock liberation of molecules from ice mantles followed by photoprocessing. Spaans et al. (1995) model the strong 13CO emission in narrow lines observed toward several low-mass sources (e.g. TMR-1) by FUV heated outflow walls. Bruderer et al. (2009b) (second paper of this series, hereafter paper II) explain the observed high abundance of the FUV enhanced molecule CO+ in AFGL 2591 by a concave cavity that allows direct irradiation onto the outflow walls.
Diatomic hydrides and their ions (XH, XH+) are corner-stones of the chemical network. For example water at high temperature ( K) is mainly formed by the reaction of OH + H2. Due to their chemical properties, discussed in this work, they trace dense, warm and FUV or X-ray irradiated gas like in outflow walls. Such tracers are valuable to constrain the FUV or X-ray radiation of embedded sources. This is of particular interest for the innermost part of low-mass YSOs with protoplanetary disks being ionized and heated by FUV radiation and X-rays (e.g. Bergin 2009). Here, we discuss the use of light diatomic hydrides with the common elements (X=O, C, N, S) as tracers of protstellar high-energy radiation. The chemistry of other diatomic hydrides with heavier (e.g. X=Fe) and/or less abundant elements (e.g. X=F) is not discussed here, as their chemistry is poorly known and their use as tracers currently limited. However, with the ongoing search for new diatomic hydrides using the new Herschel Space Observatory (e.g.Cernicharo et al. 2010), this sitation may change. For example Neufeld et al. (2010) report the detection of HF using the HIFI instrument onboard Herschel. Due to the dissociation energy of HF being larger than of H2, HF can be formed in an exothermic reaction of F with H2 and HF may become the dominant reservoir of fluorine (Neufeld & Wolfire 2009). The silicon bearing SiH and SiH+ may be interesting in the context of shocked regions where “sputtering” from dust grains (e.g. Flower et al. 1996) can increase the gas phase abundance of silicon.
The Herschel Space Observatory and Band 10 receivers of the upcoming Atacama Large Millimeter and submillimeter Array (ALMA) allow the study of important FUV and X-ray tracers, like diatomic hydrides, at high sensitivity and with good spatial and spectral resolution for the first time. This raises the questions: What is the expected abundance and line flux of FUV enhanced species in the scenario of directly irradiated outflow walls? From which region of the envelope does the molecular radiation emerge and how are the molecules excited? How dependent are observable quantities (line fluxes or line ratios) on characteristics that cannot be constrained directly from observations (e.g. geometry in the innermost part of the envelope and chemical age)? To attack such questions, detailed numerical models of the chemistry of YSOs envelopes can be used.
Models of the chemistry of YSO envelopes have so far mostly assumed a slab or spherical symmetry and a static physical structure (e.g. Viti & Williams 1999, Doty et al. 2002). In situations with chemical timescales longer than dynamical timescales, the chemistry needs to be coupled with the dynamical evolution (e.g. Doty et al. 2006). A particular example for this situation is the slow sulfur chemistry (Wakelam et al. 2004). Other models focus on the effect of protostellar FUV and X-ray radiation on the chemistry of a spherical envelope (Stäuber et al. 2004, 2005). Due to the high extinction of FUV radiation by dust, they find the chemistry to be modified only in the innermost few hundred AU. X-rays on the other hand, have a much lower absorption cross section. They may thus penetrate further into the envelope and dominate the ionization in the entire hot core. To study the effects of an outflow cavity that allows FUV radiation to escape and irradiate a larger part of the envelope, two-dimensional axisymmetric models are necessary.
Non-spherical chemical models of YSO envelopes are presented by Brinch et al. (2008), Visser et al. (2009) and in paper II. These models assume axisymmetry. The first two are applied on low-mass sources and include the effects of infall to study the chemical evolution from the cloud to the disk. The model in paper II is applied on a high-mass star forming region. It calculates the gas temperature self-consistently with the chemical abundances similar to models of photo dominated regions (PDRs; e.g. Kaufman et al. 1999, Meijerink & Spaans 2005), but it does not account for the dynamical evolution. The model presented in paper II considers FUV ( eV) and X-ray ( eV) induced chemistry.
In this work, we further develop the model introduced in paper II. It is based on the grid of chemical models introduced in the first paper of this series of papers (Bruderer et al. 2009c, hereafter paper I). We extend the model with two important tools: (i) with a dust radiative transfer method for a self-consistent calculation of the dust temperature and (ii) a multi-zone escape probability method to study the molecular excitation and radiation. We apply the model to AFGL 2591 to answer the questions raised above. In particular we predict line fluxes of two selected diatomic hydrides (SH and CH+), having typical properties of diatomic hydrides with high temperatures needed for formation and high critical densities. These two molecules will be observed in AFGL 2591 by the Water In Star-forming regions with Herschel (WISH111www.strw.leidenuniv.nl/WISH; van Dishoeck et al. 2010, in prep.) guaranteed time key program.
This paper is organized as follows. We first describe the details of the model in section 2. The physical structure of different models is discussed in section 3. The chemical abundances obtained from these physical structures are presented in section 4, and compared to the results of one-dimensional models. The molecular excitation and line radiation is then studied in section 5, and the scientific prospectives of hydride observations with Herschel are discussed in 6. Limitations of the model used in this work are given in Section 7.
2. Model
In this section, we briefly describe the calculation flow of the models used here. Details on the new parts of the model, the dust radiative transfer and the molecular excitation calculation, are given in Appendicies A and B, respectively.
The modeling process starts with assuming a density structure and the spectrum of the central source. A dust radiative transfer calculation then solves for the dust temperature. The local FUV and X-ray radiation is calculated at every point of the model as described in Appendix A. In the next step, the gas temperature is obtained by equating the heating and cooling rates (paper II). Since these rates depend on the chemical abundances (e.g. of the atomic coolants C+ and O) the calculation of the gas temperature has to be performed simultaneously with the chemistry. This time-consuming step is facilitated by the grid of chemical models introduced in paper I. The grid consists of a database of precalculated abundances depending on physical parameters (density, temperature, FUV flux, X-ray flux, cosmic-ray ionization rate and chemical age; see paper I for a definition of these parameters) from which abundances can be interpolated quickly. The interpolation approach is also used to obtain the abundances of all other species (e.g. diatomic hydrides). The molecular excitation is calculated using the escape probability approach described in Appendix B and yields the modeled line radiation, thus the observable quantities.
2.1. A grid of density structures/cavity shapes
A spherical model of AFGL 2591 has been constructed by van der Tak et al. (1999, 2000) based on maps of the dust continuum, the spectral energy distribution (SED) and molecular line emission. In their fitting, they find good agreement on larger scales. However, continuum emission at shorter wavelengths (warm dust) requires a shallower density profile in the innermost . They conclude that an inner region with roughly constant temperature may be required to reproduce all observations. Jørgensen et al. (2005) encountered similar problems of an excess emission in short wavelengths when fitting the continuum emission of IRAS 16293-2422. They concluded that a large spherical cavity can explain this excess. However, Crimier et al. (2010) can explain both SED and maps by a higher bolometric luminosity. In AFGL 2591, new high resolution observations at 24.5 m by de Wit et al. (2009) show extended emission at scales of up to in the direction of the outflow. This emission stems from the outflow walls (Bruderer et al. 2009a), supporting the scenario of a cavity.
For this work, we adopt the density structure of the spherical model by van der Tak et al. (1999). This choice allows to study the differences of the two-dimensional chemical model including an outflow cavity with the spherically symmetric models by Doty et al. (2002) and Stäuber et al. (2004, 2005). The cavity shape is assumed to follow a power-law with index ,
| (1) |
where and are coordinates along the outflow axis and perpendicular to the outflow, respectively. The full opening angle of the outflow is given at a distance . As in paper II, we use AU, approximately the scale on which Preibisch et al. 2003 have probed the opening angle of the outflow cavity. Cavity shapes for different choices of and are given in Figure 1. The solid line indicates the model used in paper II. Figure 1 also shows the line of sight toward us crossing the outflow wall at a shallow angle, as suggested by van der Tak et al. (1999). A further parameter of the model is the density in the cavity, which we assume to be reduced by a constant factor compared to the spherical density model at the same radius. This is motivated by the pressure equilibirum along the outflow wall (paper II). Note that for , used in most of the models, the results are independent of that assumption as the opacity in FUV wavelengths along the outflow is low.
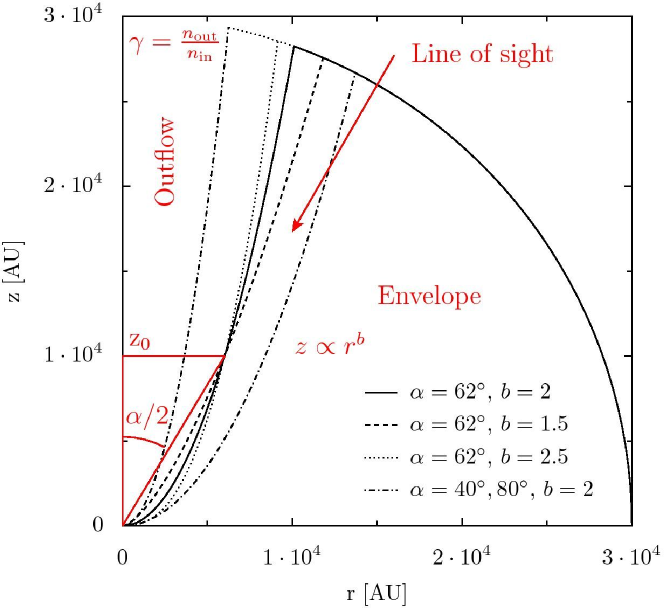
A grid of different models is discussed in the following sections. Starting from the model used in paper II (referred as model Standard in the following) we explore the parameter range by varying the outflow opening angle , the power-law index , cavity density and the bolometric luminosity of the protostar (Table 1). As in paper II, we assume the central source to emit a black body spectrum with a temperature of K following van der Tak et al. (1999) (see Section 7). Thus, the FUV field has photons that can dissociate CO and H2.
| Model | |||||
|---|---|---|---|---|---|
| [∘] | [] | ||||
| Standard | 62 | 2 | 2.5(-3) | 2(4) | |
| Diska | 62 | 2 | 2.5(-3) | 2(4) | |
| Opening angle | |||||
| 20 | 20 | 2 | 2.5(-3) | 2(4) | |
| 40 | 40 | 2 | 2.5(-3) | 2(4) | |
| 80 | 80 | 2 | 2.5(-3) | 2(4) | |
| 100 | 100 | 2 | 2.5(-3) | 2(4) | |
| Cavity density | |||||
| 0 | 62 | 2 | 0 | 2(4) | |
| 0.01 | 62 | 2 | 1(-2) | 2(4) | |
| 0.1 | 62 | 2 | 0.1 | 2(4) | |
| Cavity shape | |||||
| 1.5 | 62 | 1.5 | 2.5(-3) | 2(4) | |
| 2.5 | 62 | 2.5 | 2.5(-3) | 2(4) | |
| Source luminosity | |||||
| 2e3 | 62 | 2 | 2.5(-3) | 2(3) | |
| 1e4 | 62 | 2 | 2.5(-3) | 1(4) | |
| 4e4 | 62 | 2 | 2.5(-3) | 4(4) | |
Note:
aParameters like in the model Standard, but with a disk of mass 0.8 in the innermost 400 AU.
A compact structure with a systematic velocity gradient has been detected in AFGL 2591 by van der Tak et al. (2006) using interferometric observations. They propose a circumstellar disk to be the source of this radiation and constrain a mass of within a radius of 400 AU to the protostar. While a detailed modeling of the disk is beyond the scope of this study, model Disk implements a toy-model of a disk embedded in the envelope of the model Standard. The toy-model consists of a massless (in relation to the protostar) Keplerian disk (e.g. Fischer et al. 1996) with a surface density , a scale height and a mass of within a radius of 400 AU to the protostar. The density distribution of the disk and the inner envelope is given in Figure 5.
3. Physical structure
Different physical conditions such as gas and dust temperature, density, FUV and X-ray irradiation govern the chemical composition and molecular excitation. As a first step to quantify these physical properties of the different envelopes models, we study the amount of material with distinct conditions (e.g. a gas temperature above 100 K). Certain conditions like warm temperatures, a high density and a FUV field stronger than 1 ISRF (interstellar radiation field) can be necessary for the formation and excitation of a molecule. Combinations of these regions (e.g. high density and strong FUV field) can be relevant for the formation and excitation of molecules and thus the predicted line strength that can be compared with observations. While the definition of such physical regions is arbitrary, it gives a simple overview on differences between models and thus the influence of the geometry.
In Table 2, we show the absolute mass (in ) and mass relative to Model Standard () for the following regions:
-
•
K. Several molecules only form at high temperature, like for example the diatomic hydrides discussed in this work. We report on the region with dust and gas temperature above 100 K, which is assumed to be the water evaporation temperature (paper I).
-
•
FUV. FUV radiation alters the chemical composition by photoprocesses (ionization and dissociation) and also through heating of the gas. The FUV region is defined by the FUV flux larger than 1 ISRF. We recall, however, that the structure of the outflow walls is more complicated and some species only exist in different layers, for example the C+/C/CO layer structure also seen in PDRs.
-
•
X-rays. X-rays affect the chemistry mostly by secondary electrons created by fast photoelectrons ionizing H2 (Maloney et al. 1996; Stäuber et al. 2005). Assuming an X-ray luminosity of erg s-1 in the 0.1 - 100 keV band as suggested by Stäuber et al. (2005), heating by X-rays can be neglected (paper II and Stäuber et al. 2005). While the influence of X-rays is very similar to that of a high cosmic-ray ionization rate (paper I), there are differences in FUV irradiated regions (e.g. Stäuber et al. 2006 for a discussion of the water abundance in FUV and X-ray irradiated regions). The X-ray region is defined by the H2 ionization rate larger than the “standard” cosmic-ray ionization rate of s-1 by a factor of about five ( s-1). This anticipates the uncertainty in the observational determination of the cosmic-ray ionization rate (van der Tak & van Dishoeck 2000, Doty et al. 2002, Indriolo et al. 2007).
-
•
K & No FUV. An important region of the envelope is the part which has a temperature above 100 K but no FUV irradiation. Hot core species which can be photodissociated may exist only in that region. The region is defined by the temperature (see Section 4) and the FUV region, defined above.
The spherical model is also given in Table 2. For comparison with earlier modeling, we follow Stäuber et al. (2004, 2005) and assume a visual extinction of and ISRF at the inner edge of the modeled region at 200 AU and use the gas and dust temperature by Doty et al. (2002).
For the model Spherical, a plot of the radial dependence of density and temperature is given in Figure 3 of paper I. For this model, the radial size of the regions discussed here are: 1900 AU ( K), 1100 AU ( K and K (No FUV)), 224 AU (FUV), 2300 AU (X-rays and only X-rays). This shows the small size of the FUV irradiated and heated region in a spherical model compared to the models including and outflow wall. The extent of the different regions of model Standard is indicated in Figure 2 and the inset of Figure 6.
The X-ray luminosity of AFGL 2591 cannot be measured directly do to the high column density towards the protostar, but upper limits of erg s-1 are given in Carkner et al. (1998). However, they assume an attenuating column density to the source of only cm-2, much smaller than the radial column density of about cm-2 of the density profile used here. Note that the column density derived from the density profile can be affected by uncertainties e.g. in the adopted dust opacity (van der Tak et al. 1999). For the plasma temperature of K assumed here (paper II), the X-ray luminosity may be a factor of about 10 higher assuming an attenuating column density of cm-2 (e.g. Appendix A of paper I). We thus consider the adopted value of the X-ray luminosity of erg s-1 as an upper limit.
| Model | K | K | FUV | X-rays | only X-raysb | K (No FUV)c | ||||
| Absolute Values () | ||||||||||
| Spherical | 49.4 | 0.94 | 33.5 | 0.20 | 6.8(-2) | 5.7(-4) | 0.29 | 0.29 | 6.7(-2) | |
| Standard | 44.3 | 0.45 | 18.7 | 6.7(-2) | 0.71 | 1.9 | 0.70 | 0.32 | 7.9(-3) | |
| Relative to Model Standard | ||||||||||
| Spherical | 1.1 | 2.1 | 1.8 | 3.0 | 9.6(-2) | 3.0(-4) | 0.42 | 0.92 | 8.5 | |
| Standard | 1 | 1 | 1 | 1 | 1 | 1 | 1 | 1 | 1 | |
| Disk | 1.1 | 9.1 | 1.2 | 15.6 | 2.3 | 1.2 | 1.3 | 0.82 | 83.7 | |
| Opening angle | ||||||||||
| 20 | 1.1 | 1.8 | 1.2 | 2.3 | 0.36 | 0.25 | 0.70 | 1.3 | 17.0 | |
| 40 | 1.1 | 1.5 | 1.1 | 1.5 | 0.60 | 0.60 | 0.87 | 1.2 | 6.7 | |
| 80 | 0.91 | 0.64 | 0.87 | 0.72 | 1.4 | 1.4 | 0.90 | 0.47 | 0 | |
| 100 | 0.75 | 0.36 | 0.68 | 0.49 | 1.8 | 1.8 | 0.73 | 9.4(-2) | 0 | |
| Cavity density | ||||||||||
| 0 | 1 | 1 | 1 | 1.1 | 1.2 | 1.1 | 1.0 | 1.0 | 0.71 | |
| 0.01 | 1 | 1 | 1 | 0.91 | 0.46 | 0.73 | 0.93 | 1.0 | 1.8 | |
| 0.1 | 1 | 1 | 1 | 0.71 | 1.2(-2) | 3.8(-3) | 0.65 | 1.4 | 5.5 | |
| Cavity shape | ||||||||||
| 1.5 | 0.99 | 1.3 | 1.01 | 1.2 | 0.90 | 0.95 | 0.76 | 0.85 | 4.3 | |
| 2.5 | 1 | 0.76 | 0.99 | 0.91 | 1.1 | 1.1 | 1.1 | 0.90 | 8.9(-2) | |
| Source luminosity | ||||||||||
| 2e3 | 1 | 1 | 1 | 6.9(-2) | 0.37 | 0.66 | 1 | 1.2 | 0 | |
| 1e4 | 1 | 1 | 1 | 0.41 | 0.76 | 0.89 | 1 | 1.0 | 8.9(-2) | |
| 4e4 | 1 | 1 | 1 | 2.3 | 1.3 | 1.1 | 1 | 0.96 | 5.0 | |
Note: .
aDefined by .
bOnly in the X-ray region and not in the FUV region.
cRegion with K outside the FUV region.
3.1. Total mass
The total mass of the envelopes () of the various models is very similar with maximum differences of 25 % compared to model Standard (Table 2). The situation is different if only the inner part of the envelope is considered. We give the mass within a radius of 4000 and 20000 AU to the protostar ( and ) following the Herschel beam at the shortest/longest wavelengths of PACS/HIFI (60-625 m) assuming a distance of 1 kpc to the source (van der Tak et al. 1999). Clearly, there is foreground material within the Herschel beam. In this work, however, we concentrate on molecules with lines having high critical densities. They thus trace only the inner regions due to the density gradient. However, dust or line radiation from inner regions may also pump molecules further out (e.g. van Kempen et al. 2008). A detailed discussion which regions are traced by molecular emission requires the calculation of the excitation as presented in Section 5.
Models with a large opening angle (100) or the toy-disk have masses which are 3 times smaller and 10 times larger, respectively, compared to the model Standard. More than half of the envelope mass is outside a radius of 20000 AU and differences between individual models are less evident in and not seen in .
We conclude that different cavity shapes affect the total mass only in the inner part of the envelope, with the largest changes found for models with a large/small outflow opening angle or a disk embedded in the envelope.
3.2. Dust temperature above 100 K
The mass with dust temperature above 100 K approximately scales with for models with the disk and different cavity shape (Models 20-100, b1.5, b2.5). This is explained by the dust temperature depending only on the distance to the protostar and not on the density in optically thin, spherically symmetric models. For this case, the radius for a given temperature varies as (e.g. Jørgensen et al. 2006). For the density structure , the mass with K should scale . Models L2e3, L1e4 and L4e4 depend slightly stronger on due to the cavity removing more of the dense material in the inner part compared to larger distances to the protostar. Changing the density in the cavity (Models 0, 0.01 and 0.1) affects the mass with K by the attenuation of direct stellar radiation in FUV wavelengths that heats the dust in the outflow walls.
We conclude that the amount of material with dust temperature above 100 K is within a factor of two to the model Standard for models with a different cavity shape, but larger for the models including a Disk and with a lower bolometric luminosity (L2e3).
3.3. Gas temperature above 100 K
Gas with K is more than an order of magnitude less present in the spherical model and model 0.1 compared to the model Standard. This underlines the impact of the empty cavity to extensively enhance warm gas by escaping FUV radiation. Model 0.1 has even less warm gas than the spherical model, due to a more efficient cooling through the low-density outflow region. In all other models, the deviation of the mass with K compared to model Standard is smaller than a factor of three. In particular, the models with a different bolometric luminosity (2e3, 1e4 and 4e4) scale less than with due to the PDR surface temperature scaling with less than for densities below about cm-3 (e.g. Kaufman et al. 1999, Meijerink et al. 2007).
We conclude that the mass with gas temperatures above 100 K changes most if the geometrical situation is similar to the spherically symmetric model. These are models with a small outflow opening angle or a high density of absorbing material in the outflow.
3.4. X-ray and FUV irradiation
Regions with high-energy irradiation (FUV and/or X-rays) are given in Figure 2 for models Standard, disk and 20. They show an FUV region along the outflow cavity. The X-ray region is less concentrated to the surface and also includes the envelope to distances of up to a few 1000 AU. A region with only X-ray influence follows the FUV irradiated surface layer in the vicinity of the protostar (distance AU). Some surface concentration is also seen in X-rays due to photons with energy between 0.1 and 1 keV which are attenuated by a relatively low column density (of order cm-2). Harder X-rays with keV require a column density of order cm-2 to be attenuated (paper I). A disk can provide such a high column density and shield the envelope even for hard X-rays (Figure 2).
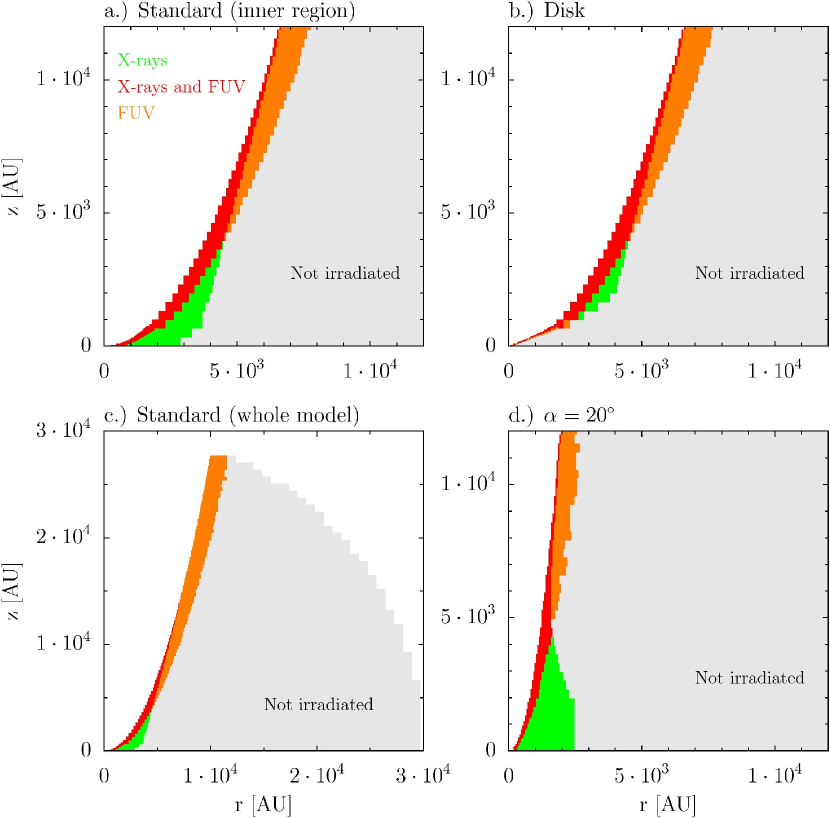
The mass of the X-ray/FUV irradiated gas is the same for most models within a factor of two relative to model Standard. Exceptions are the FUV irradiated mass in the spherical model and model 0.1 being orders of magnitude smaller. Smaller opening angles (Model 20) yield a larger incident angle of the FUV radiation and thus a thinner outflow wall. This is reflected in the FUV irradiated mass and also the mass with K. For large opening angles (100) the FUV radiation penetrates to the midplane of the flat structure and the region with only X-ray irradiation is much smaller. In the model including a disk, the mass suffering X-ray irradiation is not much different despite the shielding seen in Figure 2. It is caused by the larger density in the innermost part at the surface of the disk.
The largest variations between different models are found for the mass of the region with K but no FUV irradiation. This region is shown in yellow in the Figures 6 and 5 for models Standard, b1.5, b2.5, 20 and disk. A thin layer of FUV heated gas is followed by an infrared heated region. If the region close to the protostar is geometrically thin (b2.5, 80 and 100) FUV radiation can penetrate to the midplane and no material with K but no FUV irradiation exists. Geometrically thin/thick means that the distance in vertical direction between the midplane and the outflow is small/large. In models with a geometrically thick inner region (b1.5, 80 and 100) or more mass in the innermost region (disk) the amount of IR heated gas with can be even larger than in the spherically symmetric model. The strong sensitivity of this mass on the bolometric luminosity is the result of the dust mass with temperature above 100 K depending more on the bolometric luminosity than the gas temperature (Section 3.2 and 3.3).
We conclude that the mass with X-ray irradiation is not considerably affected by the geometry, while the mass with FUV irradiation shows differences for those models that are similar to the spherical situation (small opening angle or high density of absorbing material in the outflow). The region with temperature above 100 K but no FUV irradiation depends considerably on the geometry and the bolometric luminosity of the source. Models with a geometrically thin inner part of the envelope (for example a large outflow opening angle) have considerably less material with temperatures above 100 K but no FUV irradiation.
4. Chemical Abundances
Chemical abundances, their evolution, differences between physical models and the impact of X-rays are studied in this section. We first study fractional abundances , with and , the density of the species and the total hydrogen density () depending on the position. The fractional abundance gives an overview of the spatial variation of the molecule. Next, the volume averaged fractional abundance is discussed. The volume averaged abundance of a species X within a radius is defined by
| (2) |
This quantity is more related to observations, as the volume averaged abundance times the mass gives the total amount of molecules. The total amount of molecules scales with the line flux in the optically thin case, neglecting excitation effects.
In paper I, the dust and gas temperature are assumed to be equal, and evaporation is approximated by an increased initial abundance for certain temperature ranges. Here, we calculate the dust and gas temperature explicitly. Since the abundances of the species considered here do not change much in the temperature range K, but much more with water evaporation at 100 K, we use to obtain the abundances from the grid of chemical models. This choice affects only the innermost region with dust temperatures above 100 K heated by infrared photons (Figure 3 and Section 3). Abundances outside this region are found to agree to within 20% if the gas temperature were used instead. This also shows that the abundances of the diatomic hydrides are not sensitively depending on the assumed water evaporation temperature. The evaporation temperature of the diatomic hydrides is not well known. However, as their abundance on dust grains likely is small (e.g. Hasegawa & Herbst 1993), the effect of direct evaporation of diatomic hydrides to the gas phase is neglected here.
4.1. Standard and spherically symmetric model
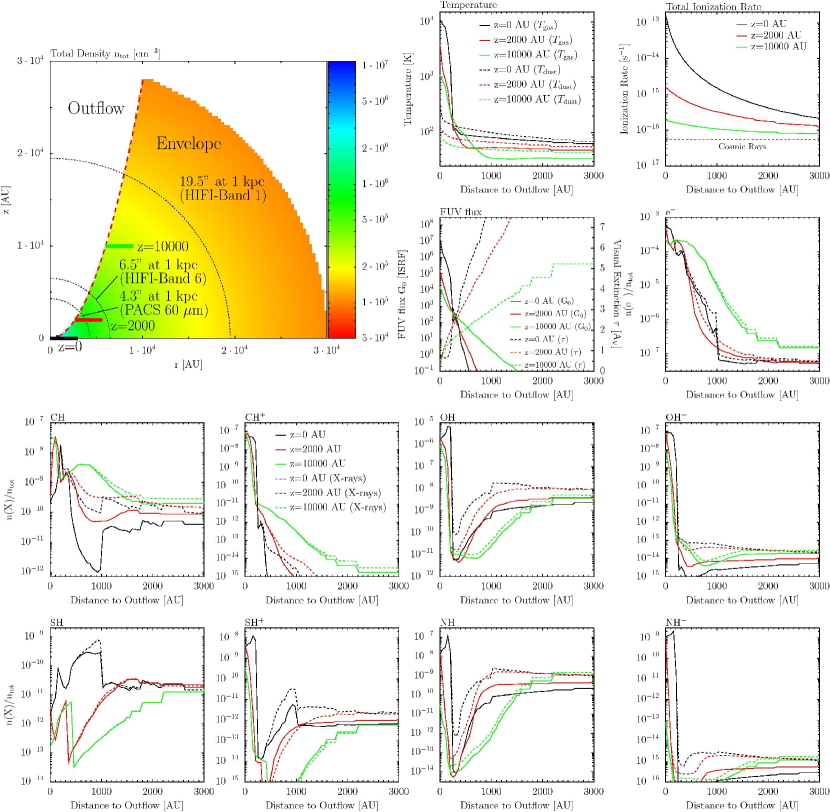
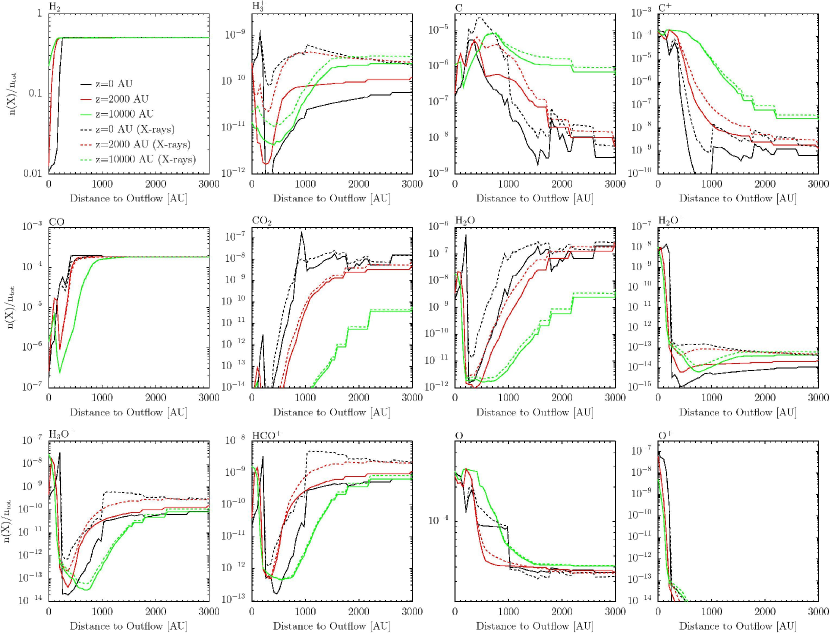
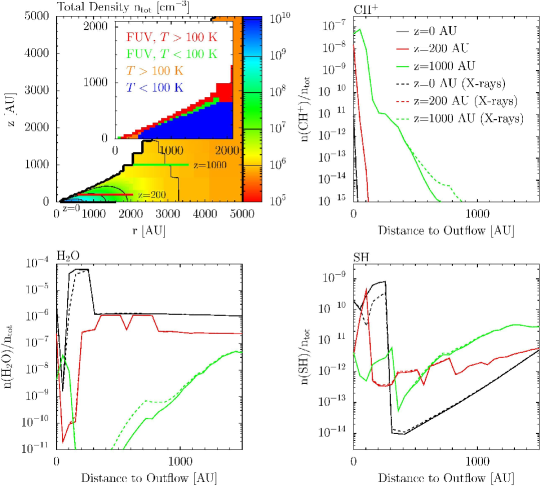
The abundances of diatomic hydrides, related species and main molecules/atoms (H2, CO, CO2, H2O, O, C, C+) for the model Standard are given along cuts of constant (parallel to the midplane, at , and AU) in Figures 3 and 4. Presented abundances are for a chemical age of yrs (Stäuber et al. 2005) and with a protostellar X-ray luminosity of erg s-1 or no protostellar X-rays. The density structure of the model along with the dust and gas temperature, total ionization rate (see paper I), the FUV flux and attenuation are given in the top panels of Figure 3.
As a rough classification of the abundance profiles we can divide the species into broad groups of molecules which are (i) enhanced in the outflow wall compared to the envelopes (e.g. electrons, C+, CH+) with different widths of the enhanced region; (ii) destroyed along the outflow (e.g. H2, CO or H2O); (iii) enhanced in a thin top layer and destroyed at intermediate depths (e.g. OH or H3O+). Why are some molecules enhanced or destroyed in different layers? The overall chemistry of FUV/X-ray irradiated molecular gas has been studied in various papers (Hollenbach & Tielens 1999 for a review) and for envelopes of YSOs in particular by Stäuber et al. (2004, 2005). Here, we focus on the chemistry of diatomic hydrides and related species in the physical regime of the outflow walls.
4.1.1 The chemistry in the outflow walls
In the top layer of the outflow wall with smaller than a few, the temperature is high, with K. Due to self-shielding, H2 and CO are only destroyed in a thin layer. Photoprocesses proceeding through continuum absorption, as for example the photoionization of carbon, require a minimum photon energy (Å). Due to the higher dust opacity at shorter wavelengths (reddening), photons with higher energy are absorbed more quickly and carbon photoionization is most active at the surface. Ionized carbon forms CH+ by, C+ + H2 CH+ + H, but this reaction is highly endoergic by 4640 K. The reaction of CH+ with H2 produces CH and CH which recombine with electrons to CH. Since the oxygen ionization energy is slightly higher than 13.6 eV, O+ is produced by charge exchange with protons, O + H+ O+ + H, with H+ from the photodissociation of CH+. Ionized hydroxyl (OH+) is then formed by H2 + O+ OH+ + H. Subsequent reactions with H2 lead from OH+ to H2O+ and then H3O+, which recombines to OH and H2O. Hydroxyl is however mainly formed by the endoergic reaction H2 + O + 3150 K OH + H. Water also forms by an endoergic reaction, H2 + OH + 1740 K H2O + H and is photodissociated to OH + H. Reactions of OH with O and CO form O2 and CO2, respectively, which are both quickly photodissociated. Sulfur hydride and its ion are formed in the endoergic reactions S + H2 + 6130 K SH + H and S+ + H2 + 9860 K SH+ + H with S+ from direct photoionization of S. Finally, NH is created by H2 + N + 18100 K NH + H. Since the ionization potential of atomic nitrogen is higher than 13.6 eV, NH+ is only produced by photoionization of NH or charge exchange H+ + NH NH+ + H.
In an intermediate layer, at higher optical depth, the temperature drops below 100 K (Figure 3). In this colder environment, the photodissociation of OH is still considerable but the endoergic formation reaction of H2 + O OH + H is no longer efficient. This explains the drop of the OH abundance in this layer. The drop is also seen in other molecules (SH+, NH, NH+, H2O; group (iii) in Section 4.1). For H3O+, the situation is different: Since CH+ is not available in this layer, the main production of H+ is disabled and subsequently, no O+ is available. Thus, the abundances of OH+, H2O+ and H3O+ are decreased.
We conclude that the concentration of many outflow wall enhanced species towards the outflow is a consequence of (atomic) ionization being only active at the surface due to a quick shielding of short wavelength photons by dust (C+ and S+) combined with the high required temperature to overcome the activation energy for the formation (especially CH+, OH, SH, SH+, NH and NH+).
In the midplane (), at a distance of about 1000 AU to the protostar, the influence of H2S, H2O and CO2 evaporation can be seen. At this point, FUV radiation is present but too weak to heat the gas above 100 K, while IR radiation still heats the dust grains to K. The evaporated water is quickly photodissociated and its abundance is not increased. The higher amount of sulphur in the gas phase leads to an enhancement of SH and SH+ which can been seen. Also affected are C+ and CH, which have an increased abundance in colder regions due to reaction partners being less abundant. C+ is destroyed in reactions with atomic sulphur, while CH is destroyed with atomic oxygen. Among the species discussed here (SH, SH+, CH and CH+), only SH reaches abundances in this region that are higher compared to the outflow walls. Thus, SH emission may be dominated by this region with sulphur evaporated to the gas phase (Section 4.2 and 5.2).
We next consider HCO+ which is predicted to be an ionization tracer (e.g. van der Tak & van Dishoeck 2000 or Savage & Ziurys 2004). In the top layer of the outflow wall, it is formed by the reaction of H2 with HOC+ and CO+. The huge enhancement of CO+ by four orders of magnitude in a thin layer along the outflow has been discussed in paper II. Going deeper into the outflow-wall, HCO+ is destroyed by electron recombination and then enhanced by the reaction of CO with H. The H ion is a key species for the X-ray driven chemistry (Maloney et al. 1996 or Stäuber et al. 2005) and formed by cosmic-ray or X-ray ionization of H2 followed by a quick reaction with H2. The high abundance of H at the surface of the outflow wall is maintained by the reaction NH+ + H2 N + H. Deeper in the outflow wall, the high electron fraction leads to quick electron recombination of H.
An important difference between X-ray and FUV driven chemistry is the electron fraction. For fluxes of 1 erg s-1 cm-2 ( ISRF) the electron fraction at a total density of cm-3 is approximately for FUV but only for X-rays. Since the luminosity in the FUV band is 4 orders of magnitude higher than the X-ray luminosity, the large electron fraction is mainly produced by FUV radiation. Since this electron fraction leads to the destruction of H, the influence of X-rays is dwarfed by FUV radiation. In addition, many molecules predicted to be X-ray tracers by Stäuber et al. (2005), are much more enhanced by FUV compared to X-rays. Particular examples are CH+ and OH+, which both have fractional abundances below in the spherical model but increase to more than in the outflow walls. We conclude that the effect of X-rays compared to FUV on the chemistry is small in a geometry which allows the much stronger FUV radiation to escape from the innermost part.
4.1.2 Volume averaged abundances
How is the total amount of a molecule/atom altered by the enhancement or absence in the outflow wall? For example a thin layer of strongly enhanced CO+ is found in paper II to enhance the total amount by three orders of magnitude in agreement with observations. We note that CO+ is related to the diatomic hydrides studied here through formation by C+ + OH CO+ + H. FUV destroyed species on the other hand, should not decrease their total abundance significantly since only a relatively small fraction of the envelope mass is cut out by a cavity (Section 3). In Table 3, we give volume averaged abundances within a radius of 4000 and 20000 AU for the model Standard and compare it to the spherical model. In the following we consider a deviation larger than a factor of three to be significant, since similar models (Doty et al. 2004) qualify a factorial deviation of this factor between a model and observation as a good agreement.
| Model | 2D | 2D | 2D | 2D | 2D | 1D | 1D | 1D | Ratio 2D/1D | ||
| X-rays [erg s-1] | 1(32) | 1(32) | - | 1(32) | 1(32) | 1(32) | 1(32) | -a | 1(32) | 1(32) | - |
| Chem. age [yrs] | 5(4) | 5(4) | 5(4) | 3(3) | 3(5) | 5(4) | 5(4) | 5(4) | 5(4) | 5(4) | 5(4) |
| Averaged [AU] | 20000 | 4000 | 4000 | 20000 | 20000 | 20000 | 4000 | 4000 | 20000 | 4000 | 4000 |
| H2 | 5(-1) | 5(-1) | 5(-1) | 5(-1) | 5(-1) | 5(-1) | 5(-1) | 5(-1) | 1.0 | 0.9 | 0.9 |
| e- | 8(-6) | 5(-5) | 5(-5) | 6(-6) | 8(-6) | 1(-8) | 2(-8) | 6(-9) | 8(2) | 3(3) | 8(3) |
| H | 3(-10) | 3(-10) | 5(-11) | 3(-10) | 3(-10) | 3(-10) | 4(-10) | 6(-11) | 1.0 | 0.7 | 0.8 |
| CH | 6(-10) | 2(-9) | 2(-9) | 9(-10) | 6(-10) | 5(-11) | 8(-11) | 2(-11) | 11 | 30 | 1(2) |
| CH+ | 4(-10) | 4(-9) | 4(-9) | 4(-10) | 4(-10) | 4(-16) | 6(-16) | 6(-17) | 1(6) | 8(6) | 7(7) |
| OH | 2(-8) | 1(-7) | 1(-7) | 2(-8) | 2(-8) | 9(-9) | 1(-8) | 3(-9) | 1.9 | 9.5 | 43 |
| OH+ | 1(-10) | 3(-9) | 3(-9) | 1(-10) | 1(-10) | 2(-14) | 3(-14) | 4(-15) | 6(3) | 9(4) | 7(5) |
| SH | 3(-11) | 2(-11) | 2(-11) | 2(-10) | 2(-11) | 2(-10) | 1(-9) | 3(-9) | 0.1 | 0.01 | 6(-3) |
| SH+ | 1(-11) | 2(-10) | 2(-10) | 1(-11) | 1(-11) | 9(-12) | 9(-11) | 2(-12) | 1.1 | 2.1 | 1(2) |
| NH | 1(-9) | 2(-9) | 9(-10) | 1(-9) | 1(-9) | 5(-10) | 7(-10) | 6(-11) | 2.4 | 2.3 | 15 |
| NH+ | 1(-12) | 3(-11) | 3(-11) | 1(-12) | 1(-12) | 1(-15) | 2(-15) | 3(-16) | 8(2) | 2(4) | 1(5) |
| C+ | 7(-6) | 3(-5) | 3(-5) | 4(-6) | 7(-6) | 4(-10) | 7(-10) | 1(-10) | 2(4) | 4(4) | 2(5) |
| C | 5(-7) | 2(-6) | 7(-7) | 1(-7) | 6(-7) | 4(-8) | 3(-8) | 1(-8) | 11 | 70 | 51 |
| CO | 2(-4) | 1(-4) | 1(-4) | 2(-4) | 2(-4) | 2(-4) | 2(-4) | 2(-4) | 1.0 | 0.8 | 0.8 |
| CO2 | 5(-9) | 4(-9) | 5(-9) | 1(-9) | 1(-8) | 3(-8) | 7(-8) | 9(-7) | 0.2 | 0.06 | 5(-3) |
| H2O | 2(-7) | 9(-8) | 6(-8) | 5(-8) | 3(-7) | 8(-7) | 6(-7) | 5(-6) | 0.3 | 0.1 | 0.01 |
| H2O+ | 5(-11) | 5(-10) | 5(-10) | 5(-11) | 5(-11) | 4(-14) | 7(-14) | 1(-14) | 1(3) | 7(3) | 5(4) |
| H3O+ | 4(-10) | 1(-9) | 9(-10) | 3(-10) | 4(-10) | 1(-9) | 2(-9) | 6(-10) | 0.4 | 0.6 | 1.5 |
| HCO+ | 2(-9) | 1(-9) | 4(-10) | 2(-9) | 2(-9) | 4(-9) | 8(-9) | 2(-9) | 0.5 | 0.2 | 0.2 |
| O | 5(-5) | 8(-5) | 8(-5) | 5(-5) | 4(-5) | 4(-5) | 3(-5) | 3(-5) | 1.3 | 2.5 | 2.4 |
Note: .
aFUV also switched off.
Outflow wall enhanced species indeed have a significantly enhanced volume averaged abundance compared to the spherically symmetric model. Most enhanced are the ionized molecules C+, CH+, OH+, NH+, H2O+ and the electron fraction with an enhancement larger than 3 orders of magnitude and up to almost 7 orders of magnitude. On the other hand, it is found that the FUV destruction of H2O, CO2 and SH reduces the volume averaged abundance less, by at most a factor of 100. Both enhancement and reduction are seen more in the abundance averaged over 4000 AU rather than 20000 AU. The width of the region with FUV enhancement is important too. For example the volume averaged abundance of SH+ is only increased by a factor of about two despite the enhancement by about 2 orders of magnitude in a very thin layer on the surface of the outflow wall. Similarly, the abundance of NH is only increased in the inner part of the envelope due to the strong temperature dependence of the abundance and the volume averaged abundance is only increased by a factor of two. This strong temperature dependence and consequently the concentration to the inner part also explains the largest difference of enhancement of NH+ between the volume averages of 4000 AU and 20000 AU.
The temporal evolution is studied in Table 3 by the volume averaged abundances within 20000 AU for a chemical age of s ( yrs) and s ( yrs), and compared to the chemical age of yrs found by Stäuber et al. (2005). The abundances averaged over 4000 AU are not shown since they are less time dependent. The outflow wall enhanced species have very short chemical time-scale for their formation and thus do not show any temporal evolution. We find that CH+ in the enhanced region only requires of order 10 yrs to reach the final fractional abundance to within a factor of two. The time-scales of OH+, NH+ and H2O+ are similarly short. Assuming an upper limit of 10 km s-1 for the Alfvén and sound velocity, the irradiated gas would move up to a distance of about 25 AU within the chemical timescale which justifies our approach to ignore the dynamical evolution of the gas. This is further justified by the fact that diatomic hydrides produced in the outflow walls diffusing into the cloud are quickly destroyed by reactions with other species. To test this, a chemical model presented in paper I has been run for conditions of the cold and not irradiated gas but with initially increased abundances of the diatomic hydrides. Since the C+ enhanced region is thicker, contributions from colder and less irradiated regions with longer timescales are important and the volume averaged abundance shows some temporal evolution (within a factor of two).
4.2. Comparing different geometries
The influence of different physical structures (Section 3) on chemical abundances is studied in this section. Tables 4 and 5 give the volume averaged abundances of molecules studied in the previous section. A chemical age of yrs and an X-ray luminosity of erg s-1 are used. The abundance is averaged over 4000 AU (all models) and 20000 AU (selected models). To obtain the total amount of a molecule, the mass of the region over which is averaged ( and ) is given relative to the model Standard. The molecules which were found in Section 4.1.2 to be significantly enhanced/destroyed or unchanged are marked with “+”/“-” or “0”, respectively.
| Model | H2 | e- | H | CH | CH+ | OH | OH+ | SH | SH+ | NH | ||
|---|---|---|---|---|---|---|---|---|---|---|---|---|
| Within 4000 AU | 0a | + | 0 | (+) | + | (+) | + | - | + | 0 | ||
| Spherical | 2.1 | 1.1 | 4(-4) | 1.4 | 3(-2) | 1(-7) | 0.1 | 1(-5) | 1(2) | 0.5 | 0.4 | |
| Standard | 1 | 1 | 1 | 1 | 1 | 1 | 1 | 1 | 1 | 1 | 1 | |
| Disk | 9.1 | 1.1 | 1(-1) | 3(-2) | 0.2 | 7(-2) | 0.7 | 6(-2) | 2.5 | 8(-2) | 5(-2) | |
| 20 | 1.8 | 1.0 | 0.2 | 1.1 | 0.2 | 0.2 | 0.9 | 0.3 | 1(2) | 0.3 | 1.1 | |
| 40 | 1.5 | 1.0 | 0.5 | 1.2 | 0.4 | 0.5 | 0.5 | 0.6 | 4.0 | 0.6 | 1.1 | |
| 80 | 0.64 | 1.0 | 1.5 | 0.7 | 2.9 | 1.8 | 1.9 | 1.2 | 0.4 | 1.6 | 1.0 | |
| 100 | 0.36 | 0.9 | 2.2 | 0.4 | 8.0 | 2.9 | 3.8 | 1.5 | 0.1 | 2.3 | 1.2 | |
| 0 | 1 | 1.0 | 1.0 | 1.0 | 0.9 | 1.0 | 0.8 | 0.9 | 0.9 | 0.8 | 0.9 | |
| 0.01 | 1 | 1.0 | 0.8 | 1.0 | 0.9 | 0.8 | 0.8 | 0.5 | 1.4 | 0.9 | 1.0 | |
| 0.1 | 1 | 1.1 | 4(-2) | 1.6 | 9(-2) | 9(-3) | 0.2 | 1(-2) | 4.0 | 0.3 | 1.8 | |
| b1.5 | 1.3 | 1.0 | 0.6 | 1.0 | 0.6 | 0.6 | 0.8 | 0.6 | 3(1) | 0.7 | 1.4 | |
| b2.5 | 0.76 | 1.0 | 1.4 | 1.0 | 1.7 | 1.6 | 1.4 | 1.4 | 0.6 | 1.4 | 1.0 | |
| L2e3 | 1 | 1.0 | 0.5 | 1.2 | 1.7 | 0.5 | 1.1 | 0.1 | 0.8 | 0.6 | 1.2 | |
| L1e4 | 1 | 1.0 | 0.8 | 1.1 | 1.3 | 0.9 | 1.1 | 0.8 | 0.7 | 1.0 | 1.3 | |
| L4e4 | 1 | 1.0 | 1.3 | 0.9 | 0.9 | 1.2 | 0.8 | 1.0 | 2.7 | 0.9 | 0.7 | |
| Within 20000 AU | ||||||||||||
| Spherical | 1.8 | 1.0 | 1(-3) | 1.0 | 9(-2) | 9(-7) | 0.5 | 2(-4) | 6.8 | 0.9 | 0.4 | |
| Standard | 1 | 1 | 1 | 1 | 1 | 1 | 1 | 1 | 1 | 1 | 1 | |
| Disk | 1.2 | 1.0 | 0.8 | 0.8 | 0.9 | 0.7 | 1.6 | 0.5 | 1.0 | 0.6 | 0.8 | |
| 20 | 1.2 | 1.0 | 0.2 | 1.0 | 0.4 | 0.2 | 0.8 | 0.3 | 5.7 | 0.6 | 0.7 | |
| 0.1 | 1 | 1.0 | 1(-2) | 1.1 | 0.3 | 2(-3) | 0.7 | 8(-3) | 1.2 | 0.4 | 1.1 | |
| L2e3 | 1 | 1.0 | 0.5 | 1.0 | 1.2 | 0.2 | 0.8 | 8(-2) | 1.3 | 0.5 | 1.0 | |
Note: .
aRatio to the spherical model within 4000 AU (Table 3; + more than , - less than 0.1, (+) more than 3, 0 within 0.1 to 3).
| NH+ | C+ | C | CO | CO2 | H2O | H2O+ | H3O+ | HCO+ | O | |||
| Within 4000 AU | +a | + | (+) | 0 | - | - | + | 0 | 0 | 0 | ||
| Spherical | 2.1 | 6(-5) | 3(-5) | 2(-2) | 1.3 | 2(1) | 6.8 | 1(-4) | 1.6 | 5.9 | 0.4 | |
| Standard | 1 | 1 | 1 | 1 | 1 | 1 | 1 | 1 | 1 | 1 | 1 | |
| Disk | 9.1 | 8(-2) | 0.1 | 0.2 | 1.3 | 3(2) | 7(1) | 8(-2) | 9(-2) | 6(-2) | 0.5 | |
| 20 | 1.8 | 0.3 | 0.2 | 0.4 | 1.3 | 4.7 | 4.7 | 0.2 | 0.4 | 1.5 | 0.6 | |
| 40 | 1.5 | 0.7 | 0.5 | 0.8 | 1.2 | 3.0 | 2.5 | 0.4 | 0.6 | 1.5 | 0.7 | |
| 80 | 0.64 | 1.2 | 1.6 | 1.1 | 0.8 | 4(-2) | 0.1 | 1.6 | 1.7 | 0.5 | 1.3 | |
| 100 | 0.36 | 1.6 | 2.4 | 1.3 | 0.5 | 2(-4) | 0.2 | 2.4 | 2.8 | 0.5 | 1.8 | |
| 0 | 1 | 0.7 | 1.0 | 1.0 | 1.0 | 1.2 | 1.2 | 0.9 | 1.0 | 1.0 | 1.0 | |
| 0.01 | 1 | 0.6 | 1.0 | 1.0 | 1.0 | 1.3 | 1.1 | 0.9 | 0.9 | 1.1 | 1.0 | |
| 0.1 | 1 | 0.1 | 3(-2) | 0.9 | 1.3 | 3.2 | 2.5 | 2(-2) | 0.4 | 2.0 | 0.5 | |
| b1.5 | 1.3 | 0.6 | 0.6 | 0.7 | 1.1 | 2.5 | 2.3 | 0.6 | 0.6 | 1.3 | 0.8 | |
| b2.5 | 0.76 | 1.3 | 1.4 | 1.2 | 0.9 | 0.2 | 0.3 | 1.6 | 1.4 | 0.7 | 1.2 | |
| L2e3 | 1 | 0.2 | 0.7 | 0.9 | 1.1 | 0.7 | 1.6 | 0.6 | 1.0 | 1.1 | 0.8 | |
| L1e4 | 1 | 0.9 | 1.0 | 0.9 | 1.0 | 1.0 | 1.3 | 1.0 | 0.8 | 1.1 | 0.9 | |
| L4e4 | 1 | 0.8 | 1.1 | 1.2 | 1.0 | 1.4 | 1.0 | 1.2 | 1.1 | 0.9 | 1.1 | |
| Within 20000 AU | ||||||||||||
| Spherical | 1.8 | 1(-3) | 7(-5) | 9(-2) | 1.0 | 6.3 | 3.5 | 1(-3) | 2.4 | 2.2 | 0.8 | |
| Standard | 1 | 1 | 1 | 1 | 1 | 1 | 1 | 1 | 1 | 1 | 1 | |
| Disk | 1.2 | 0.5 | 0.8 | 0.9 | 1.0 | 5(1) | 6.1 | 0.7 | 0.7 | 0.7 | 1.0 | |
| 20 | 1.2 | 0.4 | 0.2 | 0.4 | 1.0 | 3.3 | 1.8 | 0.2 | 1.7 | 1.8 | 0.8 | |
| 0.1 | 1 | 0.1 | 4(-3) | 0.1 | 1.0 | 1.4 | 1.3 | 7(-3) | 0.9 | 1.2 | 0.8 | |
| L2e3 | 1 | 0.2 | 0.5 | 1.1 | 1.0 | 1.6 | 1.4 | 0.2 | 0.9 | 1.0 | 0.9 | |
Note: .
aRatio to the spherical model within 4000 AU (Table 3; + more than , - less than 0.1, (+) more than 3, 0 within 0.1 to 3).
For the outflow wall enhanced species CH+, OH+, SH+, NH+, C+, H2O+ and electrons, the volume averaged abundance is most changed in the models Disk, 20 and 0.1. While for 20 and 0.1 averaging over 4000 and 20000 AU leads to a significantly lower abundance, the differences in the Disk model are only seen for the average over 4000 AU. However, when scaling with the higher mass of the Disk model within 4000 AU, the total amount of these charged species remains approximately constant. This reflects that the fractional abundance of outflow wall enhanced species is approximately inversely proportional to the density (paper I). In addition, the higher density yields a lower gas temperature and thus a decreased amount of molecules which require a high temperature for formation (e.g. CH+). Quantitatively, we find that the volume averaged abundances of outflow wall enhanced species behave similarly as the FUV irradiated mass, discussed in Section 3.
The FUV destroyed molecules SH, H2O and CO2 have a similar dependence of the volume averaged abundance. Like the region without FUV irradiation but temperature above K (Section 3), they are more dependent on the opening angle (20-100) and the shape (b1.5 and b2.5) than the FUV enhanced molecules. Quantitatively, however, the dependence of the volume averaged abundance on the physical models differs more between these three species than for the outflow wall enhanced species. This is due to different effects entering the abundances of SH, H2O and CO2, like evaporation combined with a different depth dependence of the photodissociation rates. For example, the larger dependence of CO2 on the opening angle for models 80 and 100 is a result of the concentration of the molecule towards the center combined with the CO2 photodissociation rate dropping faster with extinction compared to H2O and SH. On the other hand, SH is more enhanced in the models 20 and b1.5 due to the factor of 10 larger increase in abundance in the hot-core region. Quantitatively, photodissociated and hot-core enhanced species thus have a more complex dependence on the geometry than FUV enhanced species.
Shocks, which are not accounted for here, may release H2O and CO2 to the gas phase. In a fast J-shock with km s-1 and a density of cm-3, the width of dust grains with temperature above 100 K is of order 700 AU (Hollenbach & McKee 1989). Thus along the outflow walls, H2O and CO2 molecules released by shocks from the grain surface are likely photodissociated (Figure 3 and 4). A detailed modeling of shocks along the outflow walls including the strong protostellar FUV irradiation is warranted.
Of the molecules deemed insensitive to geometry in Section 4.1.2 (H2, H, NH, CO, H3O+, HCO+ and O), the presence of a disk (Figure 5) show significant differences for H, NH, H3O+, HCO+. This is again due to the combination of a lower gas temperature due to the higher density in the disk and subsequently faster recombination rate. The total amount of these molecules thus remains approximately the same as in the model Standard.
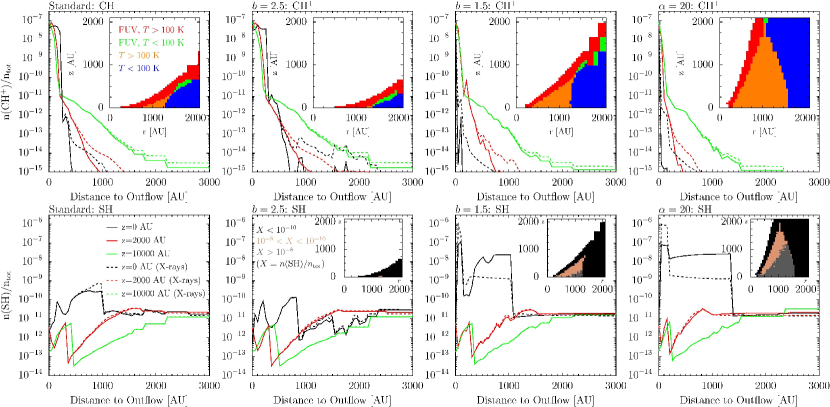
Figure 6 shows the abundance of the FUV enhanced CH+ and the FUV destroyed SH for models Standard, b2.5, b1.5 and 20. In the midplane, the models b1.5 and 20 have a higher abundance of SH by two orders of magnitude, while the outflow wall with enhanced CH+ abundance is much thinner. The region without FUV irradiation but temperature above 100 K is shown in the inset of the upper panel. This region coincides with the region having an SH fractional abundance larger than , shown as inset in the lower panel. The region with fractional abundance larger than shows a layer structure with the molecule being more photodissociated closer to the outflow wall. At larger distances ( and ), the differences between the models are smaller, as found in the previous section for the volume averaged abundances.
The abundances of SH, CH+ and H2O in the Disk model are given in Figure 5. The layer with high temperature and enhanced CH+ abundance (disk atmosphere) is thinner than in the outflow wall models in Figure 6 because of the higher density in the disk surface. Due to the larger density dependence of the SH abundance compared to H2O and CO2, SH does not reach a fractional abundance of as in the models 1.5 and 20. The water abundance on the other hand is even higher in the FUV shielded midplane of the Disk model compared to the outflow wall models. This is also seen in Tables 4 and 5, where the volume averaged abundances of CO2 and H2O are much more enhanced compared to SH.
4.3. X-ray driven chemistry
X-rays affect only the innermost region due to geometrical dilution (Section 3). In Table 3 we thus give the volume averaged abundance within 4000 AU. In the two-dimensional model (Standard), the largest differences between the model for an X-ray luminosity of erg s-1 and no X-rays are found for H with an X-ray enhancement of a factor of 6. The abundances of NH, C and HCO+ are enhanced by a factor of about three. Compared to the spherically symmetric model, C and HCO+ are enhanced on a similar level, while NH is much less enhanced. Destruction of CO2 and water by X-rays has been found in the spherical models of Stäuber et al. (2005) and Stäuber et al. (2006), respectively. Since the abundances of H2O and CO2 are already decreased by FUV radiation, this effect is not seen in the two-dimensional model.
The extra enhancement of diatomic hydrides due to X-rays over FUV processing is much smaller in the two-dimensional models compared to the spherical model. As discussed in Section 4.1.1, the enhancement in the outflow walls by FUV is much larger than by X-rays. Only the volume averaged abundance NH, which is X-ray sensitive but not much enhanced by FUV radiation shows some dependence on X-ray irradiation (Figure 3). However note that NH has high energy levels and thus is more excited in the outflow walls so that the effect of X-rays on the line flux is probably very small. However, a detailed calculation of the line flux should be carried out once collision rates of NH have become available.
The X-ray enhancement/destruction in different models is studied in Table 6 by the ratio of the volume averaged abundance including protostellar X-ray emission ( erg s-1) and no X-rays within 4000 AU. The X-ray enhanced species H, NH and HCO+ are similarly enhanced for the 2D models except for models 80, 100 and Disk where the enhancement in smaller. Models 80 and 100 have less mass with only X-rays but no FUV irradiation (Section 3) and the molecules are photodissociated in the region with X-ray irradiation. In the Disk model, however, these molecules are less FUV dissociated due to the higher density and even enhanced in the warm disk atmosphere. This enhanced layer dominates over the X-ray enhanced region and thus the X-ray enhancement is smaller.
X-ray destruction of H2O and CO2 (see Stäuber et al. 2005, 2006) is remarkable in models which have a larger region with temperature above 100 K but no FUV irradiation (Models Spherical, 20, 40, 0.1 and L4e4). Models with a smaller or similar amount of H2O or CO2 behave similarly to the model Standard, discussed before.
| Model | H | NH | CO2 | H2O | HCO+ | |
|---|---|---|---|---|---|---|
| Spherical | 2.1 | 6.6 | 12 | 0.08 | 0.1 | 4.0 |
| Standard | 1 | 5.6 | 1.8 | 1.0 | 1.6 | 3.5 |
| Disk | 9.1 | 1.8 | 1.1 | 0.7 | 0.7 | 1.1 |
| 20 | 1.8 | 5.9 | 2.8 | 0.01 | 0.1 | 4.1 |
| 40 | 1.5 | 6.0 | 2.2 | 0.03 | 0.4 | 4.4 |
| 80 | 0.64 | 4.2 | 1.2 | 1.5 | 1.3 | 1.7 |
| 100 | 0.36 | 2.6 | 1.0 | 1.9 | 1.0 | 1.0 |
| 0 | 1 | 5.9 | 2.0 | 0.9 | 1.5 | 3.7 |
| 0.01 | 1 | 5.5 | 1.9 | 0.5 | 1.5 | 3.7 |
| 0.1 | 1 | 6.6 | 1.9 | 0.05 | 1.0 | 5.2 |
| b1.5 | 1.3 | 5.3 | 1.6 | 0.03 | 0.4 | 4.0 |
| b2.5 | 0.76 | 5.4 | 1.6 | 1.4 | 2.2 | 2.6 |
| L2e3 | 1 | 6.7 | 2.1 | 2.1 | 1.6 | 3.5 |
| L1e4 | 1 | 5.6 | 1.6 | 1.3 | 1.6 | 3.6 |
| L4e4 | 1 | 5.3 | 2.0 | 0.05 | 1.3 | 3.3 |
We conclude that the influence of X-rays on the chemical composition is relatively small in this scenario of FUV irradiated outflow walls. Molecules predicted to be X-ray tracers (Stäuber et al. 2005) and in particular diatomic hydrides are much more enhanced by FUV radiation compared to X-rays. Exceptions are the water and CO2 destruction by X-rays which is seen in some of the models that are similar to spherical geometry (e.g. small outflow opening angle). Also, HCO+ and H are considerably enhanced for some models. The differences between the models and the uncertainties of the chemical model are however as large as the extra enhancement by X-rays. For example the total amount of HCO+ (obtained from Tables 4, 5 and 6) within 4000 AU is larger for the model 40 without X-rays compared to the model 80 with X-rays. Thus, it is difficult to establish X-ray tracers for these models with very strong FUV irradiation.
In envelopes of low-mass YSOs, however, FUV radiation could be less dominant compared to X-rays. Several effects control the relative importance of FUV and X-rays. The colder photosphere of low-mass YSOs emits less FUV. Bow shocks, internal jet shocks and accretion disk boundary layer can however still produce a considerable FUV field (van Kempen et al. 2009a, c). On the other hand, most commonly observed low-mass YSOs are closer. Since the X-ray luminosity of low-mass YSOs is of similar strengths compared to high-mass YSOs (e.g. Nakajima et al. 2003) the X-ray irradiated gas may fill the beam and thus the influence of X-rays on observable molecular lines becomes stronger. A detailed discussion is warranted. Very high resolution interferometric observations of FUV and X-ray tracer with ALMA will also help to disentangle the effects of FUV and X-ray irradiation. In particular the X-ray tracer NH, discussed before, has a line at 946 GHz within ALMA band 10. High- HCO+ lines (e.g. the line at 892 GHz) which probe the innermost part of the envelope are also within ALMA band 10.
5. Molecular excitation and line fluxes
Observable quantities of the models presented here are molecular or atomic line fluxes. In this section, we study different excitation effects of diatomic hydrides, like collisional or radiative pumping. We use a multi-zone escape probability method described in Appendix B. Herschel observations are then simulated from the excitation calculation. For simplicity, we restrict the discussion to two prototypical diatomic hydrides, one found to be destroyed (SH) and enhanced (CH+) in the outflow wall. Line fluxes of other species will be presented in an further paper together with observations.
Molecular data for the line frequency and Einstein coefficients are obtained from the CDMS (Müller et al. 2001) for CH+ and the JPL database (Pickett et al. 1998) for SH. The molecular collision rates of many diatomic hydrides are poorly known and extrapolation is thus necessary. For SH-H2, we adopt the OH-H2 rates by Offer & van Dishoeck (1992), scaled for the reduced mass. Since collision rates for ortho and para H2 exist, we use a thermal ortho to para ratio222. For CH+-H2 and CH+-H, we scale the CH+-He rates by Hammami et al. (2008) and Hammami et al. (2009). As CH+ is abundant in regions with electron fraction of order , we also consider excitation by electron impact (Lim et al. 1999). A general discussion on the uncertainty of collision rates is given in Schöier et al. (2005).
Transitions observable by Herschel (HIFI/PACS) are summarized in Tables 7 and 8. They give the transition wavelength or frequency (, ), the Einstein-A coefficient , the energy of the upper level . Transitions of CH+ with can be observed by PACS, while the and lines at 835.079 GHz and 1669.170 GHz, respectively, are accessible to HIFI. The SH lines are in HIFI bands, except for the lines at 1383 GHz, which are given for completeness. For SH, only the strongest hyperfine components are used and overlapping components have been combined. The critical density () gives the necessary density of collision partners for substantial population of the upper level.
| [J,F/Parity] | [GHz] | [s-1] | [K] | [cm-3] |
|---|---|---|---|---|
| 866.947 | 1.9(-3) | 571 | 4.3(6) | |
| 875.267 | 1.5(-3) | 572 | 4.7(6) | |
| 1382.910 | 9.4(-3) | 66 | 3.8(7) | |
| 1383.241 | 9.4(-3) | 66 | 4.7(7) | |
| 1447.012 | 1.6(-3) | 641 | 2.6(7) | |
| 1455.100 | 1.6(-3) | 642 | 3.0(7) | |
| 1935.206 | 3.5(-2) | 159 | 1.2(8) | |
| 1935.847 | 3.5(-2) | 159 | 1.4(8) |
| [J] | [m] | [s-1] | [K] | [cm-3] | [cm-3] | [cm-3] |
|---|---|---|---|---|---|---|
| 359.0 | 6.4(-3) | 40 | 5.3(7) | 3.8(7) | 3.0(4) | |
| 179.6 | 6.1(-2) | 120 | 2.5(8) | 1.9(8) | 1.3(5) | |
| 119.9 | 2.2(-1) | 240 | 7.1(8) | 5.2(8) | 3.8(5) | |
| 90.0 | 5.4(-1) | 400 | 1.6(9) | 1.2(9) | 7.8(5) | |
| 72.1 | 1.1(0) | 600 | 3.2(9) | 2.3(9) | 1.7(6) | |
| 60.2 | 1.9(0) | 838 | 5.8(9) | 4.2(9) | 3.0(6) |
We use wavelength (m) for CH+ as most lines are observable with PACS and frequency (GHz) for SH (HIFI). Levels of CH+ are labeled by the rotational quantum number . The molecular structure of SH is similar to hydroxyl (OH) with a electronic ground-state, -type doubling and hyperfine splitting. Levels are thus denoted by , with the total angular momentum , the rotational angular momentum , the nuclear spin and the parity (+/-). The CH+ and SH molecules show typical properties of diatomic hydrides, with high critical densities ( cm-3 for H2 collisions) and large energy separation between subsequent levels. This is due to the large rotation constant combined with a large dipole moment. Line frequencies thus mostly lie above the atmospheric windows. Excitation mechanism other than collisional excitation are likely. For example, pumping by dust continuum radiation or formation in an excited state have been suggested by Black (1998) for CH+.
5.1. Excitation: Level population
The calculated level populations of SH and CH+ at different positions of model Standard are given in Figure 7. For SH, the position in the midplane with peak abundance and at the edge of the cloud are presented. For CH+, we show positions with peak abundances along cuts through the midplane and at AU and AU (Section 4.1). In order to study the importance of different excitation mechanism, we give the normalized level populations depending on the upper level energy for the following models:
-
•
All. Collisional and radiative excitation considered.
-
•
No Dust. Dust radiation switched off by setting the dust opacity to zero. This model allows to study the importance of dust pumping.
-
•
No Radiation. Ambient radiation field switched off (). This model together with the previous allows to study the importance of pumping by line emission.
-
•
No Collisions. Density of the collision partners set to zero. This situation corresponds to pumping purely by dust radiation.
-
•
LTE. Level population in the local thermal equilibrium (LTE) with the gas temperature. This model is given for comparison as the assumption of LTE is often made due to missing collision rates.
-
•
K, K (Only CH+). Collisional excitation, radiative excitation and excited formation considered with formation temperature (Appendix B). We adopt a of order of the kinetic temperature (3000 K) or much lower (100 K).
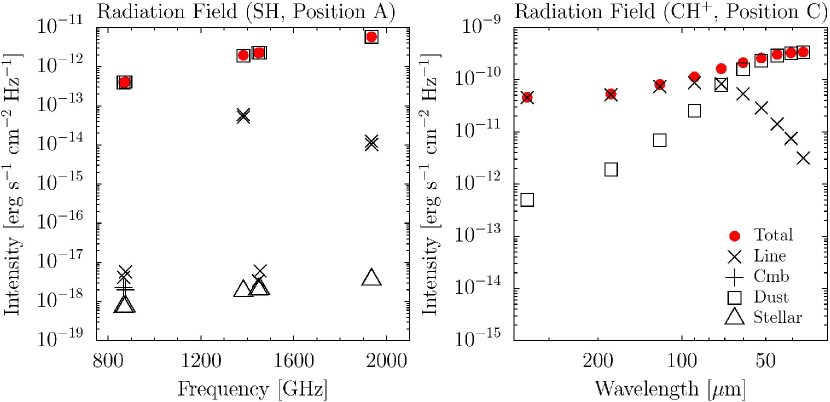
For SH, the population of the hyperfine quadruplet is combined. We note that the level population can only be translated directly to emissivity per volume in the case of optically thin radiation. Figure 8 gives different components (line emission, dust emission, cosmic microwave background and stellar photons) of the ambient radiation field at positions A (SH) and C (CH+).
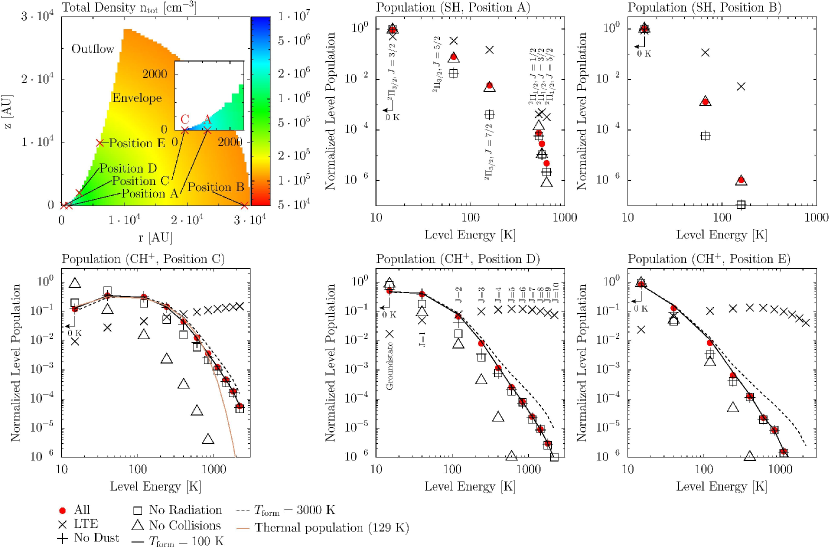
The CH+ level population is far out of LTE. It peaks in the state in position C and the ground state in positions D and E. For all positions, the population rapidly decreases to higher levels and from position C to E for the same level. Collisional excitation (model No Collisions) governs the excitation with increasing differences to model All for higher . A model without electron excitation but collisions with H and H2 has level populations within 20 % to the model All. Electron excitation is thus unimportant relative to other effects. Models No Dust and No Radiation differ less relative to model All in CH+ compared to SH, thus radiation is less important. Unlike SH, the models No Dust and No Radiation differ, due to the contribution of line photons to the ambient radiation field. At position C, line photons dominate the radiation field up to the transition (Figure 8 right). Optical depths of up to (line and dust) for vertical cuts through the outflow wall are reached in the lower transition. For levels connected by these transitions, we find the largest differences between models No Dust and No Radiation. We conclude that CH+ is mainly collisionally excited with small contributions from pumping by line trapping and dust radiation.
The importance of collisions for the excitation of CH+ despite the density of the collision partners below the critical density can be understood by the high kinetic temperature. Radiative transitions connect only levels with due to selection rules. Rates for radiative pumping are proportional to the lower level population of a pumping transition and thus decrease quickly to higher . Collisional excitation is not restricted to and can pump over several levels, especially for high kinetic temperatures, when the upward rates are similar or even higher than the downward rates ().
At position C in the model Standard, the radiative excitation rate decreases from about () to cm-3 s-1 (), for and of order 0.1 s-1 and a CH+ density of 0.4 cm-3. The collisional excitation rates from the most populated levels () to a higher level is found to be about s-1 cm-3 into and slightly less for higher , for rate coefficients of order a few times cm3 s-1 and a density of cm-3. Thus, for , radiative and collisional rates are similar, but collisions dominate for higher . This is in agreement with the findings in the previous paragraphs.
Excited formation affects the level population relatively little with considerable differences only for higher levels at lower densities (position E) and a high formation temperature ( K). At position C, the total formation rate of CH+ is s-1 cm-3, larger than the collisional excitation, but the effect on the level population is small due to the distribution over different levels following the Boltzmann statistic. Due to this distribution, which supports the thermalization to the formation temperature, the influence of excited formation is mostly seen in higher levels for K, where collisional excitation competes less with molecules formed in an excited state.
Observation of the up to of CH+ using the Infrared Space Observatory (ISO) have been reported by Cernicharo et al. (1997) towards the planetary nebula NGC 7027. They can be explained by a single excitation temperature of K for a kinetic temperature of about 300-500 K and densities of a few times cm-3. It is interesting to note that, at position C of our model, the level population up to can be well fitted by a single Boltzmann distribution with a temperature of 129 K. Note that Cernicharo et al. (1997) have used N2H+ collision rates and a slightly higher density. Our calculation thus suggests that the observed line ratio can be explained even with a much higher kinetic temperature as is required for the formation. A more detailed model of their source is however required to draw further conclusions.
The SH level population is out of LTE like CH+. The molecule is however destroyed by FUV radiation and thus abundant in regions with lower temperatures compared to CH+. The level population is thus concentrated in the ground state for both positions A and B. Levels of the ladder with level energy above 500 K are sparsely populated with relative population below . The agreement of the model No Collisions with the model All in the states indicates that these level are pumped by dust radiation. The states on the other hand are connected by lines with lower frequency and thus weaker dust radiation field. These levels are pumped by both collisions and dust radiation.
5.2. Line fluxes
Calculated line fluxes of SH and CH+ for different models are given in Table 9. Synthetic frequency integrated maps and spectra at selected positions for the and lines of the model Standard are shown in Figure 9. Maps and spectra are obtained from the level population discussed in the previous section. Synthetic maps are calculated by integrating the radiative transfer equation. To simulate observations, the maps are convolved with the appropriate Herschel beam, centered on the source and assumed to be a Gaussian. For the raytracing, we assume the same physical parameters as in paper II. These are a distance of 1 kpc, an inclination of and a position angle of the outflow direction of .
| Model | Line Flux | |||||
|---|---|---|---|---|---|---|
| [K km s-1]b | [K km s-1] | [K km s-1] | [K km s-1] | [K km s-1] | [K km s-1] | |
| CH+ | ||||||
| Wavelength [m] | 359.0 | 179.6 | 119.9 | 90.0 | 72.1 | 60.2 |
| Herschel-Beam [”] | 25.8” | 12.9” | 8.6” | 6.5” | 5.2” | 4.3” |
| Standarda | 12.3 | 23.9 | 20.2 | 10.5 | 4.6 | 2.1 |
| Slab at LTEc | 9.8 | 22.5 | 22.4 | 13.6 | 5.3 | 1.6 |
| Standard (2 kpc) | 4.3 | 8.9 | 8.0 | 4.2 | 1.9 | 0.9 |
| Standard (LTE) | 12.0 | 113.1 | 333.0 | 612.3 | 871.9 | 1064.9 |
| Standard ( K) | 14.9 | 26.4 | 21.8 | 11.0 | 4.7 | 2.1 |
| Standard ( K) | 15.8 | 30.8 | 29.4 | 18.1 | 9.7 | 5.4 |
| Standard (0∘) | 14.8 | 29.5 | 26.1 | 14.1 | 6.3 | 3.0 |
| Standard (90∘) | 16.1 | 23.6 | 17.3 | 8.0 | 3.2 | 1.3 |
| Standard (25.8”) | 12.3 | 7.5 | 2.9 | 0.9 | 0.3 | 0.1 |
| Standard (Noturb) | 9.4 | 19.0 | 19.3 | 11.2 | 5.0 | 2.2 |
| Disk | 8.2 | 11.7 | 7.3 | 2.6 | 0.8 | 0.3 |
| 20 | 4.9 | 10.1 | 10.7 | 7.2 | 3.5 | 1.6 |
| 100 | 28.8 | 40.7 | 29.8 | 14.6 | 6.7 | 3.3 |
| SHe | ||||||
| Frequency [GHz] | 866.947 | 1382.910 | 1447.012 | 1455.100 | 1935.206 | 1935.847 |
| Herschel-Beam [”] | 24.9” | 15.6” | 14.9” | 14.8” | 11.1” | 11.1” |
| Standarda | 3.8(-5) | -2.1(-3)d | 4.6(-5) | 5.0(-5) | 5.8(-4) | 4.4(-4) |
| Standard (2 kpc) | 3.2(-6) | -9.7(-4) | 2.1(-6) | 2.4(-6) | 8.7(-5) | 6.1(-5) |
| Standard (LTE) | 8.2(-5) | 3.2(-1) | 8.8(-4) | 8.5(-4) | 9.1(-2) | 9.0(-2) |
| Standard (0∘) | 8.4(-5) | 5.4(-3) | 1.2(-4) | 1.3(-4) | 9.2(-4) | 7.3(-4) |
| Standard (90∘) | 9.9(-6) | -6.1(-2) | 5.7(-6) | 6.6(-6) | -7.9(-4) | -7.6(-4) |
| Disk | 1.8(-5) | -9.9(-4) | 2.4(-5) | 2.6(-5) | 2.8(-3) | 2.3(-3) |
| 20 | 1.6(-4) | -1.5(-1) | 1.8(-4) | 2.0(-4) | 3.8(-2) | 3.0(-2) |
| 100 | 8.2(-5) | 1.7(-3) | 9.8(-5) | 1.1(-4) | 2.8(-4) | 2.1(-4) |
Note: .
aIf no other indication is given, the inclination is 30∘ and the distance 1 kpc (see Appendix B)
bThe conversion factor from K km s-1 to W cm-2 is .
cFit to model Standard for a CH+ column density of cm-2 and K.
dNegative fluxes mean line in absorption.
eSee Table 7 for the exact label of the transition including fine structure.
The predicted CH+ fluxes are remarkably strong, even for higher lines. The integrated intensities correspond to fluxes of order a few times W cm-2 and are easily detectable with PACS or HIFI. Note that they are similar to those reported towards NGC 7027. Strong lines for higher transitions despite the low level population found in the previous section are due to the smaller beam at shorter wavelengths and the emissivity (in K km s-1) per excited molecule , increasing by a factor of 10 from the to the transition. Using a Boltzmann diagram, corrected for line absorption, the model Standard fits well for a column density of cm-2 and an excitation temperature of about 148 K (Slab at LTE).
Different radiative transfer models of CH+ derived from the chemical model Standard have similar fluxes in the line, with deviation smaller than about 30 %. An exception is the model Standard (2 kpc) which assumes a distance of 2 kpc instead of 1 kpc to the source, as suggested by Schneider et al. (2006). For higher transitions, fluxes however differ significantly between the models. Assuming the level population in the LTE (Standard (LTE)) yields fluxes more than two orders of magnitude larger compared to the model Standard. Excited formation increases the line fluxes of all lines by less than 20 % for K. Assuming K, a larger increase is found for higher lines and amounts to a factor of 3 for the line. Inclination affects the line flux by the combination of line and dust opacity, together with the beam containing different parts of the model. For example, the dust opacity reaches about 1.2 for the line, while it is below 0.07 for the line. Thus, the flux of the line in the model Standard (90∘) (edge on) is about a factor of two smaller compared to the model Standard (0∘) with a line of sight parallel to the outflow. Compared to the model Standard, the inclination changes the flux mostly by less than 40 %. We note that for other sources with larger total column density, the dust attenuation may be important even for longer wavelengths. Increasing the distance to 2 kpc finally, decreases the fluxes by a factor of about 2.5.
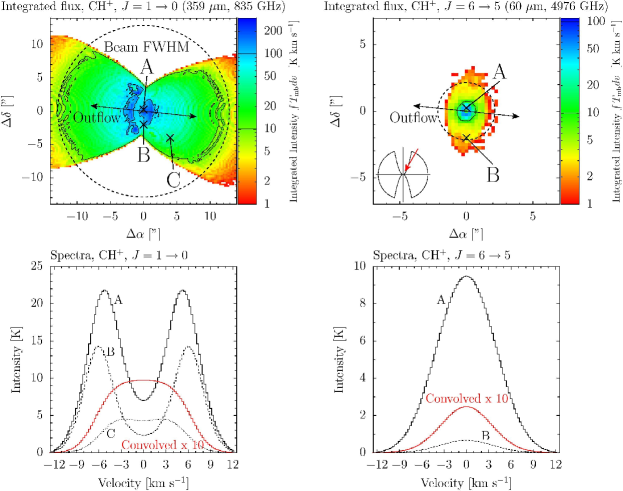
The frequency integrated maps and spectra of model Standard given in Figure 9 show that the concentration of the emission to the innermost region is more pronounced for the line compared to the . This is also reflected in a model (Standard (25.9”)), convolved to a 25.8” beam. The flux ratios of that model to model Standard decreases almost as fast as the beam dilution factor, indicating that most of the emission is within the beam. The profile of the line shows considerable self-absorption in the region where the line of sight follows the outflow wall due to the opening angle being similar to the inclination (positions A and B). The optical depth at the line center at these positions are 7 (A) and 19 (B). Further out, the optical depth is about 3 (C), which is about twice the value found in the Section 5.1 for a ray crossing the outflow wall once. The optical depth is even small for distances larger than position C. The line has much smaller line optical depths below 0.2 (position A) compared to the line. Beam convolved spectra of both lines however, do not show a self-absorption dip, suggesting that most of the emission comes from regions with moderate optical depth.
The considerable line optical depths for lines of sight along the outflow walls raises the question, how much the modeled line fluxes depend on the assumed intrinsic line shape and velocity structure. HIFI can observe the and lines of CH+ spectrally resolved but with a beam corresponding to more than 10000 AU at the assumed distance of 1 kpc. This is insufficient to directly probe the velocity structure along the outflow wall. It can however be used to constrain the average line width along the outflow wall. Spatially resolved interferometric observations reveal broader lines in the outflow wall without much velocity shift to the systemic velocity (Bruderer et al. 2009a). This has been implemented in model Standard (Appendix B). A model without increased microturbulence in the outflow walls (Standard (Noturb)) has been calculated and shows total line fluxes within 20 % to model Standard. We conclude that the while the modeled line shape may depend strongly on the assumed intrinsic line and velocity structure, the line fluxes are pretty independent.
Different chemical models (20, 100 and Disk) affect the line fluxes of CH+ by a combination of the chemical abundance, the temperature and density structure and also the beam containing different regions of the model. For example the total amount of CH+ in the models 20, 100 and Disk within 4000 AU relative to the model Standard are 0.64, 0.36 and 1.04, respectively (Tables 4 and 5). The line fluxes relative to model Standard are thus similar to the abundance ratios for models 20 and Disk in low- lines. For 100, the line is however much stronger due to the larger mass with high temperature (Table 2). For higher lines, the situation is different. The lines of the model Disk get weaker with relative to model Standard, while those of model 20 get stronger. This is due to the fact, that the abundance of CH+ decreases in model Disk in regions with high density, while in the model 20 more material with high density is heated by FUV. We conclude that the low- lines of CH+ are better tracers for the chemical abundance than higher lines, as the higher lines depend more on the temperature structure. The difference between the models is of order of about 3, similar to the uncertainty of the chemical model. Details of the geometry can thus not be obtained solely by observations of diatomic hydrides.
The SH lines are very weak, with most line fluxes clearly below the detection limit. This is remarkable since the volume averaged abundance of SH (Table 3) is only about two orders of magnitude smaller than for CH+. The weak fluxes can be explained by the poor excitation in regions with high abundance of SH, due to the large energy separation of the levels (Section 5.1). Lines of the ladder with upper level energies of several 100 K have line fluxes below K km s-1. Lines between states can reach line fluxes of a few times K km s-1 owing to their level energies similar to the dust or gas temperature in regions where SH is abundant. These lines can also be seen in absorption if a sufficient column density of cold dust lies between the SH emitting region and the observer. Unfortunately, this feature is most prominent in the line at 1383 GHz which cannot be observed by PACS or HIFI.
The abundance of SH within 4000 AU of the models 20, 100 and Disk relative to model Standard are 180, 0.04 and 23 (Tables 4 and 5). This is only reflected in lines of the levels which are excited in larger parts of the envelope compared to the levels. Because of the larger amount of warm material, lines obtained from model 100 can be stronger than from the model Standard despite the lower abundance. We conclude that the excitation in the warm region of the FUV outflow walls is essential for observable lines of diatomic hydrides. Thus, observations or non-detections do not necessarily reflect column densities, due to high critical densities combined with large energy separations between subsequent energy levels.
6. Observing diatomic hydrides with Herschel and ALMA
The previous sections have shown that light diatomic hydrides (CH, NH, SH, OH) and their ions belong to a particular class of molecules that are expected to probe the outflow walls of YSO envelopes. This is due to three factors relating to formation and excitation of the diatomic hydrides: i.) Owing to considerable activation barriers for the formation of many of the diatomic hydrides, a high temperature of several 100 K is needed for their formation. ii.) The chemical network leading to the formation is initiated by photoionization and large FUV fields are required for the formation of diatomic hydrides. iii.) Due to high critical densities and a large energy separation between the molecular levels, a high density and temperature is needed for excitation of the diatomic hydrides.
Protostellar FUV radiation can escape through a low density cavity, etched out by the outflow, and irradiate the outflow walls separating the outflow and envelope. Our work predicts the abundance and excitation of diatomic hydrides in this thin outflow walls to govern the total line flux and result in fluxes that can be easily detected. Diatomic hydrides thus are predicted to be valuable tracers for the chemistry and physics of the outflow walls, which are in many ways similar to the upper atmosphere of protoplanetary disks.
The Herschel Space Observatory provides a unique opportunity to observe diatomic hydrides, as their lines are above atmospheric windows. Beyond the relatively large sample of hydride lines in the HIFI spectral range, which is targeted by the WISH Herschel guaranteed time key program in this source, PACS observations of higher lines may yield important constraints on the hottest regions. A particular example are high- lines of CH+ which are predicted to be detectable by PACS. For this particular source, the relatively large beam of Herschel does not allow to spatially resolve the outflow walls and our model do also not indicate that the predicted line fluxes can be used easily as tracer for the exact shape of the cavity. In other sources with a good balance between distance and affected outflow area (e.g Serpens-FIRS 1), the good spatial resolution of the PACS camera may allow to spatially resolve different transitions of CH+.
The upcoming Atacama Large Millimeter and submillimeter Array (ALMA) can observe diatomic hydrides at very high angular resolution using band 10 receivers (787-950 GHz). For example the line of the isotope is shifted sufficiently to be inside an atmospheric window (Falgarone et al. 2005). Also OH+ at 909 GHz (Wyrowski et al. 2010) and SH+ at 893 GHz (Menten et al. 2010) have been detected from ground. Furthermore, lines of NH (946 GHz) and SH (866 and 875 GHz) are observable with ALMA band 10 receivers. Herschel observations can thus be complemented in the near future with high-resolution interferometric data to constrain parameters like the geometry in the innermost region.
7. Limitations of the model
The scenario of directly irradiated outflow walls by radiation of the protostar is not the only possible to alter the chemical composition in the outflow walls. For example mixing between the warm and ionized outflow with the envelope has been suggested by Taylor & Raga (1995) (see also Raga et al. 2002, 2007). The observed abundance of CO+, however, cannot be explained by mixing solely (paper II). Major dissociative shocks may occur at the boundary layer between outflow and inflow and produce FUV radiation that irradiates the quiescent envelope. To replace the FUV field of direct protostellar radiation with shocks, a rather high shock velocity is required. For example, in the model Standard at AU, km s-1 is required (Neufeld & Dalgarno 1989). Such conditions are clearly met for the bow shock or internal jet working surfaces. Along the outflow walls, however, the velocity perpendicular to the quiescent envelope is likely smaller. In the simple model of the Couette flow solution (e.g. Lizano & Giovanardi 1995) neglecting turbulence, the mean velocity in the entrainment/mixing is along the outflow cavity and depends linearly on the distance to the cavity edge. The width of this layer and the substructure of the velocity including turbulences are however not easily constrained. Observationally, no clear signs of shocks in the outflow walls have been found in interferometric observations of AFGL 2591 by Bruderer et al. (2009a). We conclude that further study of the combined effects of mixing and shocks is warranted, especially in the context of low-mass star formation with less or cooler protostellar FUV radiation.
Several simplifications have been made to make the calculation feasible. As discussed above, the physical structure does not account for shocks and mixing in the outflow layer or a clumpy surface of the outflow wall. The chemical models used here do not consider non-thermal desorption (e.g. photodesorption). The photodesorption yields are not well known for many species. However, the change in abundance at the 100 K evaporation temperature of H2O, CO2 and H2S is small in the presence of a strong FUV field such as in the outflow wall. Thus the photodesorption would not affect the results of the outflow wall enhanced species considerably. The drop of the water abundance in the region with FUV irradiation but temperatures below 100 K would be mitigated by photodesorption. FUV dissociation and ionization processes are treated here in the rate approach which does not allow to specify the protostellar radiation field explicitly. The surface temperature of the protostar is however not well constrained by observations and would affect the chemistry if the temperature were not hot enough to dissociate CO (Spaans et al. 1995). The models do not account for vibrationally excited H2 (e.g. Sternberg & Dalgarno 1995) which may help to overcome the activation barrier and further increase the abundance of e.g. CH+ or OH. Grain surface reactions, except for H2 formation and charge exchange with grains, are not considered in the models. For species with longer chemical timescales (chemical clocks, e.g. many sulfur bearing species, Wakelam et al. 2004) the effects of infall must be taken into account.
8. Conclusions and outlook
We have used a detailed chemical model of the high-mass star-forming region AFGL 2591 to study the effect of different shapes of a concave low-density cavity on the chemistry. The cavity, etched out by the outflow, allows FUV radiation to escape the innermost region and irradiate the walls between outflow and envelope. We study especially those molecules that are newly observable with the HIFI/PACS instrument onboard Herschel and in particular light diatomic hydrides (CH, NH, SH, OH). The model used in this work is based on the two-dimensional axisymmetric chemical model introduced in Bruderer et al. (2009b), extended by a self-consistent calculation of the dust temperature and an escape probability method to calculate the molecular excitation. The model considers protostellar FUV and X-ray irradiation and makes use of the grid of chemical models presented in Bruderer et al. (2009c). The main conclusions of the work are:
-
1.
Protostellar FUV radiation can enhance the abundance of light diatomic hydrides and their ions by photoionization/dissociation processes and heating in the outflow-walls considerably. The overall amount of CH+, OH+ and NH+ in the envelope is orders of magnitude larger than in spherically symmetric geometry (Section 4). Similarly enhanced are C+ and H2O+. These species thus appear to be clear tracers of extended FUV irradiation and thus the geometric structure of the inner regions of YSOs.
-
2.
Depending whether the vertical height of the envelope from the midplane to the outflow (geometrically thin or thick), the size and mass of the infrared heated hot-core region with temperature above 100 K, but no FUV irradiation, can change substantially (Section 3). Geometrically thin inner regions allows FUV radiation to penetrate to the midplane and destroy the bulk of important species such as CO2 and H2O. The shape of the cavity is thus also important for species which are destroyed by FUV radiation (Section 3.4 and 4.2).
-
3.
Provided that FUV radiation can escape the innermost region, the effects of different geometries (opening angle of the outflow, cavity shape, density in the cavity) on the total amount of species enhanced in the outflow-wall (CH, CH+, OH+, NH+, C+ and H2O+) are relatively small. Deviations are typically less than a factor of three (Section 4.2).
-
4.
In outflow walls, the influence of protostellar X-ray irradiation on the chemistry and in particular on the diatomic hydrides is relatively small with respect to the much larger enhancement by FUV radiation (Section 4.3).
-
5.
The large separation between the energy levels of diatomic hydrides requires a hot and dense gas for excitation. Thus, the line fluxes of CH+, predicted to be enhanced in the hot outflow wall, reach fluxes of several K km s-1 even in the line. On the other hand, SH, is predicted to be destroyed in the outflow wall, but to be abundant in the envelope. Thus, despite the volume averaged abundance of SH being only two orders of magnitude lower than for CH+, it is not sufficiently excited in the cool envelope to be detectable (Section 5.1 and 5.2).
- 6.
This suggests that diatomic hydrides are important tracers of warm and FUV irradiated material. Diatomic hydrides are chemically closely related to important species like water. Studying diatomic hydrides will provide important insight in the chemistry of YSO envelopes. Not only the chemistry of the diatomic hydrides is interesting, as they may ultimately also be used a tracers for physical conditions (like the FUV radiation). Herschel will for the first time observe diatomic hydrides with a good sensitivity and angular resolution and making these tracers available. ALMA and in particular band 10 will allow to continue the study of diatomic hydrides at very high angular resolution. Since diatomic hydrides have not been studied thoroughly in the past, much molecular data and in particular collisional excitation rates are missing. More studies on these processes will be necessary in order to analyse Herschel observations.
In this series of papers (Bruderer et al. 2009c, b and this work), we have introduced a fast method for chemical modeling of envelopes of young stellar objects and studying the molecular excitation. The numerical speed up allows to construct more detailed models including multidimensional geometries. The method will also facilitate the study of larger samples of observations as they will soon be available by new facilities with high sensitivity and larger spectral coverage as for example the upcoming Atacama Large Millimeter/submillimeter Array. Ultimately, extensions of the methods presented here may also be useful to study the chemical/physical evolution of protoplanetary disks.
Appendix A Dust Radiative Transfer
The dust temperature in steady state condition is obtained by equating the total dust emission (erg s-1 g-1) with the total absorption (erg s-1 g-1). Dust may absorb either stellar photons or ambient emission by dust. Assuming a single dust temperature , we can write the energy balance at one position of the envelope as
| (A1) |
with (cm2 g-1) the dust absorption opacity per mass, (erg s-1 cm-2 m-1 sr-1) the intensity depending on the direction and wavelength and the Planck function. To solve this coupled problem, we implement the Monte Carlo approach presented by Bjorkman & Wood (2001). The results of the new code have been verified with the benchmark tests suggested by Ivezic et al. (1997) and Stamatellos & Whitworth (2003) and also by comparing the results with the DUSTY code (Ivezic & Elitzur 1997; Nenkova et al. 1999).
For the models of AFGL 2591, we adopt the dust opacities by Ossenkopf & Henning (1994) (column 5). This dust opacities have been found to explain the observation of AFGL 2591 well and yield a “standard” dust to molecule mass ratio of about 100 (van der Tak et al. 1999). For the calculation of the FUV intensity, the dust opacities are extended to shorter wavelengths (m) with the absorption and scattering properties by Draine (2003), available on his web-page (similar to paper II). An example of calculated dust temperature is given in Figure 10 for the model used in paper II. The figure also shows the calculation domain which consists of 5 nested grids.
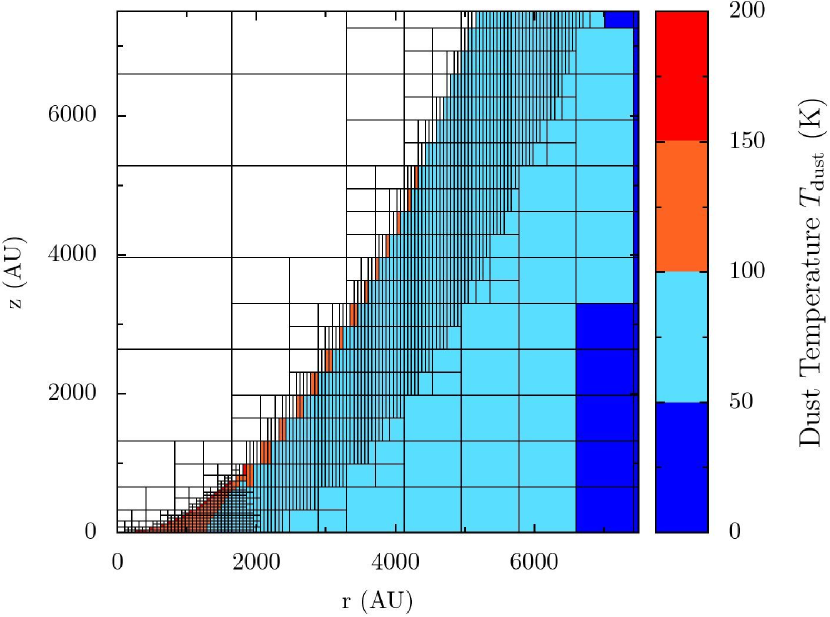
The dust radiative transfer code also calculates the local mean intensity of scattered and attenuated stellar photons with a Monte Carlo method similar to van Zadelhoff et al. (2003). The analytical expression for the photodissociation and ionization rates (e.g. van Dishoeck 1988) implemented in paper I require the calculation of the unattenuated FUV flux [ISRF] and the visual extinction . We estimate these quantities by the mean intensities at both edges of the FUV band (6 and 13.6 eV) and at 1 micron. We have tested the approach by comparing photoionization and dissociation rates obtained from the fit and calculated by the FUV cross sections of van Dishoeck et al. (2006)333www.strw.leidenuniv.nl/~ewine/photo. We find agreement within a factor of two in the chemically relevant range of attenuation (). This is reasonable provided that we do not implement the same dust properties and spectral shape of the emitting spectra (see Section 7 for a discussion of the spectral shape). The FUV calculation is also tested against the results in paper II. We find good agreement, for example the mass and volume of material irradiated with an attenuated flux larger than 1 ISRF agree to within 30 %.
Appendix B Molecular Excitation Analysis
For the calculation of the level population of SH and CH+, a multi-zone escape probability method is used. This appendix briefly discusses the method. Further details and the code will be published elsewhere.
The excitation of a molecule or atom (i.e. the population of different energy levels) is controlled by collisional and radiative processes. The species can be excited or deexcited by collisions with H2, H and electrons or by radiation either from the dust continuum or molecular emission from the same or other molecules. The population (cm-3) of level at one position is described by the rate equations (e.g. van der Tak et al. 2007)
| (B1) |
where is the number of levels considered, (cm-3 s-1) and (s-1) are the chemical formation and destruction rates and (s-1) is given by
| (B2) |
Here, (s-1) and (erg-1 cm2 Hz) are the Einstein coefficients for spontaneous and induced emission, respectively. The collisional excitation and deexcitation rates (s-1) are obtained from the sum of for different collision partners, with the density of the collision partners and the collision rate coefficients (cm3 s-1) at a kinetic temperature . The level population is assumed to be constant with time and thus in Eq. B1.
The level distribution at formation may govern the level population if a molecule is destroyed in collisions rather than excited, like CH+ in collisions with H, H2 or electrons. We take the effects of excited formation and destruction into account by the terms and in Eq. B1. Due to the short chemical time-scales, we assume the abundance to be constant. At formation, we assume the level population to follow a Boltzmann distribution with temperature (Stäuber & Bruderer 2009; van der Tak et al. 2007). The destruction is assumed to be independent of levels. Hence,
| (B3) | |||||
with the partition function , the statistical weight of a level with energy . For the calculation of the destruction rate , we take reactions with H, H2 and electrons into account. Thus , with the reaction rate coefficients , and . In this approach, the formation temperature remains a free parameter.
Since the level populations at different positions of a model are coupled by the radiation field, the solution of a radiative transfer problems can be very time-consuming, especially in multi-dimensional geometries or for molecules with high optical depth like water. We thus use the escape probability approach including continuum emission and absorption presented by Takahashi et al. (1983) and approximate the ambient radiation by
| (B4) | |||||
with the line frequency and the Planck functions for the excitation temperature , the temperature of the dust and the cosmic microwave background . The escape probabilities and give the probability for a photon to escape line absorption () or to escape both line and dust absorption (). They are calculated using Eq. 3.11 - 3.13 given in Takahashi et al. (1983). The necessary optical depth of dust and lines is obtained from the summation along different rays for different frequencies.
This approach couples different cells and the problem is solved iteratively, similar to one-zone escape probability codes (e.g. RADEX, van der Tak et al. 2007). To improve convergence, we use an ALI-like acceleration mechanism (e.g. Rybicki & Hummer 1991 or Hogerheijde & van der Tak 2000). To test the code, we have run several benchmark problems, e.g. van der Tak et al. (2005), with results typically within 30 % to the exact solution. A similar method has also been successfully used by Poelman & Spaans (2005).
The velocity field and the intrinsic line width enter the excitation calculation by the ambient molecular radiation field. These parameters are however only important for optically thick lines and the line shape. Optically thin lines are only little affected. The predicted velocity field by Doty et al. (2006) (after McLaughlin & Pudritz 1997) for young chemical ages of less than a few times yrs is approximately static outside a few 1000 AU and we thus assume a static situation. The line width mainly due to microturbulence is assumed to be 1.6 km s-1 (Doppler parameter, e.g. Stäuber et al. 2007) except in the outflow wall, where a larger line width of 4.2 km s-1 is assumed as indicated by interferometric observations (Bruderer et al. 2009b).
References
- Arce & Sargent (2006) Arce, H. G. & Sargent, A. I. 2006, ApJ, 646, 1070
- Bergin (2009) Bergin, E. A. 2009, in Physical Processes in Circumstellar Disks Around Young Stars, ed. P. Garcia, (University of Chicago Press: Chicago)
- Bjorkman & Wood (2001) Bjorkman, J. E. & Wood, K. 2001, ApJ, 554, 615
- Black (1998) Black, J. H. 1998, in Chemistry and Physics of Molecules and Grains in Space. Faraday Discussions No. 109, 257
- Brinch et al. (2008) Brinch, C., van Weeren, R. J., & Hogerheijde, M. R. 2008, A&A, 489, 617
- Bruderer et al. (2009a) Bruderer, S., Benz, A. O., Bourke, T. L., & Doty, S. D. 2009a, A&A, 503, L13
- Bruderer et al. (2009b) Bruderer, S., Benz, A. O., Doty, S. D., van Dishoeck, E. F., & Bourke, T. L. 2009b, ApJ, 700, 872
- Bruderer et al. (2009c) Bruderer, S., Doty, S. D., & Benz, A. O. 2009c, ApJS, 183, 179
- Carkner et al. (1998) Carkner, L., Kozak, J. A., & Feigelson, E. D. 1998, AJ, 116, 1933
- Cernicharo et al. (2010) Cernicharo, J., Decin, L., Barlow, M. J., Agundez, M., Royer, P., Vandenbussche, B., Wesson, R., Polehampton, E. T., De Beck, E., Blommaert, J. A. D. L., Daniel, F., De Meester, W., Exter, K. M., Feuchtgruber, H., Gear, W. K., Goicoechea, J. R., Gomez, H. L., Groenewegen, M. A. T., Hargrave, P. C., Huygen, R., Imhof, P., Ivison, R. J., Jean, C., Kerschbaum, F., Leeks, S. J., Lim, T. L., Matsuura, M., Olofsson, G., Posch, T., Regibo, S., Savini, G., Sibthorpe, B., Swinyard, B. M., Vandenbussche, B., & Waelkens, C. 2010, ArXiv e-prints
- Cernicharo et al. (1997) Cernicharo, J., Liu, X., Gonzalez-Alfonso, E., Cox, P., Barlow, M. J., Lim, T., & Swinyard, B. M. 1997, ApJ, 483, L65
- Crimier et al. (2010) Crimier, N., Ceccarelli, C., Maret, S., Bottinelli, S., Caux, E., Kahane, C., Lis, D. C., & Olofsson, J. 2010, ArXiv e-prints
- de Wit et al. (2009) de Wit, W. J., Hoare, M. G., Fujiyoshi, T., Oudmaijer, R. D., Honda, M., Kataza, H., Miyata, T., Okamoto, Y. K., Onaka, T., Sako, S., & Yamashita, T. 2009, A&A, 494, 157
- Doty et al. (2004) Doty, S. D., Schöier, F. L., & van Dishoeck, E. F. 2004, A&A, 418, 1021
- Doty et al. (2006) Doty, S. D., van Dishoeck, E. F., & Tan, J. C. 2006, A&A, 454, L5
- Doty et al. (2002) Doty, S. D., van Dishoeck, E. F., van der Tak, F. F. S., & Boonman, A. M. S. 2002, A&A, 389, 446
- Draine (2003) Draine, B. T. 2003, ARA&A, 41, 241
- Falgarone et al. (2005) Falgarone, E., Phillips, T. G., & Pearson, J. C. 2005, ApJ, 634, L149
- Fischer et al. (1996) Fischer, O., Henning, T., & Yorke, H. W. 1996, A&A, 308, 863
- Flower et al. (1996) Flower, D. R., Pineau des Forets, G., Field, D., & May, P. W. 1996, MNRAS, 280, 447
- Hammami et al. (2008) Hammami, K., Owono, L. O., Jaidane, N., & Lakhdar, Z. B. 2008, Journal of Molecular Structure: THEOCHEM, 853, 18
- Hammami et al. (2009) Hammami, K., Owono Owono, L. C., & Stäuber, P. 2009, A&A, 507, 1083
- Hasegawa & Herbst (1993) Hasegawa, T. I. & Herbst, E. 1993, MNRAS, 261, 83
- Hogerheijde & van der Tak (2000) Hogerheijde, M. R. & van der Tak, F. F. S. 2000, A&A, 362, 697
- Hogerheijde et al. (1998) Hogerheijde, M. R., van Dishoeck, E. F., Blake, G. A., & van Langevelde, H. J. 1998, ApJ, 502, 315
- Hogerheijde et al. (1999) Hogerheijde, M. R., van Dishoeck, E. F., Salverda, J. M., & Blake, G. A. 1999, ApJ, 513, 350
- Hollenbach & McKee (1989) Hollenbach, D. & McKee, C. F. 1989, ApJ, 342, 306
- Hollenbach & Tielens (1999) Hollenbach, D. J. & Tielens, A. G. G. M. 1999, Reviews of Modern Physics, 71, 173
- Indriolo et al. (2007) Indriolo, N., Geballe, T. R., Oka, T., & McCall, B. J. 2007, ApJ, 671, 1736
- Ivezic & Elitzur (1997) Ivezic, Z. & Elitzur, M. 1997, MNRAS, 287, 799
- Ivezic et al. (1997) Ivezic, Z., Groenewegen, M. A. T., Men’shchikov, A., & Szczerba, R. 1997, MNRAS, 291, 121
- Jørgensen (2004) Jørgensen, J. K. 2004, A&A, 424, 589
- Jørgensen et al. (2007) Jørgensen, J. K., Bourke, T. L., Myers, P. C., Di Francesco, J., van Dishoeck, E. F., Lee, C.-F., Ohashi, N., Schöier, F. L., Takakuwa, S., Wilner, D. J., & Zhang, Q. 2007, ApJ, 659, 479
- Jørgensen et al. (2006) Jørgensen, J. K., Johnstone, D., van Dishoeck, E. F., & Doty, S. D. 2006, A&A, 449, 609
- Jørgensen et al. (2005) Jørgensen, J. K., Lahuis, F., Schöier, F. L., van Dishoeck, E. F., Blake, G. A., Boogert, A. C. A., Dullemond, C. P., Evans, II, N. J., Kessler-Silacci, J. E., & Pontoppidan, K. M. 2005, ApJ, 631, L77
- Kaufman et al. (1999) Kaufman, M. J., Wolfire, M. G., Hollenbach, D. J., & Luhman, M. L. 1999, ApJ, 527, 795
- Lim et al. (1999) Lim, A. J., Rabadán, I., & Tennyson, J. 1999, MNRAS, 306, 473
- Lizano & Giovanardi (1995) Lizano, S. & Giovanardi, C. 1995, ApJ, 447, 742
- Maloney et al. (1996) Maloney, P. R., Hollenbach, D. J., & Tielens, A. G. G. M. 1996, ApJ, 466, 561
- McLaughlin & Pudritz (1997) McLaughlin, D. E. & Pudritz, R. E. 1997, ApJ, 476, 750
- Meijerink & Spaans (2005) Meijerink, R. & Spaans, M. 2005, A&A, 436, 397
- Meijerink et al. (2007) Meijerink, R., Spaans, M., & Israel, F. P. 2007, A&A, 461, 793
- Menten et al. (2010) Menten, K., Wyrowski, F., Belloche, A., et al. 2010, A&A, in press
- Müller et al. (2001) Müller, H. S. P., Thorwirth, S., Roth, D. A., & Winnewisser, G. 2001, A&A, 370, L49
- Nakajima et al. (2003) Nakajima, H., Imanishi, K., Takagi, S., Koyama, K., & Tsujimoto, M. 2003, PASJ, 55, 635
- Nenkova et al. (1999) Nenkova, M., Ivezic, Z., & Elitzur, M. 1999, LPI Contributions, 969, 20
- Neufeld & Dalgarno (1989) Neufeld, D. A. & Dalgarno, A. 1989, ApJ, 340, 869
- Neufeld et al. (2010) Neufeld, D. A., Sonnentrucker, P., Phillips, T. G., Lis, D. C., De Luca, M., Goicoechea, J. R., Black, J. H., Gerin, M., Bell, T., Boulanger, F., Cernicharo, J., Coutens, A., Dartois, E., Kazmierczak, M., Encrenaz, P., Falgarone, E., Geballe, T. R., Giesen, T., Godard, B., Goldsmith, P. F., Gry, C., Gupta, H., Hennebelle, P., Herbst, E., Hily-Blant, P., Joblin, C., Kolos, R., Krelowski, J., Martin-Pintado, J., Menten, K. M., Monje, R., Mookerjea, B., Pearson, J., Perault, M., Persson, C., Plume, R., Salez, M., Schlemmer, S., Schmidt, M., Stutzki, J., Teyssier, D., Vastel, C., Yu, S., Cais, P., Caux, E., Liseau, R., Morris, P., & Planesas, P. 2010, ArXiv e-prints
- Neufeld & Wolfire (2009) Neufeld, D. A. & Wolfire, M. G. 2009, ApJ, 706, 1594
- Offer & van Dishoeck (1992) Offer, A. R. & van Dishoeck, E. F. 1992, MNRAS, 257, 377
- Ossenkopf & Henning (1994) Ossenkopf, V. & Henning, T. 1994, A&A, 291, 943
- Pickett et al. (1998) Pickett, H. M., Poynter, I. R. L., Cohen, E. A., Delitsky, M. L., Pearson, J. C., & Muller, H. S. P. 1998, Journal of Quantitative Spectroscopy and Radiative Transfer, 60, 883
- Poelman & Spaans (2005) Poelman, D. R. & Spaans, M. 2005, A&A, 440, 559
- Preibisch et al. (2003) Preibisch, T., Balega, Y. Y., Schertl, D., & Weigelt, G. 2003, A&A, 412, 735
- Raga et al. (2007) Raga, A. C., de Colle, F., Kajdič, P., Esquivel, A., & Cantó, J. 2007, A&A, 465, 879
- Raga et al. (2002) Raga, A. C., Noriega-Crespo, A., & Velázquez, P. F. 2002, ApJ, 576, L149
- Rawlings et al. (2004) Rawlings, J. M. C., Redman, M. P., Keto, E., & Williams, D. A. 2004, MNRAS, 351, 1054
- Rybicki & Hummer (1991) Rybicki, G. B. & Hummer, D. G. 1991, A&A, 245, 171
- Savage & Ziurys (2004) Savage, C. & Ziurys, L. M. 2004, ApJ, 616, 966
- Schneider et al. (2006) Schneider, N., Bontemps, S., Simon, R., Jakob, H., Motte, F., Miller, M., Kramer, C., & Stutzki, J. 2006, A&A, 458, 855
- Schöier et al. (2005) Schöier, F. L., van der Tak, F. F. S., van Dishoeck, E. F., & Black, J. H. 2005, A&A, 432, 369
- Spaans et al. (1995) Spaans, M., Hogerheijde, M. R., Mundy, L. G., & van Dishoeck, E. F. 1995, ApJ, 455, L167
- Stamatellos & Whitworth (2003) Stamatellos, D. & Whitworth, A. P. 2003, A&A, 407, 941
- Stäuber et al. (2007) Stäuber, P., Benz, A. O., Jørgensen, J. K., van Dishoeck, E. F., Doty, S. D., & van der Tak, F. F. S. 2007, A&A, 466, 977
- Stäuber & Bruderer (2009) Stäuber, P. & Bruderer, S. 2009, A&A, 505, 195
- Stäuber et al. (2005) Stäuber, P., Doty, S. D., van Dishoeck, E. F., & Benz, A. O. 2005, A&A, 440, 949
- Stäuber et al. (2004) Stäuber, P., Doty, S. D., van Dishoeck, E. F., Jørgensen, J. K., & Benz, A. O. 2004, A&A, 425, 577
- Stäuber et al. (2006) Stäuber, P., Jørgensen, J. K., van Dishoeck, E. F., Doty, S. D., & Benz, A. O. 2006, A&A, 453, 555
- Sternberg & Dalgarno (1995) Sternberg, A. & Dalgarno, A. 1995, ApJS, 99, 565
- Takahashi et al. (1983) Takahashi, T., Silk, J., & Hollenbach, D. J. 1983, ApJ, 275, 145
- Taylor & Raga (1995) Taylor, S. D. & Raga, A. C. 1995, A&A, 296, 823
- van der Tak et al. (2005) van der Tak, F., Neufeld, D., Yates, J., Hogerheijde, M., Bergin, E., Schöier, F., & Doty, S. 2005, in ESA Special Publication, Vol. 577, ESA Special Publication, ed. A. Wilson, 431–432
- van der Tak et al. (2007) van der Tak, F. F. S., Black, J. H., Schöier, F. L., Jansen, D. J., & van Dishoeck, E. F. 2007, A&A, 468, 627
- van der Tak & van Dishoeck (2000) van der Tak, F. F. S. & van Dishoeck, E. F. 2000, A&A, 358, L79
- van der Tak et al. (1999) van der Tak, F. F. S., van Dishoeck, E. F., Evans, II, N. J., Bakker, E. J., & Blake, G. A. 1999, ApJ, 522, 991
- van der Tak et al. (2000) van der Tak, F. F. S., van Dishoeck, E. F., Evans, II, N. J., & Blake, G. A. 2000, ApJ, 537, 283
- van der Tak et al. (2006) van der Tak, F. F. S., Walmsley, C. M., Herpin, F., & Ceccarelli, C. 2006, A&A, 447, 1011
- van Dishoeck (1988) van Dishoeck, E. F. 1988, in Rate Coefficients in Astrochemistry. Editors, T.J. Millar, D.A. Williams, Kluwer Academic Publishers, Dordrecht, ed. T. J. Millar & D. A. Williams, 49
- van Dishoeck et al. (2006) van Dishoeck, E. F., Jonkheid, B., & van Hemert, M. C. 2006, in Chemical Evolution of the Universe. Faraday Discussions No. 133, 231
- van Kempen et al. (2008) van Kempen, T. A., Doty, S. D., van Dishoeck, E. F., Hogerheijde, M. R., & Jørgensen, J. K. 2008, A&A, 487, 975
- van Kempen et al. (2009a) van Kempen, T. A., van Dishoeck, E. F., Güsten, R., Kristensen, L. E., Schilke, P., Hogerheijde, M. R., Boland, W., Menten, K. M., & Wyrowski, F. 2009a, A&A, 507, 1425
- van Kempen et al. (2009b) van Kempen, T. A., van Dishoeck, E. F., Güsten, R., Kristensen, L. E., Schilke, P., Hogerheijde, M. R., Boland, W., Nefs, B., Menten, K. M., Baryshev, A., & Wyrowski, F. 2009b, A&A, 501, 633
- van Kempen et al. (2009c) van Kempen, T. A., Wilner, D., & Gurwell, M. 2009c, ApJ, 706, L22
- van Zadelhoff et al. (2003) van Zadelhoff, G.-J., Aikawa, Y., Hogerheijde, M. R., & van Dishoeck, E. F. 2003, A&A, 397, 789
- Visser et al. (2009) Visser, R., van Dishoeck, E. F., Doty, S. D., & Dullemond, C. P. 2009, A&A, 495, 881
- Viti & Williams (1999) Viti, S. & Williams, D. A. 1999, MNRAS, 305, 755
- Wakelam et al. (2004) Wakelam, V., Caselli, P., Ceccarelli, C., Herbst, E., & Castets, A. 2004, A&A, 422, 159
- Wyrowski et al. (2010) Wyrowski, F., Menten, K. M., Guesten, R., & Belloche, A. 2010, A&A, accepted