Radio sources with ultrahigh polarization
Abstract
A sample of 129 unresolved radio sources with ultrahigh linear polarization ( per cent) has been selected from the NRAO VLA Sky Survey. Such high average linear polarization is unusual in extragalactic sources. Higher resolution Australia Telescope Compact Array and Very Large Array observations confirm the high average polarization but find that most of these sources are extended. The Sloan Digital Sky Survey spectroscopy, where available, shows that the optical counterparts are elliptical galaxies with no detectable emission lines. The optical spectra, radio luminosity, linear size and spectral index of these sources are typical of radio-loud active galactic nuclei. Galaxy counts within a 1 Mpc radius of the radio sources show that these highly polarized sources are in environments similar to their low polarization ( per cent) counterparts. Similarly, the line-of-sight environments of the ultrahigh polarization sources are on average indistinguishable from those of the low-polarization sources. We conclude that the extraordinarily high average polarization must be due to intrinsic properties of the sources, such as an extremely ordered source magnetic field, low internal thermal plasma density or a preferential orientation of the source magnetic field perpendicular to the line of sight.
keywords:
polarization – pulsars: general – galaxies: magnetic field – radio continuum: galaxies1 Introduction
Polarized radio emission is an important astrophysical diagnostic of the physical conditions in radio sources. Synchrotron radiation is the mechanism responsible for the radio emission from extragalactic sources. In a uniform magnetic field, the fractional linear polarization of synchrotron radiation is given by
| (1) |
where is the linear polarization flux density, and are the Stokes flux densities corresponding to the two orthogonal components of linear polarization, is the Stokes integrated flux density and is the spectral index defined by . Hence, synchrotron radiation is intrinsically linearly polarized at 60 to 80 per cent for spectral indices in the range of to . However, owing to depolarization effects, most extragalactic radio sources are observed to have only a few per cent net linear polarization across the entire source and rarely have percentage linear polarization per cent even on the smallest angular scales (Saikia & Salter 1988; Kronberg 1994). The frequency-independent depolarization effects are mainly due to the tangling of the magnetic field on scales smaller than the size of the observing beam. The frequency-dependent depolarization effects are mainly caused by Faraday rotation. Faraday rotation, either within the synchrotron emitting region or in any magnetoionic media along the line of sight, can cause depolarization (e.g. Burn 1966; Ruzmaikin, Sokoloff & Shukurov 1988; Sokoloff et al. 1998; Fletcher et al. 2004). Faraday depth is defined as
| (2) |
where is the electron density in cm-3, is the line-of-sight component of the magnetic field strength in G and is the path length along the line of sight (Burn 1966). The rotation measure is the observed Faraday depth, defined as the slope of the polarization position angle versus :
| (3) |
where
| (4) |
and is the intrinsic polarization position angle. Internal Faraday rotation occurs when the radio-emitting plasma is mixed with thermal plasma. Internal Faraday rotation always causes depolarization, even if the magnetic field is ordered and the thermal plasma is uniform. A foreground thermal plasma that has an ordered magnetic field and uniform electron density can cause Faraday rotation but not depolarization. In the absence of internal Faraday rotation and beam depolarization, the Faraday depth towards a source is equal to its rotation measure.
Depolarization in general increases at lower resolution, wider observing bandwidth and longer wavelength. An understanding of the polarization/depolarization properties of radio sources has important implications for the study of the evolution of radio galaxy and quasar environments (Goodlet & Kaiser 2005; Bernet et al. 2008). Very little is known about the origin and growth of magnetic fields in galaxies and clusters of galaxies. Recently, magnetic fields have been detected for the first time in galaxies (Bernet et al. 2008; Wolfe et al. 2008).


A first indication of the existence of ultrahigh average polarization radio sources came from a study of the radio properties of the Bullet cluster (1E065756; Liang et al. 2000). Liang et al. (2001), serendipitously, found a peculiar, extended (15 arcsec 4.5 arcsec), ultra-steep spectrum () radio source J0658.75559. In projection, it lies 2 arcmin from the cluster centre and was found with an average percentage linear polarization of per cent at 8.8 GHz. Such a high average linear polarization is extremely unusual for radio sources. While the nature of this peculiar source is still an open question, it is almost certainly extragalactic (Liang et al. 2001). The only radio sources known to have such high fractional polarization are pulsars, which are point sources, unlike J0658.75559, which is extended. Pulsar astronomers have used this unique property to search for pulsars (e.g. Crawford et al. 2000; Han et al. 2004). The polarization properties of radio sources were summarised by Han & Tian (1999), where the distribution of the fractional linear polarization of known extragalactic sources, such as radio galaxies, quasars and BL Lac objects, were compared with those of known pulsars identified in the NRAO VLA Sky Survey (NVSS). The average linear polarization of extragalactic radio sources rarely exceeds 25 per cent, whereas per cent of pulsars have linear polarization per cent (fig. 2 in Han & Tian 1999).
The NVSS (Condon et al. 1998) mapped 82 per cent of the celestial sphere at 1.4 GHz and detected million radio sources with flux densities greater than 2.5 mJy. It is the first large survey with full polarization information. A sample of unresolved radio sources was originally selected from the NVSS with percentage linear polarization greater than 30 per cent to search for new pulsars. However, follow-up observations of these sources with Parkes and Jodrell Bank telescopes failed to find any new pulsars (Han et al. 2004). Subsequent observations found that most of the sources were extended and extragalactic.
This paper reports the existence of a subset of extragalactic radio sources with extremely high average linear polarization and explores the nature of these radio sources. Details of sample selection are given in Section 2. Section 3 gives the high resolution polarization measurements with the Very Large Array (VLA) and Australia Telescope Compact Array (ATCA) to confirm the high linear polarization results from the NVSS. Optical identification, radio luminosity, linear size and spectral index measurements are described in Sections 4, 5 and 6. Section 7 discusses the nature of these highly polarized radio sources. The conclusions are given in Section 8.
Cosmological parameters of , and km s-1 Mpc-1 are assumed throughout this paper. Unless otherwise stated, all errors quoted are 1.

2 Sample selection
An all-sky sample of ultrahigh polarization radio sources is selected from the NVSS through the following criteria:
-
1.
Unresolved sources;
-
2.
Total flux density ;
-
3.
Percentage linear polarization ;
-
4.
Percentage linear polarization per cent.
The NVSS has a full width at half-maximum (FWHM) beam size of 45 arcsec. Elliptical Gaussians were fitted to sources to produce the NVSS catalogue. In cases where the source is unresolved, the catalogue lists the 98 per cent confidence upper limit to the source size. We select only those unresolved NVSS sources (marked by ‘’ for both the deconvolved major and minor axes in the NVSS catalogue) that do not have a large residual after the Gaussian fit (i.e. those not marked by ‘P*’ and ‘S*’ in the NVSS catalogue). For the NVSS, the average rms noise in a Stokes image is mJy beam-1 and the average rms noise in a Stokes or image is mJy beam-1 which implies an average rms noise in a linear polarization image of mJy beam-1. Since a simple error propagation gives the rms fractional linear polarization error as
| (5) |
criterion (iii) implies that is always true.
Similarly, criterion (iii) defines an implicit relationship between the fractional linear polarization and the Stokes flux density of a source through
| (6) |
For the average rms values of and given above, this implies that on average if mJy, then criterion (iii) ensures that criterion (iv) is always true. In retrospect, criterion (ii) is very weak as its removal does not change the final source list. However, criteria (i), (iii) and (iv) together do not necessarily guarantee that criterion (ii) is always satisfied.
A total of 38454 sources in the NVSS satisfied the first three conditions. Only 381 sources satisfied all four criteria. However, a detailed visual inspection of the actual NVSS images in a field found that not all of the 381 sources were reliable. The following types of sources were eliminated: (1) 190 sources in fields with significant CLEAN artifacts which can include regions with strong sources or extended diffuse emission (e.g. Fig. 1 and Fig. 1); (2) 18 sources found in the residuals of a Gaussian fit to a nearby peak (e.g. Fig. 1); NVSS fits elliptical Gaussians to peaks in a field and if the residual in the area covered by a single Gaussian fit is too high, then multiple Gaussians were fitted simultaneously; (3) 42 sources that have one or more neighbouring sources within a radius of 90 arcsec (e.g. Fig. 1; given the NVSS source density, the probability of finding two unrelated sources within 90 arcsec is less than 10 per cent, Condon et al. 1998); and (4) two sources on the edge of the survey field near Dec. .
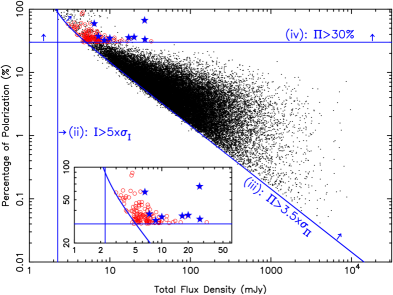
The final sample of 129 isolated, unresolved, highly polarized NVSS sources that satisfy all the selection criteria is listed in Table 1. An example of such a source is shown in Fig. 1. There are eight known pulsars in this sample. The flux density distribution of the 381 sources selected according to the initial four selection criteria is shown in Figure 2 along with the distribution of the 252 sources excluded after the above visual inspection. As expected, the fraction of sources excluded after the detailed visual inspection decreases as the flux density increases. Figure 3 plots the percentage polarization versus the total flux density for all the sources that satisfy the first three criteria. The selection criteria (ii) – (iv) plotted are based on typical values for the rms noise in Stokes , and images as given above. The final list of sources are marked by red circles, with the known pulsars marked by blue stars. The distribution of fractional polarization of the sources is shown in Fig. 4 where the majority have percentage polarization between 30 and 40 per cent. There appears to be an increase in the number of sources with high linear polarization towards lower flux densities. This may be an effect of there being more sources at low flux densities. Without detailed statistical tests, it is difficult to conclude whether the low flux density sources are preferentially more polarized as have been previously reported (Taylor et al. 2007).
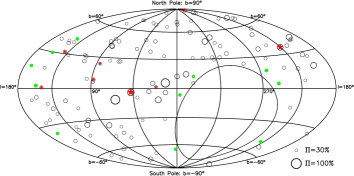
The distribution of the final sample on the sky in Galactic coordinates is given in Fig. 5, and shows no correlation with the Galactic latitude.

3 High resolution polarization measurements
In order to confirm the high polarization of these sources, higher resolution radio observations of selected sources were obtained with the ATCA and the VLA at 1.4 GHz. Tables 4 & 6 give the results of these radio observations. Sources from the final sample in the Dec. range and RA range from 16h to 10h were selected for observation with the ATCA. In addition, five out of the 10 sources in the final sample with percentage linear polarization uncertainty less than 5 per cent (excluding pulsars) were observed with the VLA.
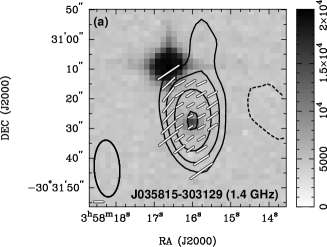
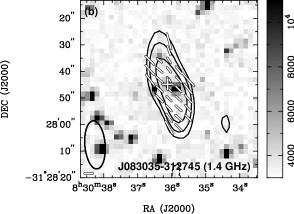
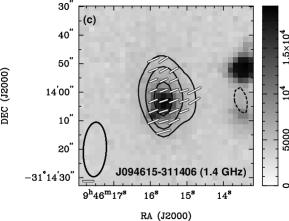
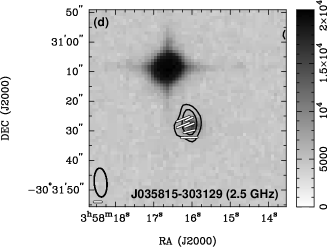
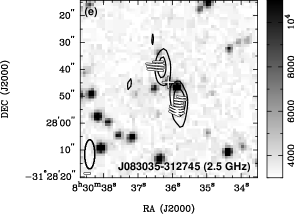
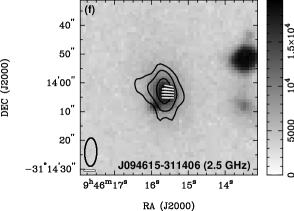
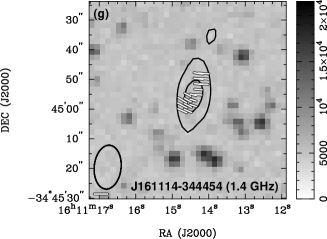
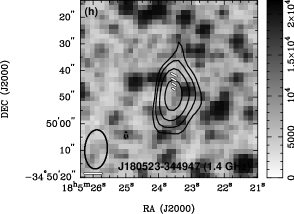
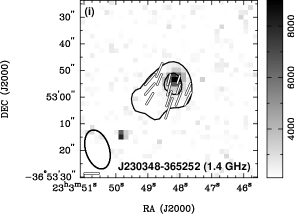
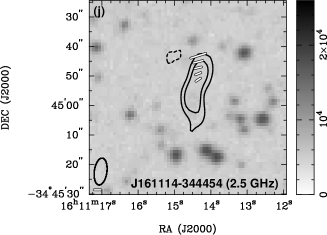
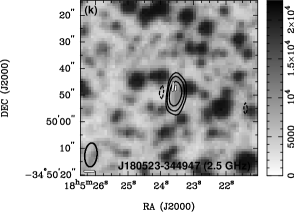
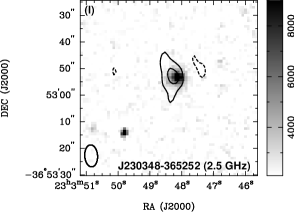
The ATCA has orthogonal linearly polarized feeds in each of the two observing frequencies. In continuum mode, the 128-MHz bandwidth at each observing frequency is divided into 32 channels. ATCA observations were conducted on 2001 January 18 and 19. The 6C array configuration was used and observations were conducted in snapshot mode simultaneously at 1384 MHz and 2496 MHz. Data calibration followed standard procedures in MIRIAD. The images were formed with bandwidth synthesis using the individual channels. Natural weighting was used to maximise the detection sensitivity. Since ATCA snapshot observations suffer from very sparse sampling of the uv plane, care was taken to minimise clean bias. The images were first cleaned unconstrained to identify the sources. The dirty images were then cleaned with box constraints on only those sources that also appear in the NVSS catalogue within the primary beam. The total clean iterations performed were between 1400 and 5500 for the 1.4-GHz data and between 300 and 1000 for the 2.5-GHz data. The Q and U images were cleaned with only a few hundred iterations. Polarization bias was corrected using estimates from the Q and U image rms noise, which was also very close to the V image rms noise. The percentage linear polarization from NVSS was confirmed within error margins for all but one source (J180523344947), which was found to be polarized at 8 per cent. Figure 6 shows the sources observed by the ATCA at both 1384 MHz and 2496 MHz. Pixels with polarization intensity less than and polarization position angle error greater than 10° were clipped from the final polarization image. There appears to be little Faraday depolarization judging from the small difference in average polarization between the two frequencies, as shown in Table 6.
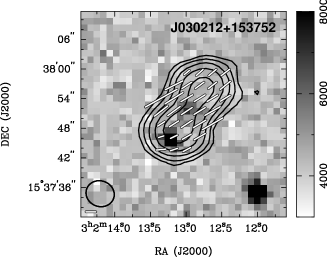
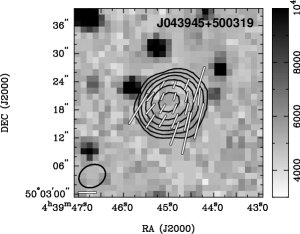
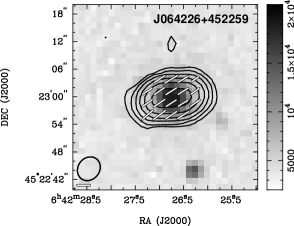
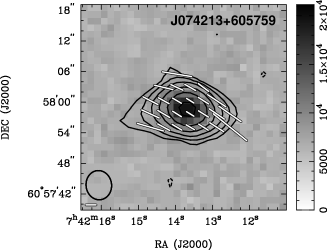
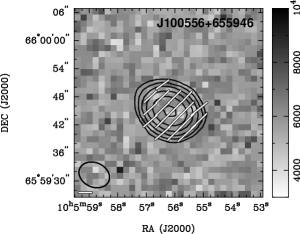
VLA follow-up observations were conducted on 2001 February 25 and 28 in a snapshot mode using the B array configuration. The observations were obtained in continuum mode with full polarization measurements at 1435 MHz and 1485 MHz. The VLA has circularly polarized feeds, with a single channel of 50-MHz bandwidth at each frequency. Data calibration, image formation and deconvolution followed standard calibration procedures in AIPS. Figure 7 shows the deconvolved radio images derived from natural weighting of the uv data. Polarization intensity was corrected for Ricean bias based on the rms noise in the Q and U images which were similar to the noise in the V images. The high linear polarization was confirmed in all cases by the VLA observations.
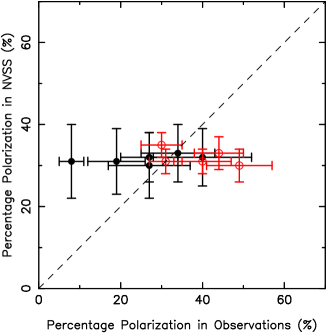
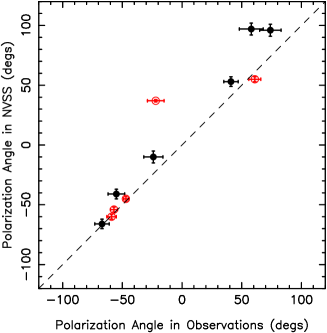
Figure 8 shows the NVSS fractional linear polarization versus those measured at higher resolution at the ATCA and VLA. High polarization was confirmed in all but one source. Figure 8 shows that the polarization position angles measured by the high-resolution observations also agree with the NVSS values.
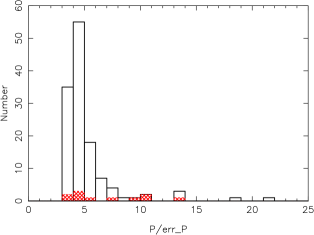
Figure 9 shows that the distribution of the polarization intensity signal-to-noise of the 11 sources selected for high-resolution observations span a similar range in polarization signal-to-noise ratio as the whole sample. Therefore, in so far as they are representative of the whole sample, the higher resolution ATCA and VLA measurements confirm that the high linear polarizations measured by the NVSS are reliable.
4 Optical identification
Faint Images of the Radio Sky at Twenty-centimeters (FIRST, Becker, White & Helfand 1995) has a much higher resolution (5 arcsec compared to 45 arcsec) and higher point source sensitivity (0.15 mJy rms noise compared to 0.45 mJy rms) than the NVSS, and hence is more reliable for optical identifications. It covers deg2 at the north Galactic cap and a wide strip along the celestial equator, but did not measure linear polarization. It was designed to cover the same region of sky as the Sloan Digital Sky Survey (SDSS, York et al. 2000). SDSS contains broad-band photometric measurements in five bands, , , , and (Fukugita et al. 1996) and spectroscopic observations for the brighter objects covering the wavelength range Å.
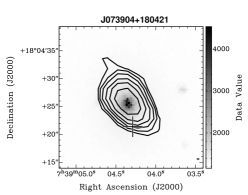
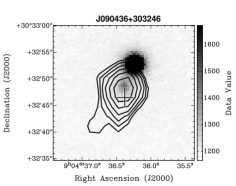
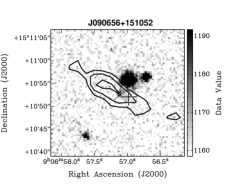
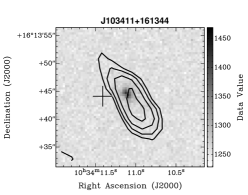
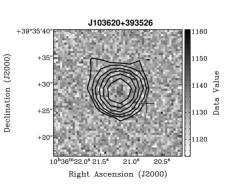
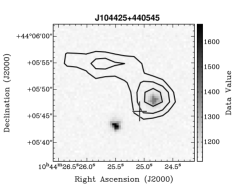
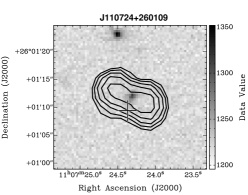
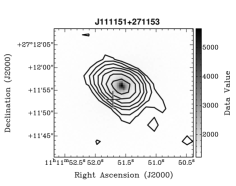
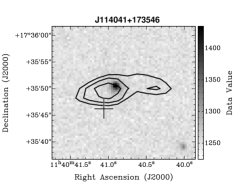
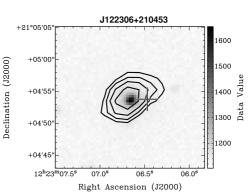
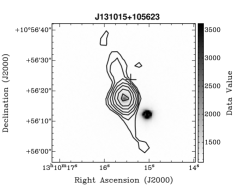
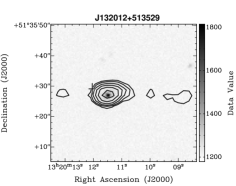
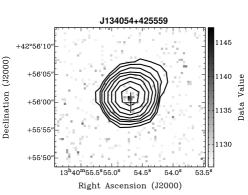
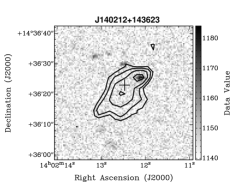
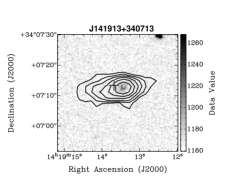
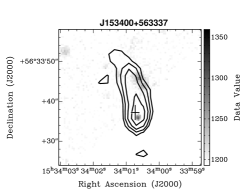
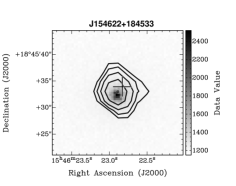
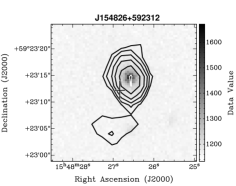
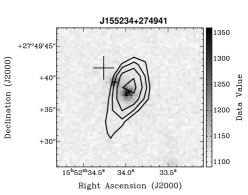
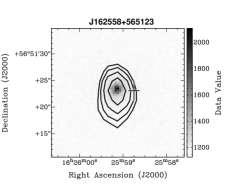
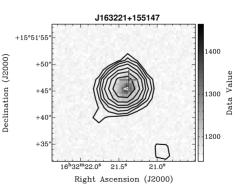
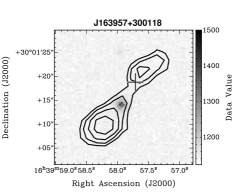
There are 45 sources in our final sample that fall within the FIRST survey region, of which 36 were detected in the FIRST catalogue within 10 arcsec of the NVSS position (see Table 4). The undetected sources in the FIRST survey region are most likely to be faint extended sources, since the rms noise levels in the images are all less than mJy beam-1. Correlations with the SDSS (Data Release 7) and Two Micron All Sky Survey (2MASS) catalogues found that 22 of the FIRST-detected sources have an optical counterpart (see Table 7). For slightly extended FIRST sources, optical identifications are found within 3 arcsec of the radio peak position. For sources that are well resolved (e.g. those that are resolved into doubles), optical identifications were sought along the principal axis of the source. Figure 10 shows radio contours overlaid on SDSS -band images for all the FIRST-detected sources with optical identifications. Table 7 lists the SDSS position of the optical identification, the SDSS g- and i-band magnitudes, the 2MASS magnitude, redshift (either spectroscopically determined or estimated from SDSS multiband photometry) and the classification of the identification based on the optical spectrum. All are extended in the optical. Out of 11 sources with SDSS spectra, 10 are associated with elliptical galaxies with typical absorption lines (Balmer lines, strong Mg I line, distinct -Å break and Ca II H & K) and no emission lines. The one exception, J163221+155147, showed emission lines of [O II], H, [O III], [O I], H, [N II] and [S II], typical of a LINER that has undergone recent star formation; it is classified as an ultraluminous infrared galaxy and an OH megamaser (Darling & Giovanelli 2000).
In addition, of the 11 sources with high-resolution ATCA and VLA observations, seven were found to have optical identifications in either SuperCOSMOS or 2MASS within 3 arcsec of the central position of the radio source. The SuperCOSMOS Sky Survey (SSS) is a digitized all-sky survey using three sets of photographic survey plates from the UK Schmidt, ESO Schmidt and Palomar Schmidt telescopes. Table 8 gives the position of the optical identification from SuperCOSMOS, the optical magnitudes, and , in the photographic (IIIaJ emulsion) and bands (IV-N emulsion) respectively, the 2MASS magnitude and a spectroscopically determined redshift if it could be measured. Spectra were obtained for two of the optical identifications using the Australian National University’s (ANU) 2.3-m telescope and Double Beam Spectrograph, with a combined wavelength range Å. Both spectra are identified with elliptical galaxies with no emission lines.
It appears that the majority of these isolated, compact high polarization radio sources are elliptical galaxies with no detectable emission lines. The 13 optical identifications with measured spectra (see Table 7 and 8) are all extragalactic, with redshifts ranging from to . Only J163221+155147 in the sample of 129 sources given in Table 1 was detected in the IRAS catalogue, indicating that few of these sources are luminous star-forming galaxies.
 |
 |
 |
 |
 |
 |
 |
 |
 |
 |
 |
 |
 |
 |
 |
 |
 |
 |
 |
 |
 |
 |
5 Radio luminosity and morphology
For those sources with measured redshifts, total radio luminosities have been determined from the NVSS integrated flux densities. Figure 12 shows the distribution of radio luminosity for the 13 sources with spectroscopic redshifts as well as a further 11 sources with SDSS photometric redshift estimates. The radio luminosities range from to W Hz-1, which is consistent with the sources being radio-loud active galactic nuclei (AGNs). The 1.4-GHz radio luminosity function of radio-loud AGNs and star-forming galaxies crosses over at around W Hz-1 (Sadler et al. 2002; Best et al. 2005; Mauch & Sadler 2007).
The high resolution radio observations with ATCA and VLA found that most sources observed with the VLA are extended (beam size 5 arcsec) and one of the sources observed with the ATCA is extended (beam size 9 arcsec 18 arcsec). In addition, the majority of sources (30 out of 36) detected in the FIRST survey (beam size 5 arcsec) are extended, with deconvolved sizes greater than 2 arcsec (Table 4). The two known pulsars are both found to be unresolved in the FIRST survey, as expected. The LINER/OH megamaser, J163221+155147, is also found to be unresolved in the FIRST survey. The projected linear size distribution (based on the FWHM of the deconvolved major-axis) of those extended radio sources with spectroscopic or SDSS photometric redshifts (Tables 7 and 8) is shown in Fig. 13.


6 Radio spectral index
Spectral indices of the sources have been estimated by comparing NVSS flux densities with the Westerbork Northern Sky Survey (WENSS) at 330 MHz (Rengelink et al. 1997) and with Sydney University Molonglo Sky Survey (SUMSS) at 843MHz (Bock, Large & Sadler 1999; Mauch et al. 2003, Murphy et al. 2007). Figure 14 shows the 330 MHz to 1.4 GHz spectral index histogram of the sample of 20 sources with WENSS flux densities. The median spectral index of this sample is (or excluding the pulsars). In comparison, for the 10 sources with SUMSS flux densities, the median spectral index between 843 MHz and 1.4 GHz is which is consistent with the NVSS-WENSS median spectral index; there are no neighbouring NVSS sources within the SUMSS beam for these 10 sources.
Kimball and Ivezić (2008) estimated the distribution of the spectral index between 330 MHz and 1.4 GHz for radio sources detected in all three surveys (NVSS, FIRST and WENSS) and found that the median spectral index of ‘compact’ sources to be , of ‘resolved’ sources to be and of ‘complex’ sources to be 111These numbers are slightly different from those given by Kimball and Ivezić (2008), due to a slight error in the NVSS flux densities quoted in their original paper, and correspond to the updated version of their online catalogue.. The radio morphologies of our sample mostly include sources defined in their paper as ‘compact’ and ‘resolved’ (see fig. 8 in Kimball & Ivezić 2008). An overall median spectral index of ‘compact’ and ‘resolved’ sources was obtained from their table of median spectral indices for the two types of sources, weighted by the number of sources in each category. It was found to be , similar to the median spectral index of our sample. This shows that the low frequency radio spectral index distribution of our sample of highly polarized NVSS sources is similar to a sample of NVSS sources with similar radio morphology but without polarization selection.

7 Nature of the sources
The radio and optical properties of these highly polarized radio sources discussed above show that at least the majority of optically bright objects are elliptical radio galaxies, based on their radio luminosity and their optical morphology and spectra. While radio galaxies are known to have such high linear polarization in isolated regions, such as part of a radio jet, there are no known examples of radio galaxies with such high overall linear polarization at 1.4 GHz. Even the highly polarized source J0658.75559 (55 per cent at 8.8 GHz) is only per cent polarized at 1.4 GHz (Liang et al. 2001). Faraday depolarization is much stronger at lower frequencies, as a result of thermal plasma lying either within or in front of the radio-emitting region.
In general, strong linear polarization implies that a substantial fraction of the magnetic field in the emission region is regular or compressed into a plane containing the line of sight (Laing 1981), which for some of the sources in our sample must extend for over a hundred kpc. It is difficult to generate ordered magnetic fields on such a large scale (Kulsrud & Zweibel 2008). Any theoretical model for the origin of magnetic fields will have to explain how such ordered large-scale fields can be created.
Why are these sources so highly polarized compared with known radio galaxies? Either they have instrinsically more ordered magnetic fields than average, or they have the same intrinsic properties but suffer less Faraday depolarization. We therefore consider four possibilities: (i) the intrinsic average polarization is higher because of a more ordered large-scale source magnetic field; (ii) the internal Faraday depolarization at the source is much lower due to a source magnetic field orientation that is mostly perpendicular to the line of sight (i.e. ) and/or a low and uniform thermal electron density at the source emission region; (iii) these sources inhabit a much sparser environment than radio galaxies showing low polarization; and (iv) the lines of sight to these sources pass through lower density regions than those of an average radio galaxy (i.e. lack of foreground magnetised plasma). The fact that these sources have very high polarization already suggest that the large scale magnetic field at the source must be well ordered. However, low polarization radio sources may also have well-ordered magnetic fields at the source, but suffer depolarization along the line of sight to the observer. Internal Faraday depolarization can be significant even if the magnetic field and electron density are both uniform. Foreground magnetised plasma with small-scale magnetic field and electron density inhomogeneity can also cause Faraday depolarization. Note that the magnetised plasma in the interstellar medium of our own Galaxy is known to cause Faraday rotation, but the amount of Faraday depolarization due to the Galaxy is not sufficient to be considered a major cause for the depolarization of extragalactic sources (Burn 1966).
We can address the third and fourth possibility by examining the immediate and line-of-sight environments of these ultrahigh polarization radio galaxies in comparison with a sample of similar radio sources with low linear polarization.
7.1 Environments of ultra-high polarization sources
In order to compare the environments of these highly polarized sources with similar radio sources of low polarization, we need to select those ultrahigh polarization sources with spectroscopic redshifts and a comparison sample of low-polarization sources. For the ultrahigh polarization subsample, only the eight sources with spectroscopically determined redshifts in the range of 0.1 - 0.4 are selected from Table 7 and 8 (excluding the OH megamaser). This subsample of high-polarization sources spans a 1.4-GHz radio luminosity range of to W Hz-1, and radio projected linear size range of kpc. All of the sources have optical spectra typical of low-power radio-loud AGNs, that is, elliptical galaxies with no obvious emission lines.
For comparison, we select a low-polarization sample of radio-loud AGNs with similar radio luminosity range, linear size range, redshift range and optical spectra, but with linear polarization less than 2 per cent at 1.4 GHz. Such a sample can be readily selected from the Best et al. (2005) catalogue, where they correlated the spectroscopic sample of the second data release (DR2) of the SDSS with NVSS and FIRST survey to obtain a catalogue of 2712 radio-luminous galaxies. These radio sources were then classified as radio-loud AGNs and star-forming galaxies, according to their optical spectra and radio luminosity. The radio sources found in the NVSS were also classified according to their source morphology, where ‘class 1’ are single-component NVSS sources with single-component matches in the FIRST survey and ‘class 2’ comprises single-component NVSS sources resolved into multiple FIRST sources. For our comparison sample, only the radio-loud AGNs with radio morphology of ‘class 1’ and ‘class 2’ are selected so that the low- and high-polarization samples are morphologically similar. The linear polarization values were obtained from the NVSS. The median percentage polarization is only 5.4 per cent, with 70 per cent of the sources having polarization less than 10 per cent. The low-polarization comparison sample of 121 sources is then selected by choosing only those with NVSS linear polarization less than 2 per cent.
A direct observation of the thermal plasma can be obtained through X-ray observations, but current X-ray surveys are not sensitive enough to detect anything other than rich clusters in this redshift range. In addition, sufficient resolution and brightness sensitivity are needed to distinguish X-ray emission from the central engine of an AGN and the surrounding medium. The ROSAT all-sky survey is the deepest all-sky X-ray catalogue available. Out of the 129 highly polarized sources in Table 1, only J103601+050714 was detected in the ROSAT all-sky survey catalogue and just four sources out of the 121 low-polarization sample from Best et al. (2005) have counterparts in the ROSAT catalogue.
Another indirect method of assessing the thermal plasma density of the environment is by counting the number of galaxies within a given radius. Thermal plasma is known to exist between galaxies in groups and clusters, with richer clusters having higher thermal electron densities and temperature (Mulchaey & Zabludoff 1998; Ledlow et al. 2003).


Galaxy number counts within a 1 Mpc, 500 kpc and 200 kpc radius (in the plane of the sky) for the ultrahigh polarization subsample are compared with that of the low-polarization sample. The galaxy count statistics within the 200 kpc radius give an indication of the more immediate environment around a radio source. A galaxy is counted if its SDSS photometric redshift is consistent with the radio-source redshift within the photometric redshift error, which is given by , where is appropriate for the current redshift range (Abdalla et al. 2008; Wen, Han & Liu 2009). Note that the photometric redshift error is much greater than the velocity dispersion of a typical rich cluster of galaxies. In addition, only galaxies brighter than an apparent magnitude limit of and an absolute magnitude limit of were selected. The apparent magnitude limit was selected for a reliable star/galaxy separation (Lupton et al. 2001). The absolute magnitude limit was chosen above the completeness limit for the redshift range concerned to avoid Malmquist bias.
Table 9 gives a summary of the results of the galaxy counts, and the galaxy count distributions within 1 Mpc and 200 kpc are shown in Fig. 15. The difference in the distributions is not significant. A Kolmogorov-Smirnov two-sample test was applied and the null hypothesis of the samples being drawn from the same distribution could not be rejected even at the 10 per cent level. The median galaxy count within a 1 Mpc radius is for the low-polarization sample and for the ultrahigh polarization sample. In comparison, using the same galaxy counting criteria, rich clusters of galaxies in the same redshift range, such as A773 and A2219, have 83 and 61 galaxies, respectively. On the other hand, the mean galaxy counts within a radius of 1 Mpc on the plane of the sky centred on a random position between the RA range of 180 to 200 and Dec. range of 0 – 10 within a redshift range of 0.1–0.4 is . It appears, therefore, that these compact, ultrahigh polarization radio galaxies are in environments similar to their low-polarization counterparts, which may be up to twice the average galaxy density in the same redshift range, but nearly an order of magnitude less dense than the richest clusters.
7.2 Line-of-sight environments of ultrahigh polarization sources
The above section compared the immediate environments of the ultrahigh polarization radio sources and the low-polarization radio sources. There remains the possibility that the lines of sight to these ultrahigh polarization sources pass through relatively low density environments compared with low-polarization sources. The same galaxy counting method can be applied to regions along the line of sight in the redshift range of . A 1 Mpc search radius in the plane of the sky and a redshift range determined by the photometric redshift error as defined in the above section are used for galaxy counting. The redshift range was selected such that more than half of the high-polarization sources are at redshifts greater than 0.25 and the lower bound of the redshift range was selected so that the angular size corresponding to 1 Mpc is a manageable size. The mean galaxy count for the ultrahigh polarization and the low-polarization samples are compared at each redshift in Fig. 16, which shows that the line-of-sight galaxy densities towards the ultrahigh and low-polarization sources are indistinguishable.
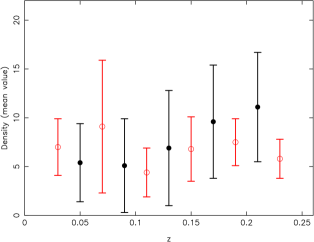
Our results suggest that the difference in polarization between the ultrahigh polarization sources and those with low polarization is not because of differences in depolarization due to the external environment along the line of sight. The reasons for the extremely high polarization must therefore be due to the intrinsic properties of the radio sources. The high polarization requires a more ordered source magnetic field, low and thermal plasma density in the radio emission region. Any mixing of a large amount of thermal electrons with the synchrotron emitting relativistic electrons will cause intrinsic Faraday depolarization.
From the sources with polarization measurements at both 1.4 and 2.5 GHz, it can be deduced that there is little internal Faraday depolarization, as the fractional polarization values are similar at the two frequencies within the limits of uncertainty (Fig. 6 and Table 6). This means that either and/or the density of the thermal plasma within the radio-emitting region is also very low.
The rotation of the polarization angle between 1.4 and 2.5 GHz can be accounted for by the rotation measure due to the foreground plasma in our own Galaxy. Table 6 shows the apparent rotation of the polarization position angle between the two frequencies and that expected from the Galactic rotation measure along the line of sight (Simard-Normandin, Kronberg & Button 1981). The apparent rotation of the polarization angle estimated from just two frequencies suffers from ambiguity and hence the values given represent the minimum rotation. Table 6 shows that this apparent minimum rotation is always similar to or less than the rotation of the polarization angle expected from the Galactic interstellar medium.
Higher resolution, higher frequency and multifrequency radio polarization observations of a larger sample of ultrahigh polarization sources are necessary to obtain the intrinsic magnetic field structure and the intrinsic Faraday rotation measure of these sources. These goals can be realised in the near future by current facilities (ATCA, EVLA), and ultimately by the SKA.
7.3 Optically faint radio sources
The above discussions were centred around optically bright sources with spectroscopic measurements, as those are the ones with optically bright counterparts. Of the FIRST detected sources, 61 per cent have an optical counterpart detected in the SDSS DR7 and 30 per cent have optical spectral data. Hence, we can only confirm that the optically brightest 30 per cent of high-polarization sources are radio-loud AGNs. The optically fainter objects may not be the same type of objects. Since we know, at least eight of the optically faint high-polarization sources are pulsars, the nature of these sources remains uncertain. However, the majority of the optically faint sources are unlikely to be pulsars, since pulsars tend to be unresolved. For example, only six sources are unresolved amongst the 36 FIRST detected sources in the high-polarization sample and the only two known pulsars observed in FIRST were found to be unresolved. These optically faint sources are likely to be higher redshift sources, but their nature still needs to be investigated with deeper imaging and follow-up spectroscopy.
8 Conclusions
High-resolution radio follow-up observations at both the ATCA and the VLA show that the NVSS linear polarization values for the sample of ultrahigh polarization sources listed in Table 1 are reliable at the stated levels. The optically bright ultrahigh polarization sources are identified with radio-loud AGNs. The radio properties, such as luminosity and spectral index of these compact, ultrahigh linear polarization sources, are unremarkable and typical of lower power radio-loud AGNs. Deeper optical observations are necessary to determine the identity of the optically faint sources.
The ultrahigh polarization sources appear to be in local environments similar to their low-polarization counterparts with similar radio power, linear size, redshift range and optical morphology. The line-of-sight environments also appear indistinguishable. The ultrahigh polarization must be due to the intrinsic properties of the sources that favour highly ordered magnetic fields and low thermal plasma density or low in the radio-emitting region. Preliminary observations at two frequencies show that Faraday depolarization is low and hence confirm that the internal Faraday depolarization is low. A simple explanation could be that the magnetic fields in these sources are aligned preferentially in the plane of the sky giving a low and hence low internal Faraday depolarization.
Acknowledgements
Support from the National Natural Science Foundation (NNSF) of China (10773016, 10821061, and 1083303), and the National Key Basic Research Science Foundation of China (2007CB815403) is gratefully acknowledged. HL acknowledges the hospitality of the National Astronomical Observatory of China and the University of Sydney, School of Physics. We thank Zhong Lue Wen, Alfonso Aragon-Salamanca and Ron Ekers for useful discussions and Olivier Guiller, Rebecca Lange for assistance. KARMA was used for the radio-optical overlays and MIRIAD was used for imaging the high-resolution data from the ATCA. The ATCA is part of the Australia Telescope, funded by the Commonwealth of Australia for operation as a National Facility and managed by the CSIRO. The National Radio Astronomy Observatory is a facility of the National Science Foundation operated under cooperative agreement by Associated Universities, Inc. The research made use of the SDSS archive provided by the Alfred P. Sloan Foundation, the Participating Institutions, the National Science Foundation, the U.S. Department of Energy, the National Aeronautics and Space Administration, the Japanese Monbukagakusho, the Max Planck Society and the Higher Education Funding Council for England. The SSS material is based on photographic data originating from the UK, Palomar and ESO Schmidt telescopes and was provided by the Wide-Field Astronomy Unit, Institute for Astronomy, University of Edinburgh. The research made use of the NVSS and FIRST radio surveys, which were carried out using the VLA of the National Radio Astronomy Observatory.
References
- Abdalla et al. (2008) Abdalla F. B., Banerji M., Lahav O., Rashkov V. 2008, preprint (arXiv:0812.3831)
- Becker et al. (1995) Becker R. H., White R. L., Helfand D. J. 1995, ApJ, 450, 559
- Bernet et al. (2008) Bernet M. L., Miniati F., Lilly S. J., Kronberg P. P., Dessauges-Zavadsky, M. 2008, Nature, 454, 302
- Best et al. (2005) Best P. N., Kauffmann G., Heckman T. M., Ivezić, Ž. 2005, MNRAS, 362, 9
- Bock et al. (1999) Bock D. C.-J., Large M. I., Sadler E. M. 1999, AJ, 117, 1578
- Burn (1966) Burn B. J. 1966, MNRAS, 133, 67-83
- Condon et al. (1998) Condon J. J., Cotton W. D., Greisen E. W., Yin Q. F., Perley R. A., Taylor G. B., Broderick J. J. 1998, AJ, 115, 1693
- Crawford et al. (2000) Crawford F., Kaspi V. M., Bell J. F. 2000, AJ, 119, 2376
- Darling & Giovanelli (2000) Darling J., Giovanelli R. 2000, AJ, 119, 3003
- Fletcher et al. (2004) Fletcher A., Berkhuijsen E. M., Beck R., Shukurov A. 2004, A&A, 414, 53
- Fukugita et al. (1996) Fukugita M., Ichikawa T., Gunn J. E., Doi, M., Shimasaku K., Schneider D. P. 1996, AJ, 111, 1748
- Goodlet & Kaiser (2005) Goodlet J. A., Kaiser C. R. 2005, MNRAS, 359, 1456
- Han et al. (2004) Han J. L., Manchester R. N., Lyne A. G., Qiao G. J. 2004, in Camilo F., Gaensler B. M., eds, IAU Symp. 218, Young Neutron Stars and Their Environments, p.135
- Han & Tian (1999) Han J. L., Tian, W. W. 1999, A&AS, 136, 571
- Kimball & Ivezić (2008) Kimball A. E., Ivezić Ž. 2008, AJ, 136, 684
- Kronberg (1994) Kronberg P. P. 1994, Rep. Prog. Phys., 57, 325
- Kulsrud & Zweibel ( 2008) Kulsrud R. M., Zwei bel E. G. 2008, Rep. Prog. Phys., 71, 046901
- Laing et al. (1981) Laing R. A. 1981, ApJ, 248, 87
- Ledlow et al. (2003) Ledlow, M. J., Voges, W., Owen, F. N., Burns, J. O. 2003, AJ, 126, 2740
- Liang et al. (2000) Liang H., Hunstead R. W., Birkinshaw M., Andreani P. 2000, ApJ, 544, 686
- Liang et al. (2001) Liang H., Ekers R. D., Hunstead R. W., Falco E. E., Shaver P. 2001, MNRAS, 328, L21
- Lupton et al. (2001) Lupton R., Gunn J. E., Ivezić Z., Knapp G. R., Kent S. 2001, in Harnden F. R., Jr., Primini F. A., Payne H. E., eds, ASP Conf. Ser. Vol.238, Astronomical Data Analysis Software and Systems X, Astron. Soc. Pac., San Francisco, p.269
- Mauch et al. (2003) Mauch T., Murphy T., Buttery H. J., Curran J., Hunstead R. W., Piestrzynski B., Robertson J. G., Sadler E. M. 2003, MNRAS, 342, 1117
- Mauch & Sadler (2007) Mauch T., Sadler E. M. 2007, MNRAS, 375, 931
- Mulchaey & Zabludoff (1998) Mulchaey, J. S, Zabludoff, A. I. 1998, ApJ, 496, 73
- Murphy et al. (2007) Murphy T., Mauch T., Green A., Hunstead R. W., Piestrzynska B., Kels A. P., Sztajer P. 2007, MNRAS, 382, 382
- Rengelink et al. (1997) Rengelink R. B., Tang Y., de Bruyn A. G., Miley G. K., Bremer M. N., Roettgering H. J. A., & Bremer M. A. R. 1997, A&AS, 124, 259
- Ruzmaikin et al. (1988) Ruzmaikin A., Sokoloff D., Shukurov A., 1988, Nature, 336, 341
- Sadler et al. (2002) Sadler E. M., et al. 2002, MNRAS, 329, 227
- Saikia & Salter (1988) Saikia D. J., & Salter C. J. 1988, Ann. Rev. Astr. Ap., 26, 93
- Simard-Normandin et al. (1981) Simard-Normandin M.,Kronberg P. P., Button S. 1981, ApJS, 45, 97
- Sokoloff et al. (1998) Sokoloff D. D., Bykov A. A., Shukurov A., Berkhuijsen E. M., Beck R., Poezd A. D. 1998, MNRAS, 299, 189
- Taylor et al. (2007) Taylor A. R.,Stil J. M., Grant J. K., Landecker T. L., Kothes R., Reid R. I., Gray A. D., Scott D., Martin P. G. et al. 2007, ApJ, 666, 201
- Wen et al. (2009) Wen Z. L., Han J. L., Liu F. S. 2009, ApJS, 183, 197
- Wolfe et al. (2008) Wolfe A. M., Jorgenson R. A., Robishaw T., Heiles C., Prochaska J. X. 2008, Nature, 455, 638
- York et al. (2000) York D. G., et al. 2000, AJ, 120, 1579
| Source | PPA | |||||
|---|---|---|---|---|---|---|
| (mJy) | (mJy) | (per cent) | ||||
| J000518+280145 | ||||||
| J000953+003956 | ||||||
| J001615143722 | ||||||
| J003706+515737 | ||||||
| J004742+191412 | ||||||
| J010829+280828 | ||||||
| J010907+253341 | ||||||
| J013051065547 | ||||||
| J013558022406 | ||||||
| J014646255558 | ||||||
| J020338+385942 | ||||||
| J021908+121836 | ||||||
| J021933+425512 | ||||||
| J024746+452407 | ||||||
| J025936+285952 | ||||||
| J030212+153752 | ||||||
| J032305+231722 | ||||||
| J033331242300 | ||||||
| J034925+071637 | ||||||
| J035815303129 | ||||||
| J035853+541315* | ||||||
| J040245+431320 | ||||||
| J042204+363943 | ||||||
| J043945+500319 | ||||||
| J054826+621008 | ||||||
| J062619260934 | ||||||
| J064226+452259 | ||||||
| J072803030521 | ||||||
| J073904+180421 | ||||||
| J074213+605759 | ||||||
| J080351+820954 | ||||||
| J080840+212610 | ||||||
| J081130014548 | ||||||
| J081458+742905* | ||||||
| J082124+175736 | ||||||
| J083035312745 | ||||||
| J085104142446 | ||||||
| J085930+510912 | ||||||
| J090436+303246 | ||||||
| J090522+271728 | ||||||
| J090656+151052 | ||||||
| J091048+312725 | ||||||
| J091337+652628 | ||||||
| J091958+615934 | ||||||
| J092214+063824* | ||||||
| J094615311406 | ||||||
| J094818+685735 | ||||||
| J100110015230 | ||||||
| J100133191624 | ||||||
| J100556+655946 | ||||||
| J102758122116 | ||||||
| J103411+161344 | ||||||
| J103601+050714 | ||||||
| J103620+393526 | ||||||
| J104425+440545 | ||||||
| J110724+260109 | ||||||
| J111151+271153 | ||||||
| J112158+232928 |
| Source | PPA | |||||
|---|---|---|---|---|---|---|
| (mJy) | (mJy) | (per cent) | ||||
| J113347360537 | ||||||
| J114041+173546 | ||||||
| J122306+210453 | ||||||
| J122451+224653 | ||||||
| J123940+245348* | ||||||
| J124234274914 | ||||||
| J125225195823 | ||||||
| J130519160020 | ||||||
| J130922094732 | ||||||
| J131015+105623 | ||||||
| J131551+312114 | ||||||
| J132012+513529 | ||||||
| J132145310259 | ||||||
| J133819122952 | ||||||
| J134054+425559 | ||||||
| J134452+421159 | ||||||
| J135319+164437 | ||||||
| J135347314453 | ||||||
| J135531291930 | ||||||
| J135727+005817 | ||||||
| J140212+143623 | ||||||
| J141913+340713 | ||||||
| J143016+200120 | ||||||
| J143017+303111 | ||||||
| J143511260245 | ||||||
| J151129204120 | ||||||
| J153400+563337 | ||||||
| J154622+184533 | ||||||
| J154826+592312 | ||||||
| J155234+274941 | ||||||
| J160047+522049 | ||||||
| J161114344454 | ||||||
| J162226+010249 | ||||||
| J162558+565123 | ||||||
| J162709275117 | ||||||
| J163221+155147 | ||||||
| J163540390700 | ||||||
| J163644+553439 | ||||||
| J163957+300118 | ||||||
| J165952220451 | ||||||
| J172333+782907 | ||||||
| J175106155339 | ||||||
| J175154+761537 | ||||||
| J175533+375216 | ||||||
| J175808+393018 | ||||||
| J180523344947 | ||||||
| J180625+483125 | ||||||
| J181818044404 | ||||||
| J182530093521* | ||||||
| J182701204237 | ||||||
| J184044+564055* | ||||||
| J185501050656 | ||||||
| J190411+745943 | ||||||
| J190907171033 | ||||||
| J193214+105931* | ||||||
| J193835+025903 | ||||||
| J202219291546 | ||||||
| J202249+515449* |
| Source | PPA | |||||
| (mJy) | (mJy) | (per cent) | ||||
| J203451+505746 | ||||||
| J203453+214620 | ||||||
| J205104+582930 | ||||||
| J210031084309 | ||||||
| J221157+074408 | ||||||
| J223609+043049 | ||||||
| J224132+165029 | ||||||
| J224206014017 | ||||||
| J230348365252 | ||||||
| J231707+084904 | ||||||
| J232642193709 | ||||||
| J233825+424248 | ||||||
| J233902+303143 | ||||||
| Column description: | ||||||
| Column (1): NVSS source name; | ||||||
| Column (2) and (3): Galactic coordinates; | ||||||
| Column (4): Flux density in the NVSS; | ||||||
| Column (5): Linearly polarised flux density in NVSS; | ||||||
| Column (6): Percentage polarisation in the NVSS; | ||||||
| Column (7): Polarisation position angle (N to E) in the NVSS; | ||||||
| *: Known pulsar. | ||||||
| Source | RA | DEC | Pos.NVSS | Size | PA | rms | |||
| ( h m s) | ( ∘ ′ ′′) | () | (∘) | (mJy/beam) | (mJy/beam) | (mJy) | (mJy) | ||
| ATCA: | |||||||||
| J035815303129 | 03 58 16.05 | 30 31 27.7 | 2.3 | — | 3.9 | 0.15 | 5.9 | ||
| J083035312745** | 08 30 36.04 | 31 27 46.1 | 1.3 | 20 | 4.3 | 0.19 | 6.3 | ||
| J094615311406 | 09 46 15.64 | 31 14 03.1 | 4.9 | — | 5.6 | 0.35 | 7.5 | ||
| J161114344454 | 16 11 14.43 | 34 44 55.2 | 0.3 | — | 3.4 | 0.46 | 4.4 | ||
| J180523344947 | 18 05 23.54 | 34 49 48.8 | 1.4 | — | 7.9 | 0.22 | 8.2 | ||
| J230348365252 | 23 03 48.19 | 36 52 55.2 | 2.3 | — | 2.8 | 0.38 | 5.8 | ||
| VLA: | |||||||||
| J030212+153752** | 03 02 12.95 | +15 37 51.8 | 1.2 | 148 | 3.9 | 0.05 | 11.8 | ||
| J043945+500319 | 04 39 44.98 | +50 03 19.6 | 0.2 | 158.5 | 9.7 | 0.07 | 13.6 | ||
| J064226+452259 | 06 42 26.75 | +45 22 59.7 | 1.4 | 93.5 | 7.4 | 0.05 | 14.9 | ||
| J074213+605759 | 07 42 13.68 | +60 57 58.6 | 0.8 | 82.8 | 5.6 | 0.05 | 8.5 | ||
| J100556+655946 | 10 05 56.17 | +65 59 45.0 | 1.7 | 21.6 | 8.7 | 0.08 | 9.4 | ||
| FIRST: | |||||||||
| J000953+003956 | 00 09 53.53 | +00 40 00.5 | 7.7 | 72.7 | 1.6 | 0.10 | 3.5 | ||
| J073904+180421 | 07 39 04.35 | +18 04 25.9 | 4.6 | 38.3 | 4.4 | 0.17 | 5.8 | ||
| J074213+605759 | 07 42 13.69 | +60 57 58.7 | 0.7 | 89.6 | 6.2 | 0.16 | 8.4 | ||
| J080840+212610 | — | — | — | — | — | — | 0.14 | — | |
| J082124+175736 | — | — | — | — | — | — | 0.38 | — | |
| J085930+510912 | 08 59 30.95 | +51 09 10.8 | 2.6 | 170.7 | 1.6 | 0.23 | 3.3 | ||
| J090436+303246 | 09 04 36.41 | +30 32 47.8 | 1.3 | 168.2 | 3.5 | 0.13 | 4.3 | ||
| J090522+271728 | — | — | — | — | — | — | 0.15 | — | |
| J090656+151052 | 09 06 57.25 | +15 10 53.8 | 4.3 | 55.3 | 1.1 | 0.15 | 4.0 | ||
| J091048+312725 | — | — | — | — | — | — | 0.13 | — | |
| J091958+615934 | 09 19 58.07 | +61 59 46.8 | 12.3 | 8.1 | 3.7 | 0.18 | 3.1 | ||
| J092214+063824* | 09 22 14.01 | +06 38 22.8 | 5.9 | 150.5 | 10.3 | 0.14 | 10.5 | ||
| J100110015230 | 10 01 10.48 | 01 52 27.5 | 3.3 | 26.5 | 2.1 | 0.14 | 4.3 | ||
| J103411+161344 | 10 34 11.03 | +16 13 43.0 | 5.6 | 33.1 | 1.8 | 0.15 | 3.8 | ||
| J103601+050714 | — | — | — | — | — | — | 0.14 | — | |
| J103620+393526 | 10 36 21.20 | +39 35 28.9 | 5.7 | 179.7 | 3.7 | 0.13 | 4.6 | ||
| J104425+440545 | 10 44 24.97 | +44 05 49.6 | 3.9 | 34.9 | 1.1 | 0.14 | 3.7 | ||
| J110724+260109 | 11 07 24.32 | +26 01 11.6 | 2.3 | 65.1 | 2.7 | 0.15 | 5.1 | ||
| J111151+271153 | 11 11 51.58 | +27 11 55.9 | 3.4 | 61.3 | 4.5 | 0.15 | 7.6 | ||
| J112158+232928 | — | — | — | — | — | — | 0.27 | — | |
| J114041+173546 | 11 40 40.96 | +17 35 49.9 | 3.9 | 101.1 | 1.4 | 0.15 | 2.4 | ||
| J122306+210453 | 12 23 06.68 | +21 04 54.1 | 2.9 | 122.4 | 2.1 | 0.17 | 2.6 | ||
| J122451+224653 | — | — | — | — | — | — | 0.14 | — | |
| J123940+245348* | 12 39 40.39 | +24 53 49.9 | 1.7 | 104.6 | 11.5 | 0.15 | 11.2 | ||
| J131015+105623 | 13 10 15.55 | +10 56 17.6 | 6.5 | 11.7 | 4.2 | 0.15 | 6.2 | ||
| J131551+312114 | 13 15 52.54 | +31 21 14.2 | 10.0 | 87.4 | 1.4 | 0.13 | 2.9 | ||
| J132012+513529 | 13 20 11.46 | +51 35 27.4 | 5.7 | 96.8 | 3.3 | 0.15 | 4.8 | ||
| J134054+425559 | 13 40 54.70 | +42 56 01.1 | 1.2 | 126.5 | 6.5 | 0.14 | 7.3 | ||
| J134452+421159 | 13 44 52.68 | +42 11 59.2 | 1.2 | 144.2 | 1.9 | 0.13 | 5.5 | ||
| J135319+164437 | 13 53 19.37 | +16 44 45.3 | 7.8 | 82.3 | 3.5 | 0.15 | 4.8 | ||
| J135727+005817 | — | — | — | — | — | — | 0.37 | — | |
| J140212+143623** | 14 02 12.29 | +14 36 23.2 | 2.6 | 131 | 1.4 | 0.15 | 10.1 | ||
| J141913+340713 | 14 19 13.52 | +34 07 12.3 | 2.3 | 96.4 | 3.2 | 0.15 | 8.9 | ||
| J143016+200120 | 14 30 17.20 | +20 01 19.7 | 3.3 | 139.6 | 3.5 | 0.14 | 3.5 | ||
| J143017+303111 | — | — | — | — | — | — | 0.15 | — | |
| J153400+563337 | 15 34 00.74 | +56 33 40.2 | 3.0 | 12.8 | 1.7 | 0.15 | 6.3 | ||
| J154622+184533 | 15 46 22.89 | +18 45 33.0 | 1.2 | 20.8 | 2.1 | 0.15 | 2.9 | ||
| J154826+592312 | 15 48 26.61 | +59 23 14.4 | 2.8 | 5.4 | 2.7 | 0.14 | 3.7 | ||
| J155234+274941 | 15 52 33.98 | +27 49 38.0 | 5.2 | 158.4 | 1.6 | 0.14 | 2.1 | ||
| J160047+522049 | 16 00 47.66 | +52 20 56.3 | 8.8 | 34.2 | 4.1 | 0.14 | 5.9 | ||
| J162558+565123 | 16 25 59.14 | +56 51 22.5 | 3.3 | 0.8 | 2.0 | 0.16 | 3.0 |
| Source | RA | DEC | Pos.NVSS | Size | PA | rms | |||
| ( h m s) | ( ∘ ′ ′′) | () | (∘) | (mJy/beam) | (mJy/beam) | (mJy) | (mJy) | ||
| J163221+155147 | 16 32 21.44 | +15 51 45.7 | 1.7 | 131.0 | 5.7 | 0.15 | 5.9 | ||
| J163644+553439 | 16 36 44.00 | +55 34 35.8 | 5.4 | 31.6 | 4.7 | 0.15 | 4.8 | ||
| J163957+300118** | 16 39 57.84 | +30 01 16.1 | 3.2 | 145 | 1.6 | 0.14 | 5.6 | ||
| J224206014017 | 22 42 06.42 | 01 40 11.8 | 6.7 | 8.1 | 2.6 | 0.13 | 3.5 | ||
| Column description: | |||||||||
| Column (1): NVSS source name; | |||||||||
| Column (2) and (3): J2000 coordinates from high-resolution radio observations (ATCA, VLA or FIRST); | |||||||||
| Column (4): Position offset between NVSS position and the peak position from high-resolution radio images; | |||||||||
| Column (5) and (6): Deconvolved size and position angle (N to E) of sources (for FIRST observations, the deconvolved sizes are from | |||||||||
| the FIRST catalogue and a source is unresolved if the deconvolved size is ); | |||||||||
| Column (7),(8) and (9): Peak flux density, rms noise and integrated flux density in the high-resolution radio observations; | |||||||||
| Column (10): Flux density in the NVSS; | |||||||||
| ‘—’ in columns (2)–(7) and (9): the source is not detected in the FIRST survey; | |||||||||
| *: Known pulsar; | |||||||||
| **: Clearly resolved into two sources in radio high-resolution observations (the listed coordinate is an average of the two peak positions). | |||||||||
| Source | PPANVSS | PPA1.4 | PPA2.5 | PPA | PPAG | |||
| (per cent) | (per cent) | (per cent) | ||||||
| ATCA: | ||||||||
| J035815303129 | 15 | 25 | ||||||
| J083035312745** | 5 | 109 | ||||||
| J094615311406 | 27 | 59 | ||||||
| J161114344454 | 42 | |||||||
| J180523344947 | 62 | 118 | ||||||
| J230348365252 | — | — | — | |||||
| VLA: | ||||||||
| J030212+153752** | ||||||||
| J043945+500319 | ||||||||
| J064226+452259 | ||||||||
| J074213+605759 | ||||||||
| J100556+655946 | ||||||||
| Column description: | ||||||||
| Column (1): NVSS source name; | ||||||||
| Column (2) and (3): Percentage linear polarisation and polarisation position angle in the NVSS; | ||||||||
| Column (4) and (5): Percentage linear polarisation and polarisation position angle in high-resolution | ||||||||
| observations at 1.4 GHz with ATCA and VLA; | ||||||||
| Column (6) and (7): Percentage linear polarisation and polarisation position angle in high-resolution | ||||||||
| observations at 2.5 GHz with the ATCA; | ||||||||
| Column (8): Apparent rotation of the polarisation position angle between 1.4 GHz and 2.5 GHz; | ||||||||
| Column (9): Rotation of the polarisation position angle between 1.4 GHz and 2.5 GHz expected | ||||||||
| from the Galactic rotation measure given in Simard-Normandin, Kronberg & Button (1981); | ||||||||
| **: Clearly resolved into two sources in radio high-resolution observations. | ||||||||
| Source | RA | DEC | radioSDSS | radio2MASS | redshift | type | |||
| ( h m s) | ( ∘ ′ ′′) | (′′) | (′′) | (photometric redshift) | |||||
| J073904+180421 | 07 39 04.35 | +18 04 25.5 | 0.4 | 15.20 | 13.90 | 0.5 | 12.72 | ||
| J090436+303246 | 09 04 36.39 | +30 32 48.6 | 0.9 | 19.16 | 17.13 | 1.1 | 14.74 | E | |
| J090656+151052 | 09 06 57.10 | +15 10 52.7 | 2.5 | 24.93 | 20.93 | — | — | ||
| J103411+161344 | 10 34 11.10 | +16 13 44.6 | 1.9 | 20.63 | 18.20 | — | — | E | |
| J103620+393526 | 10 36 21.17 | +39 35 28.6 | 0.4 | 24.50 | 22.25 | — | — | ||
| J104425+440545 | 10 44 24.82 | +44 05 47.8 | 2.4 | 19.93 | 18.02 | 2.5 | 15.46 | ||
| J110724+260109 | 11 07 24.31 | +26 01 11.8 | 0.2 | 22.29 | 19.34 | — | — | ||
| J111151+271153 | 11 11 51.56 | +27 11 55.9 | 0.2 | 15.15 | 13.92 | 0.2 | 12.38 | E | |
| J114041+173546 | 11 40 40.90 | +17 35 50.2 | 0.9 | 20.94 | 18.44 | 0.9 | 15.84 | E | |
| J122306+210453 | 12 23 06.64 | +21 04 53.8 | 0.6 | 18.92 | 17.03 | 0.6 | 14.66 | E | |
| J131015+105623 | 13 10 15.54 | +10 56 17.2 | 0.4 | 16.58 | 15.17 | 0.3 | 13.56 | E | |
| J132012+513529 | 13 20 11.49 | +51 35 27.1 | 0.4 | 19.38 | 17.22 | 0.5 | 14.73 | E | |
| J134054+425559 | 13 40 54.71 | +42 56 00.9 | 0.3 | 24.19 | 21.88 | — | — | ||
| J140212+143623 | 14 02 12.10 | +14 36 25.4 | 0.2** | 23.49 | 20.41 | — | — | ||
| J141913+340713 | 14 19 13.44 | +34 07 12.7 | 1.0 | 22.34 | 19.11 | — | — | ||
| J153400+563337 | 15 34 00.64 | +56 33 36.0 | 0.1** | 21.15 | 18.57 | — | — | E | |
| J154622+184533 | 15 46 22.90 | +18 45 32.3 | 0.7 | 16.68 | 15.26 | 0.6 | 13.46 | E | |
| J154826+592312 | 15 48 26.59 | +59 23 14.6 | 0.3 | 18.69 | 16.86 | 0.4 | 14.61 | ||
| J155234+274941 | 15 52 33.98 | +27 49 37.7 | 0.3 | 20.29 | 17.85 | 0.5 | 15.21 | E | |
| J162558+565123 | 16 25 59.13 | +56 51 23.4 | 0.9 | 18.08 | 16.51 | 0.9 | 14.28 | ||
| J163221+155147 | 16 32 21.38 | +15 51 45.5 | 0.8 | 18.30 | 17.15 | 0.3 | 14.30 | L | |
| J163957+300118 | 16 39 57.94 | +30 01 14.2 | 0.6** | 20.70 | 18.35 | 0.3** | 15.44 | ||
| Column description: | |||||||||
| Column (1): NVSS source name; | |||||||||
| Column (2) and (3): J2000 coordinates of optical identification in the SDSS; | |||||||||
| Column (4): Position offset between the FIRST survey and SDSS; | |||||||||
| Column (5): g-band magnitude from the SDSS corrected for extinction; | |||||||||
| Column (6): i-band magnitude from the SDSS corrected for extinction; | |||||||||
| Column (7): Position offset between the FIRST survey and 2MASS; | |||||||||
| Column (8): K-band magnitude from the 2MASS; | |||||||||
| Column (9): Redshift from the SDSS (photometric redshifts are given in brackets); | |||||||||
| Column (10): Type of identifications (‘E’ for elliptical galaxy and ‘L’ for LINER); | |||||||||
| ’—’ in columns (7) and (8): not detected in the 2MASS ; | |||||||||
| **: Distance from optical identification to central axis of the radio source. | |||||||||
| Source | RA | DEC | radioSSA | radio2MASS | redshift | type | |||
| ( h m s) | ( ∘ ′ ′′) | (′′) | (′′) | ||||||
| J030212+153752 | 03 02 12.98 | +15 37 51.5 | 0.3** | 22.3 | 19.53 | 0.4** | 15.5 | — | |
| J035815303129 | 03 58 16.01 | 30 31 28.2 | 0.7 | 18.26 | 16.79 | 0.3 | 14.35 | 0.183 | E |
| J064226+452259 | 06 42 26.73 | +45 22 59.8 | 0.2 | 17.49 | 15.65 | 0.9 | 13.53 | — | |
| J074213+605759 | 07 42 13.73 | +60 57 58.7 | 0.4 | 17.58 | 15.77 | 0.1 | 13.62 | — | |
| J083035312745 | 08 30 36.12 | 31 27 44.8 | 0.2** | 20.7 | 18.5 | — | — | — | |
| J094615311406 | 09 46 15.66 | 31 14 03.7 | 0.7 | 16.10 | 14.49 | 0.9 | 12.89 | 0.0565 | E |
| J230348365252 | 23 03 48.13 | 36 52 53.4 | 0.7 | 19.88 | 17.83 | 1.9 | 14.97 | — | |
| Column description: | |||||||||
| Column (1): NVSS source name; | |||||||||
| Column (2) and (3): J2000 coordinates from SuperCOSMOS Sky Archive (SSA); | |||||||||
| Column (4): Position offset between radio high-resolution observations (ATCA or VLA) and the SSA; | |||||||||
| Column (5): -band magnitude from the SSA; | |||||||||
| Column (6): -band magnitude from the SSA; | |||||||||
| Column (7): Position offset between radio high-resolution observations (ATCA or VLA) and the 2MASS; | |||||||||
| Column (8): -band magnitude from the 2MASS; | |||||||||
| Column (9): Spectroscopic redshift; | |||||||||
| Column (10): Type of identification (‘E’ for elliptical galaxy); | |||||||||
| ’—’ in columns (5),(6),(7),(8) and (9): not detected in the SSA and 2MASS or no spectroscopic redshift available; | |||||||||
| ∗∗: Distance from optical identification to the central axis of the radio source; | |||||||||
| : Not in the 2MASS catalogue; position estimated from the peak pixel in the -band image; | |||||||||
| : Not in the SSA catalogue; optical position estimated from the -band image; | |||||||||
| : Approximate magnitude estimated by comparing with catalogued objects with similar brightness. | |||||||||
| radius | low polarisation sample | high polarisation sample | D | ||||
| (Mpc) | mean | median | sigma | mean | median | sigma | (KS test) |
| 1.0 | 11.4 | 9.0 | 6.9 | 7.9 | 7.0 | 2.6 | 0.36 |
| 0.5 | 5.4 | 4.0 | 3.8 | 4.0 | 3.0 | 1.9 | 0.25 |
| 0.2 | 2.2 | 2.0 | 1.5 | 1.4 | 1.0 | 0.5 | 0.31 |
| Column description: | |||||||
| Column (1): Search radius for galaxy counts; | |||||||
| Column (2),(3) and (4): mean, median and dispersion of galaxy count distribution | |||||||
| for the 121 low-polarisation sources; | |||||||
| Column (5),(6) and (7): mean, median and dispersion of galaxy count distribution | |||||||
| for the eight ultrahigh polarisation sources; | |||||||
| Column (8): Kolmogorov–Smirnov test statistic D, giving the maximum distance | |||||||
| between the normalised cumulative distributions of the two samples; | |||||||
| if D, then the null hypothesis of the two distribution being the | |||||||
| same can be rejected at the 10 per cent level. | |||||||