Instituto de Astrofísica de La Plata, CCT La Plata-CONICET-UNLP
Paseo del Bosque S/N (1900), La Plata, Argentina.
Impactor Flux and Cratering on the Pluto-Charon System
Abstract
Aims. We study the impactor flux and cratering on Pluto and Charon due to the collisional evolution of Plutinos. Plutinos are those trans-Neptunian objects located at 39.5 AU, in the 3:2 mean motion resonance with Neptune.
Methods. To do this, we develop a statistical code that includes catastrophic collisions and cratering events, and takes into account the stability and instability zones of the 3:2 mean motion resonance with Neptune. Moreover, our numerical algorithm proposes different initial populations that account for the uncertainty in the size distribution of Plutinos at small sizes.
Results. Depending on the initial population, our results indicate the following. The number of 1 km Plutinos streaking Pluto over 3.5 Gyr is between 1 271 and 5 552. For Charon, the number of 1 km Plutino impactors is between 354 and 1 545. The number of km craters on Pluto produced by Plutinos during the last 3.5 Gyr is between 43 076 and 113 879. For Charon, the number of km craters is between 20 351 and 50 688. On the other hand, the largest Plutino impactor onto Pluto has a diameter between 17 and 23 km, which produces a crater with a diameter of 31 – 39 km. In the same way, the largest Plutino impactor onto Charon has a diameter between 10 and 15 km, which produces a crater with a diameter of 24 – 33 km. Finally, we test the dependence of results on the number of Pluto-sized objects in the Plutino population. If 2 Pluto-sized objects are assumed in the 3:2 Neptune resonance, the total number of Plutino impactors both onto Pluto as Charon with diameters 1 km is a factor of 1.6 – 1.8 larger than that obtained considering only 1 Pluto-sized object in this resonant region.
Conclusions. Given the structure of the trans-Neptunian region, with its dynamically different populations, it is necessary to study in detail the contribution of all the potential sources of impactors on the Pluto-Charon system, to obtain the main contributor and the whole production of craters. Then, we will be able to contrast those studies with observations which will help us to understand the geological processes and history of the surface of those worlds.
Key Words.:
methods: numerical – Kuiper Belt: general1 Introduction
Pluto and Charon are members of a vast population of icy bodies beyond Neptune and constitute in fact the first discovered binary trans-Neptunian object (TNO). In the trans-Neptunian region there are at first four dynamical classes (Chiang et al. Chiang2007 (2007)). The Classical Objects those with semimajor axis greater than 42 AU and low eccentricity orbits, the Scattered Disk Objects (SDOs) with perihelion distance AU with large eccentricities, the Resonant Objects those in mean motion resonance with Neptune and the Centaurs with perihelion distance AU.
The 3:2 mean motion resonance with Neptune, located at 39.5 AU, is the most densely populated one in the trans-Neptunian region. The residents of this resonant region are usually called Plutinos because of the analogy of their orbits with that of Pluto, which is its most representative member. Aside from Pluto and its largest moon Charon, the Minor Planet Center (MPC) database contains 200 Plutino candidates.
Pluto and Charon have been exposed to impacts with minor bodies as all the objects in our Solar System. Cratering is one of the most important processes that determine the morphology of the surface of a Solar System object. The understanding and quantification of the impactor source population onto an object and the observation of the object surface help to understand the dynamical and physical history of both the impactor population and the target.
All of the detailed knowledge of the surface composition of Pluto and Charon has been obtained from telescopic observations of the spectrum of sunlight reflected from their surfaces. Pluto’s reflectance spectrum shows absorption bands of methane ice, and an absorption band that could be related to the presence of CO and nitriles. The surface of Charon can be modeled by pure water ice darkened by a spectrally neutral continuum absorber (Protopapa et al. Protopapa2008 (2008)).
However, it will not be until 2015 that we will have a real idea of the morphology of the surfaces of Pluto and Charon, with the fly by of the Nasa’s New Horizon Pluto-Kuiper Belt mission to Pluto system. The New Horizons mission is the first one to the Pluto system and the Kuiper Belt and was launched on 19 January 2006 on a Jupiter Gravity Assist trajectory toward the Pluto system for a 14 July 2015 closest approach. It will study the Pluto system over a 5-month period beginning in early 2015 in particular providing measurement of cratering records.
The comparison of the predicted theoretical crater production from a given source with the observed surface of Pluto and Charon may account for the geological processes acting on the surface of the objects and if cratering collisions onto Pluto and Charon are an important surface modification process.
Then, it is very important to study all the possible sources of crater production on Pluto and Charon in order to know the total crater production and to contrast them with observations.
The possible main contributors to the impactor flux on Pluto and Charon would be on one hand all type of comets. This topic has been addressed by Weissman & Stern (Weissman1994 (1994)), Durda & Stern (Durda2000 (2000)), and Zahnle et al. (Zahnle2003 (2003)). In general comets have eccentric orbits that can cross Pluto’s orbit when they enter to the planetary region from their source, either the trans-Neptunian zone or the Oort Cloud, or when they leave the inner Solar System because of the perturbations of the planets.
Weissman & Stern (Weissman1994 (1994)) estimated current impact rates of comets on Pluto and Charon. They showed that cratering on both bodies is dominated by Kuiper Belt and inner Oort cloud comets. Then, Durda & Stern (Durda2000 (2000)) calculated collision rates in the Kuiper Belt and Centaur region through a numerical model. They estimated that the flux of Kuiper Belt projectiles onto Pluto and Charon is 3 – 5 times that of Weissman & Stern (Weissman1994 (1994)). Later, Zahnle et al. (Zahnle2003 (2003)) studied the cratering rates for the moons of the jovian planets and Pluto produced mainly by ecliptic comets, obtaining results consistent with the previous estimates. We will analyze those studies in a discussion section.
On the other hand, Plutinos may be the other important source of impactors on Pluto and Charon. Plutinos shared the same dynamical conditions that Pluto and Charon, in fact they are all located in the same 3:2 mean motion resonance with Neptune so they have a certain collision probability. Recently, de Elía et al. (deElia2008 (2008)) performed a collisional evolution of Plutinos and determined collisional rates among these objects. That work allows us to study the impactor flux on Pluto and Charon due to the collisional evolution of Plutinos. Then, in this paper we are going to evaluate the contribution of Plutinos to the impactor flux and cratering on Pluto and Charon and also determine if the Plutino population can be considered a primary source of impactors on the Pluto-Charon system.
2 The Full Model
To simulate the collisional and dynamical evolution of the Plutino population, we use the statistical code developed by de Elía et al. (deElia2008 (2008)). This algorithm considers catastrophic collisions and cratering events, and takes into account the main dynamical characteristic associated to the 3:2 mean motion resonance with Neptune. In the following, we give a brief description of the initial populations, the collisional parameters and the main dynamical considerations used in our model.

2.1 Initial Populations
From Kenyon et al. (Kenyon2008 (2008)), the cumulative size distribution of the resonant population of the trans-Neptunian region shows a break at a diameter near 40 – 80 km. Moreover, for larger resonant objects, the population seems to have a shallow size distribution with a cumulative power-law index of 3. From this, the general form of the cumulative initial population used in our model to study the collisional and dynamical evolution of the Plutinos can be written as follows
| (1) |
where adopts a value of 7.9 109 and = (60)p-3 by continuity for = 60 km. The size distribution of Plutinos at small sizes is uncertain and one can find different proposed power law indexes in the literature. Then, following the analysis made by de Elía et al. (deElia2008 (2008)) we use in our model three different initial populations, which are defined as follows
-
•
Initial Population 1, with a cumulative power-law index of 3.0 for 60 km,
-
•
Initial Population 2, with a cumulative power-law index of 2.7 for 60 km,
-
•
Initial Population 3, with a cumulative power-law index of 2.4 for 60 km.
2.2 Collisional Parameters
Here, we adopt constant values of the intrinsic collision probability and the mean impact velocity for Plutinos derived by Dell’Oro et al. (DellOro2001 (2001)). Based on a sample of 46 Plutinos, these authors computed values of and of 4.44 0.04 10-22 km-2 yr-1 and 1.44 0.71 km s-1, respectively.
As for the impact strength, O’Brien & Greenberg (OBrien2005 (2005)) showed that the general shape of the final evolved asteroid population is determined primarily by the impact energy required for dispersal , but variations in the shattering impact specific energy and the inelasticity parameter can affect such a final population even if is held the same. According to these arguments, we decide to choose a combination of the parameters and that yield the law from Benz & Asphaug (Benz1999 (1999)) for icy bodies at 3 km s-1.
de Elía & Brunini (deElia2007 (2007)) analyzed recently the dependence of their numerical simulations on the shattering impact specific energy . According to this work, the smallest gaps between and curves lead to the smallest wave amplitudes in the size distribution of the final evolved population as well as to the highest ejection rates of collisional fragments. Moreover, that study also indicates that the formation of families is more effective for the simulations with a small gap between and laws. Following these arguments, in this work we decide to use two laws, and , with a small and a large gap with respect to the law from Benz & Asphaug (Benz1999 (1999)) for icy bodies at 3 km s-1, respectively. The results discussed in this work are those obtained using the law. In Sect. 3.4, we develop numerical simulations using the law in order to test the dependence of our results on such collisional parameter. Figure 1 shows the two laws used in our simulations as well as the law from Benz & Asphaug (Benz1999 (1999)) for icy bodies at 3 km s-1.
Once the law is specified, we fit the ineslaticity parameter to get the Benz & Asphaug (Benz1999 (1999)) law. According to O’Brien & Greenberg (OBrien2005 (2005)), we express the parameter as
| (2) |
where is the value of at 1 000 km and is a given exponent. Our simulations indicate that the law from Benz & Asphaug (Benz1999 (1999)) for icy bodies at 3 km s-1 is obtained with good accuracy from the combination of the selected law and , with and . Such values are consistent with those from Davis et al. (Davis1989 (1989)).
2.3 Dynamical Considerations
To study the orbital space occupied by the Plutino population, we develop a numerical integration of 197 Plutino candidates extracted from the Minor Planet Center database with semimajor axes between 39 and 40 AU. These objects are assumed to be massless particles subject to the gravitational field of the Sun (including the masses of the terrestrial planets) and the perturbations of the four giant planets. The simulation is performed with the simplectic code EVORB from Fernández et al. (Fernandez2002 (2002)). The evolution of the test particles is followed for 107 years which is a timescale greater than any secular period found in this resonance (Morbidelli Morbidelli1997 (1997)). From this, we build maps of the distribution of Plutinos in the orbital element planes (,) and (,), which allows us to determine the main stability regions of the 3:2 Neptune resonance. Such maps are used to assign a characteristic orbit for every colliding Plutino and to specify the final fates of the different fragments generated in the collisional evolution. A detailed description of this procedure can be found in de Elía et al. (deElia2008 (2008)).
3 Results
The previously described collisional code allows us to calculate the collisional rates of Plutinos onto Pluto and Charon. From this, it is possible to calculate the impactor flux of Plutinos of different sizes on the Pluto-Charon system. Besides, using a suitable expression we can calculate the crater diameters produced by Plutinos on Pluto and Charon. We will present here our main results concerning the impactor flux and cratering onto Pluto and Charon due to the collisional evolution of the Plutino population.
| Initial Pop. 1 | Initial Pop. 2 | Initial Pop. 3 | |
| 5 552 | 2 843 | 1 271 | |
| (Myr) | 0.63 | 1.23 | 2.75 |
| (km) | 22.5 | 20.1 | 16.8 |
| 113 879 | 76 726 | 43 076 | |
| (km) | 38.8 | 35.5 | 30.1 |
| Initial Pop. 1 | Initial Pop. 2 | Initial Pop. 3 | |
| 1 545 | 791 | 354 | |
| (Myr) | 2.27 | 4.42 | 9.9 |
| (km) | 14.6 | 12.5 | 9.8 |
| 50 688 | 34 541 | 20 351 | |
| (km) | 32.7 | 28.9 | 24 |
3.1 Impactor Flux onto Pluto and Charon
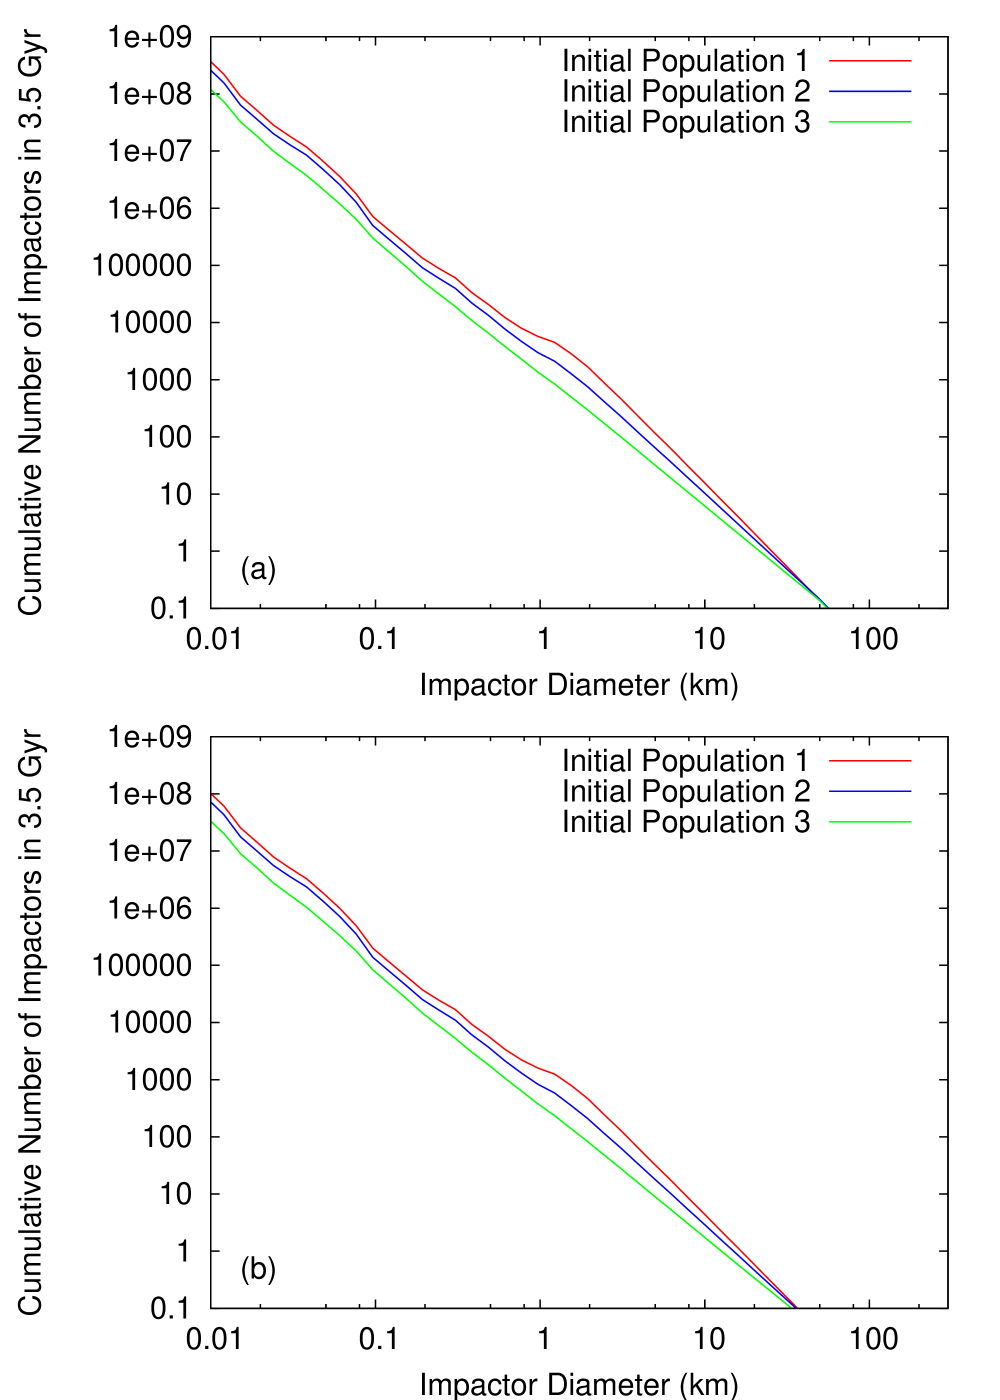
Figure 2 a) shows the cumulative number of Plutino impacts onto Pluto over the last 3.5 Gyr as a function of impactor diameter, obtained from the three different initial populations defined in Sect. 2.1. Moreover, Table 1 summarizes some of our results concerning the impactor flux onto Pluto due to the collisional evolution of Plutinos. From this, the number of 1 km Plutinos striking Pluto over 3.5 Gyr is between 1 271 and 5 552, while the largest Plutino expected to have impacted Pluto during the past 3.5 Gyr had a diameter of 17 – 23 km, depending on the initial size distribution.
On the other hand, Figure 2 b) shows the cumulative number of Plutino impacts onto Charon over the last 3.5 Gyr as a function of impactor diameter. Moreover, results about the impactor flux onto Charon due to the collisional evolution of Plutinos are summarized in Table 2. From this, the number of 1 km Plutinos striking Charon over 3.5 Gyr is between 354 and 1 545, while the largest Plutino expected to have impacted Charon during the past 3.5 Gyr had a diameter of 10 – 15 km, depending on the initial size distribution.
3.2 Cratering on Pluto and Charon
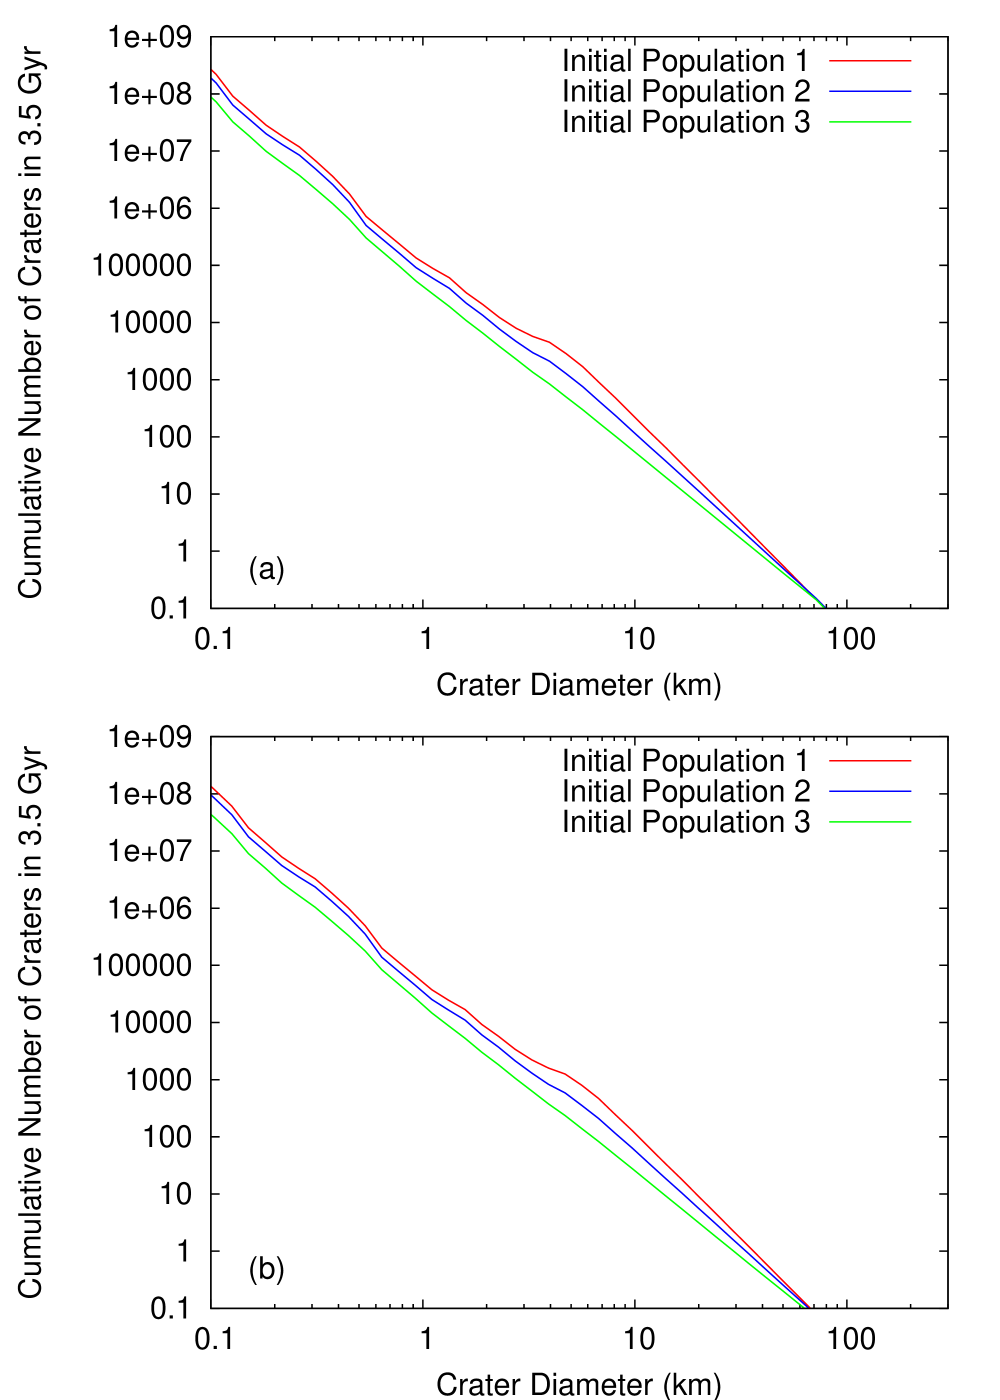
umulative number of craters on Pluto a) and Charon b) produced by Plutinos over the last 3.5 Gyr as a function of crater diameter.
Using the impactor fluxes previously estimated, it is possible to obtain the number of craters on Pluto and Charon over the last 3.5 Gyr as a function of crater diameter. From Holsapple (Holsapple1993 (1993)), the diameter of a hemispherical crater is given by
| (3) |
where is the impactor diameter, the impactor density, the target density, the surface gravity of the target, the encounter velocity, and and are constants which depend on the mechanical properties of the target material. We adopt the values of and given by Holsapple (Holsapple1993 (1993)) for water ice. The encounter velocity is given by
| (4) |
where is the hyperbolic encounter velocity, which is equal to the mean impact velocity given in Sect. 2.2, and is the escape velocity of the target. Values of the density, the surface gravity, and the encounter velocity used for Pluto and Charon are shown in Table 3.
Figure 3 a) shows the cumulative number of craters on Pluto produced by Plutinos over 3.5 Gyr as a function of crater diameter. From this, the number of 1 km craters on Pluto is between 43 076 and 113 879, while the largest crater diameter is between 31 and 39 km, depending on the initial size distribution.
At the same way, Figures 3 b) shows the cumulative number of craters on Charon produced by Plutinos over 3.5 Gyr as a function of crater diameter. From this, the number of 1 km craters on Charon is between 20 351 and 50 688, while the largest crater has a diameter of 24 – 33 km, depending on the initial size distribution.
| Pluto | Charon | |
|---|---|---|
| (g cm-3) | 2.03 | 1.65 |
| (cm s-2) | 66.4 | 27.9 |
| (km s-1) | 1.9 | 1.6 |
3.3 Dependence of results on the number of Pluto-sized objects
Kenyon et al. (Kenyon2008 (2008)) suggested that the resonant trans-Neptunian population has 0.01 – 0.05 in objects with 20 – 40 km. From these estimates, it is possible to infer the existence of 5 Pluto-sized objects in the whole resonant population. If these 5 Pluto-sized objects were all in the 3:2 Neptune resonance, we would have an upper limit for the large objects in this resonance. Brown (Brown2008 (2008)), based on the completeness of the current surveys argued that two or three more large KBOs are likely awaiting discovery. Since the existence of 5 Pluto-sized objects in the 3:2 Neptune resonance would seem to be an overestimation, we assume an upper limit of 2 Pluto-sized objects in this resonant region in order to analyze the dependence of our simulations on the number of large objects in this resonance.
If 2 Pluto-sized objects are assumed in the 3:2 Neptune resonance, the total number of Plutino impactors both onto Pluto as Charon with diameters 1 km is a factor of 1.6 – 1.8 larger than that obtained considering only 1 Pluto-sized object in this resonant region.
3.4 Dependence of results on the shattering impact specific energy
To test the dependence of our results on the shattering impact specific energy , we carry out numerical simulations using the and laws, which show a small and a large gap with respect to the law from Benz & Asphaug (Benz1999 (1999)) for icy bodies at 3 km s-1, respectively. We obtain that the law produces a size distribution with a wave amplitude larger than that the one obtained using the law as was noticed by de Elía & Brunini (deElia2007 (2007)). However, the whole impactor flux is almost preserved using both laws.
4 Discussion
Durda & Stern (Durda2000 (2000)) developed a model of collision rates in the present-day Kuiper Belt and Centaur region. That is a static, multizone and multi-size-bin collision rate model that calculates instantaneous collision rates on Kuiper Belt objects, Centaurs and the Pluto-Charon system.
The model of Durda & Stern (Durda2000 (2000)) defines a disk in the 30–50 AU zone whose surface mass density follows a profile of the form , with -2. Moreover, the disk adopts an average eccentricity and assumes an equilibrium condition where the average inclination . The values adopted for are of 0.0256 and 0.2048, which are representative of the values observed in the Kuiper Belt at that time. Once the disk properties are specified, the disk is binned into a series of radially concentric tori 1 AU in width in each of which the size distribution of the population is represented by a two-component power law of the form , where for 10 km and for larger bodies. Durda & Stern (Durda2000 (2000)) carried out their runs assuming the existence of 7 104–1.4 105 objects with a radius 50 km between 30 and 50 AU, according to the observational evidence from Jewitt et al. (Jewitt1998 (1998)) and Gladman et al. (Gladman1998 (1998)). Moreover, they suggested that about 40 % of the total population are in or near the 3:2 mean motion resonance with Neptune. From this, the flux of km Kuiper Belt projectiles onto Pluto and Charon over 3.5 Gyr is found to be approximately 8.9 103 and 1.1 103, respectively.
However, the observational advances that have occurred during the last ten years have revealed a more complex dynamical structure of the trans-Neptunian region. In particular in the region between 30 and 50 AU there are very different dynamical classes of TNOs, like the classical, resonant, and scattered-disk populations. They show different dynamical features and ranges of orbital elements as well defined semimajor axis zones, eccentricities as high as and inclinations as high as . Moreover, current data provide clear evidence for differences in the mass and size distribution parameters among such dynamical classes (Kenyon et al. Kenyon2008 (2008)). The results by Durda & Stern (Durda2000 (2000)) are obtained for objects in that region, but they don’t account for the different dynamical populations. Particularly, while the Plutino population is included quantitatively in Durda & Stern’s (Durda2000 (2000)) model, they did not account for the dynamical properties of such resonant population. Then, their results should be taken with caution.
5 Conclusions
We have presented a study aimed at analyzing the collisional and dynamical evolution of the Plutinos. Assuming the existence of one Pluto-sized object in the 3:2 Neptune resonance, our main results are the following.
Our results depend strongly on the initial size distribution of Plutinos. Depending on the initial population, we have obtained that the number of 1 km Plutinos streaking Pluto over 3.5 Gyr is between 1 271 and 5 552. For Charon, the number of 1 km Plutino impactors is between 354 and 1 545. Moreover, the number of km craters on Pluto produced by Plutinos during the last 3.5 Gyr is between 43 076 and 113 879. For Charon, the number of km craters is between 20 351 and 50 688. On the other hand, the largest Plutino impactor onto Pluto has a diameter between 17 and 23 km, that produces a crater with a diameter of 31 – 39 km. The largest Plutino impactor onto Charon has a diameter between 10 and 15 km, that produces a crater with a diameter of 24 – 33 km.
We have tested the dependence of results on the number of Pluto-sized objects in the Plutino population. The number of Plutino impactors on Pluto and Charon obtained considering 2 Pluto-sized objects is a factor of 1.6 – 1.8 larger than that obtained considering only 1 Pluto-sized object in this resonant region.
Besides, using two different laws, with a small and a large gap with respect to the law, we have obtained almost the same impactor flux onto Pluto and Charon.
The complex structure of the trans-Neptunian region, with its dynamically different populations, requires a detailed study of the contribution of all the potential sources of impactor on the Pluto-Charon system, to obtain the main contributor and the whole production of craters. When Nasa’s New Horizon Pluto-Kuiper Belt mission flies by Pluto system we will have images of the surface and cratering records could be measured. Then, we will be able to contrast the theoretical studies of the production of craters with the observations of the New Horizon mission which will help us to understand the geological processes and history of the surfaces of those worlds. In a future work we will calculate the contribution of the different dynamical classes of the trans-Neptunian region to the flux of projectiles onto Pluto and Charon. From this, it would be possible to specify the primary source of impactors on such bodies and to determine if the Plutino population can be considered a significant source.
References
- (1) Benz, W., & Asphaug E. 1999, Icarus, 142, 5
- (2) Brown, M. E. 2008, in The Solar System Beyond Neptune, (Barucci, M. A., Boehnhardt, H., Cruikshank, D. P., and Morbidelli, A., Eds.), University of Arizona Press, Tucson, USA, 335
- (3) Chiang, E., Lithwick, Y., Murray-Clay, R., Buie, M., Grundy, W., & Holman, M. 2007, in Protostars and Planets V, (Reipurth, B., Jewitt, D., and Keil, K., Eds.), University of Arizona Press, Tucson, USA, 895
- (4) Davis, D. R., Weidenschilling, S. J., Farinella, P., Paolicchi, P., & Binzel, R. P. 1989, in Asteroids II, (Binzel, R. P., Gehrels, T., and Matthews, M. S., Eds.), University of Arizona Press, Tucson, USA, 805
- (5) de Elía, G. C., & Brunini, A. 2007, A&A, 475, 375
- (6) de Elía, G. C., Brunini, A., & Di Sisto, R. P. 2008, A&A, 490, 835
- (7) Dell’Oro, A., Marzari, F., Paolicchi, P, & Vanzani, V. 2001, A&A, 366, 1053
- (8) Durda, D. D., & Stern, S. A. 2000, Icarus, 145, 220
- (9) Fernández, J. A., Gallardo, T., & Brunini, A. 2002, Icarus, 159, 358
- (10) Gladman, B., Kavelaars, J. J., Nicholson, P. D., Loredo, T. J., & Burns, J. A. 1998, AJ, 116, 2042
- (11) Holsapple, K. A. 1993, Annu. Rev. Earth Planet. Sci., 21, 333
- (12) Jewitt, D., Luu, J. X., & Trujillo, C. 1998, AJ, 115, 2125
- (13) Kenyon, S. J., Bromley, B. C., O’Brien, D. P., & Davis, D. R. 2008, in The Solar System Beyond Neptune, (Barucci, M. A., Boehnhardt, H., Cruikshank, D. P., and Morbidelli, A., Eds.), University of Arizona Press, Tucson, USA, 293
- (14) Morbidelli, A. 1997, Icarus, 127, 1
- (15) O’Brien, D. P., & Greenberg, R. 2005, Icarus, 178, 179
- (16) Protopapa, S., Boehnhardt, H., Herbst, T. M., Cruikshank, D. P., Grundy, W. M., Merlin, F., & Olkin, C. B. 2008, A&A, 490, 365
- (17) Weissman, P. R., & Stern, S. A. 1994, Icarus, 111, 378
- (18) Zahnle, K., Schenk, P., Levison, H., & Dones, L. 2003, Icarus, 163, 263