Cross-correlation markers
in stochastic dynamics of complex systems
Abstract
The neuromagnetic activity (magnetoencephalogram, MEG) from healthy human brain and from an epileptic patient against chromatic flickering stimuli has been earlier analyzed on the basis of a memory functions formalism (MFF). Information measures of memory as well as relaxation parameters revealed high individuality and unique features in the neuromagnetic brain responses of each subject. The current paper demonstrates new capabilities of MFF by studying cross-correlations between MEG signals obtained from multiple and distant brain regions. It is shown that the MEG signals of healthy subjects are characterized by well-defined effects of frequency synchronization and at the same time by the domination of low-frequency processes. On the contrary, the MEG of a patient is characterized by a sharp abnormality of frequency synchronization, and also by prevalence of high-frequency quasi-periodic processes. Modification of synchronization effects and dynamics of cross-correlations offer a promising method of detecting pathological abnormalities in brain responses.
pacs:
02.70.Bf, 05.45.Tp, 87.50.-a, 89.75.-kI Introduction. Synchronization and collective effects in time series analysis of complex systems
One of the main factors determining the evolution of complex systems is the presence of collective effects arising from an interacting or redistributing of the certain connections between parts of composite system. In many cases it is impossible to make an adequate analysis of the functions of the systems by ignoring the underlying collaborative mechanisms.
There are various approaches used in studying the collective phenomena in complex systems. Somehow or other, all of them are based on the analyzing unique features of the connected systems: certain quantitative and qualitative ratios between the system elements, a dynamic coordination of components under the external influences, specific synchronization phenomena. Some recent results have been derived by studying the effects of frequency and phase synchronization Gilb ; Morm1 ; Quan ; phase ; Wavel . These methods are based on revealing the characteristic frequencies and analyzing the differences in the phases of dynamic variables derived by means of the Fourier transform, Hilbert transform Gilb ; Morm1 ; phase and wavelet-transform Wavel . Within the framework of another methodology the stochastic synchronization is studied by comparing topological structures of attractors, describing the dynamics of two nonlinear coupled oscillators Stoch . The “generalized synchronization” relationship Rulk also uses the topological method and is the successful original development of the stochastic synchronization approach.
Another approach to study the collective effects in complex systems is the analysis of cross-correlations, i.e. the probabilistic relation between the sequences of random variables. The cross-correlation method is used to describe the collective phenomena in various systems (physical, economical, biological and physiological). The perspective approach in this field of research is detrended cross-correlation analysis, which has been introduced in Poprl to study the power-law cross-correlations between nonstationary time series of various nature. This method is widely used in financial systems Zhou ; Popnas ; Poeur .
There are several alternative methods to analyze cross-correlations, particularly, random matrix theory Pler , approximate entropy Pinc and sample entropy Moor . In Pler , the authors used random matrix theory, a method originally developed to study the spectra of complex nuclei, to analyze the mutual dynamics in price changes of the stocks. In Pinc , the authors used the method of approximate entropy, a model independent measure of sequential irregularity which is based on Kolmogorov entropy, as an indicator of system stability. In Moor , the authors proposed the sample entropy, a modified and unbiased version of approximate entropy, as a measure of degree of asynchrony in physiological signals.
Although these earlier methods find useful applications in real-life time series, there exists another set of methods in cross-correlation analysis which uses the cross-correlation functions itself Quan ; Ginz ; Long . In paper Quan , the authors compared the linear synchronization measures including the cross-correlation functions to nonlinear ones and revealed that for the considered experimental data all measures ranked the synchronization levels of the three examples in the same way. In work Ginz , the authors develop a theory of neuronal cross-correlation functions for analyzing the neuron interactions in large neural networks including several highly connected sub-populations of neurons. In work Long , the authors developed a method based on the model of fractional Brownian motion and Hurst exponent to describe the coupling of the non-stationary signals with long-range correlations.
In this study, we demonstrate the fundamentally new opportunities of studying the collective effects in complex systems. Our method is based on generalization of the memory functions formalism rmy1 ; rmy2 in a case of cross-correlations between the spaced elements of the studied system. The important advantage of this method is the description of the cross-correlations in different relaxation scales in the time series of a complex systems. Here, we consider neuromagentic responses (magnetoencephalogram, MEG) of brain as a suitable example of a time series of a complex system, i.e. the human brain. Earlier analysis of MEG signals rmy3 were performed on the basis of the memory functions formalism (MFF), and revealed an important autocorrelation difference between MEG signals of healthy subjects and of a patient with photosensitive epilepsy (PSE). Particularly, this difference appears in qualitative alterations of the power spectra of memory functions. Besides, it has been shown that the statistical memory effects play a key role in identification of PSE.
Here we investigate cross-correlations in the MEG responses simultaneously obtained from multiple brain regions. We will show that mechanisms of formation of the PSE are connected, first of all, with abnormality of interrelations between the spaced areas of a cerebral cortex, which result in suppression of its regulator functions at formation of the response to external influences. The paper is structured as follows. Section 2 presents the basic relations of the memory functions formalism for cross-correlations. Section 3 details the experimental details. Section 4 contains our results including the calculation of cross- correlation functions, memory functions and their power spectra. Section 5 offers the general conclusions about connections between the PSE pathological alterations and suppression of coordination effects (frequency-phase synchronization).
II Basic relations of the memory functions formalism in case of cross-correlations
Following rmy1 ; rmy2 ; rmy3 ; Gasp , we consider stochastic dynamics of the magnetic induction gradient, registered in two different brain regions as the sequences of random values :
| (1) | ||||
where is the initial time point, is the time period of signal registration, is the time interval of signal discretisation.
Mean values, fluctuations and dispersions for a set of random values (1) can be written as follows
To describe the probabilistic relation between the sequences of random variables and we use the normalized time-dependent cross-correlation function (CCF):
| (2) |
Function (2) satisfies the conditions of normalization and relaxation of correlations:
It should be noted that the second property not always satisfied for the real time series of complex systems.
Taking into account the fact that the process is discrete, we must rearrange all standard operation of differentiation and integration diskr1 ; diskr2 :
| (3) | ||||
Following rmy1 ; rmy2 ; rmy3 , to describe the dynamics of studied variables let’s introduce the evolution operator :
| (4) | |||
Using Eqs. (3) and (4), we can establish a formal equation of motion for any and :
| (5) | |||
and then introduce a Liouville’s quasioperator as follows:
| (6) | ||||
Analogously by rmy1 ; rmy2 ; rmy3 ; Gasp , let’s present the sets of fluctuations where as the -component vectors of system state in Euclidean space of the vectors of state:
| (7) | ||||
-component vectors of system state in time moment : , are arose by the time shift on step :
| (8) | ||||
These vectors can be derived by multifold actions of the evolution operator to vectors of the initial system state:
| (9a) | |||
| (9b) | |||
Further we will introduce the scalar product operation:
Using the Eqs. (2) – (9b), we can rewrite equation for CCF as a scalar product of vectors and :
| (10) |
Let’s write the finite-difference Liouville’s equation for the state vectors (see (6)):
| (11) |
Let’s introduce the operators of projection and for the Euclidean space of state vectors:
| (12) |
The initial CCF (10) can be derived by projection of state vector to vector of the initial system state :
Projection operators and split the Euclidean vector space into two mutually-orthogonal subspaces:
This permits to split Liouville’s equation (11) into two equations within two mutually supplementary subspaces as follows:
| (13a) | |||
| (13b) | |||
Here are the matrix elements of Liouville’s quasioperator:
To transit between the subspaces the operators are used in the following way:
Solving the Eq. (13b) and using the derived results in Eq. (13a) we come to the closed finite-difference discrete equation for the initial CCF (se for details rmy1 ):
| (14) |
Here is an eigen frequency of Liouville’s quasioperator , is a relaxation parameter with the dimension of squared frequency, is a normalized cross-correlation memory function of the first order:
| (15) |
Using Eqs. (10) – (14), we can introduce a set of projection operators and and derive a chain of equations for cross-correlation memory functions of the order:
| (16) |
To derive the kinetic and relaxation parameters and also memory functions we will use the Gram-Schmidt orthogonalization procedure: , where is Kronecker’s symbol. Using it we may easily introduce the recurrence formula for the dynamic orthogonal variables , in which the senior values are connected with the junior values:
Then the eigenvalues of Liouville’s quasioperator and relaxation parameters in Eq. (16) will be:
Normalized cross-correlation memory function in (16) will be:
A relaxation time of the initial CCF and memory functions of the order are determined as follows:
| (17) |
The set of dimensionless values will determine the statistical spectrum of non-Markovian parameter, the informational measure of memory:
| (18) |
Thus the value is an useful criterium for comparison of relaxation times of the memory functions and . This quantitative criterion characterizes quantitatively the degree of Markovity of the processes and the memory effects in discrete dynamics of complex systems.
In this paper we use the frequency-dependent case of information memory measure:
| (19) |
Here is a power spectrum of th memory function:
The preliminary analysis of experimental series of complex systems shows, that the special interest for analyzing the statistical memory effects represents the ultralow frequency area of the information characteristic :
| (20) |
This area determines the long range correlations in experimental series , .
III Registration of neuromagnetic activity in human cerebral cortex
The analyzed MEG signals PSE1 ; PSE2 are the induced neuromagnetic responses obtained from a group of neurologically healthy participants and of a patient diagnosed with PSE while they were viewing flickering stimuli with various chromatic combintions. The PSE is a form of reflexive epilepsy in which the seizures are provoked by various forms of visual stimuli. Amongst various parameters of a visual stimulus, chromaticity is less studied in the context of PSE, yet flickering colourful stimuli are quite widespread in modern technical age laden with multimedia gadgets. In previous works PSE1 ; PSE2 , the authors used the whole-head MEG system (Neuromag-122, Neuromag Ltd. Finland) by means of 61 SQUID-sensors (superconducting quantum interference device) and recorded neuromagnetic brain responses from nine healthy or control subjects (age range 22–27 yrs) and a patient with PSE (age 12 yr). Subjects of control group had no personal or family history of photosensitive epilepsy. All subjects were explicitly informed that flicker stimulation might lead to epileptic seizures. In order to limit the health risk, stimuli with only short duration (2 s) was used. All participants gave their written informed consent before recording. Adequate clinical protocol was maintained during the recording from the patient. The subjects were instructed to passively observe visual stimuli with minimal eye movement. Visual stimuli (red-blue, red-green) were generated by using two video projectors (Sharp XV-E500, Japan), each of which produced a continuous single color. For each trial, the flickering stimulus was presented for 2 s; the gap between trials was 3 s. Evoked MEG responses were obtained by traditional averaging technique across artifact-free trials; at least 80 artifact-free trials were averaged for each stimulus. The sampling frequency was 500 Hz.
To study cross-correlations from various combinations of the MEG signals, we have chosen a subset of sensors from selected brain regions as follows: occipital (sensor no. 51, 52, 53), left-temporal (No. 30, 34) and right-temporal (No. 56, 57). Our choice is determined by the physiological mechanism of processing and transferring the visual information in a brain. The visual cortex, in which the signals are transferred from the retina via thalamus, is in occipital area. Temporal areas play an important role in the perception of the information, including visual one. Out of three chromatic flickering stimuli (Red-Blue, Blue-Green, and Red-Green), we have chosen to analyze the MEG signals against Red-Blue flickering stimulus only, as this was shown to cause the largest neuromagnetic responses PSE1 ; PSE2 . For the generalized description of dynamics of the cross-correlations we consider the sixth subject from control group.
IV Cross-correlations in induced neuromagnetic activity of human brain
IV.1 The PSE-induced stratification of phase clouds of the dynamic orthogonal variables
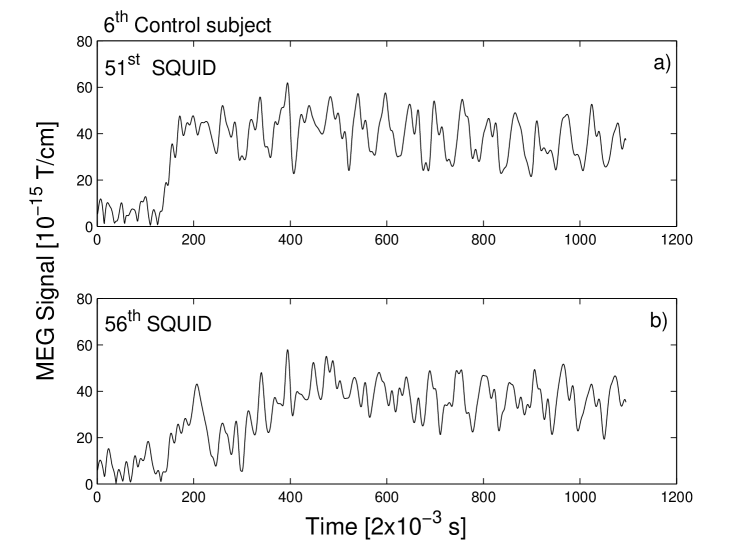
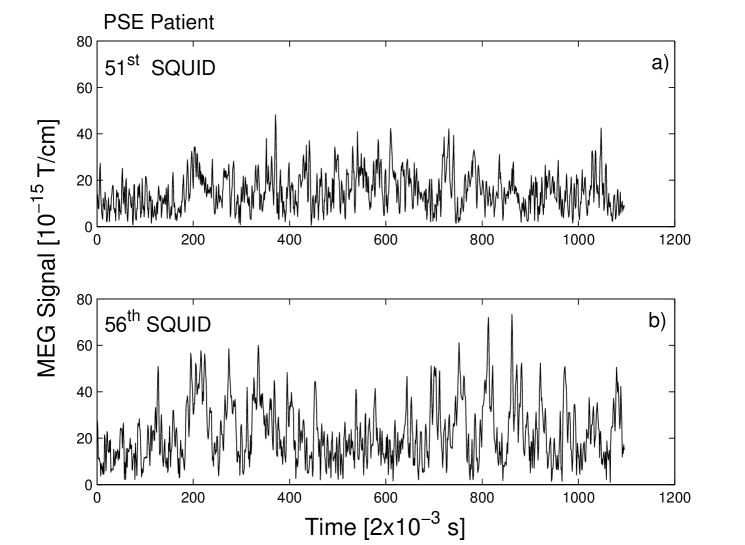
Figs. 1, 2 contain the initial time series registered by the 56th (right-temporal area) and the 51st (occipital area) SQUIDs of the healthy subject (Fig. 1) and the patient with PSE (Fig. 2). MEG dynamics of healthy subject is characterized by the significant large-scale fluctuations while in patient the small-scale fluctuations are manifested against the background of quasi-periodic oscillations. Quasi-periodic structure of the signal in Fig. 1 is directly connected with the physiological rhythms of electromagnetic brain activity in healthy subject. In the first 200 ms the flickering stimulus is switched off, the control signal is registered. It is characterized by smaller amplitude of the fluctuations in initial time series. Switching-on of the flickering stimulus causes the increasing of average value of signals in healthy subject, and in patient’s signals that causes the more significant fluctuations.
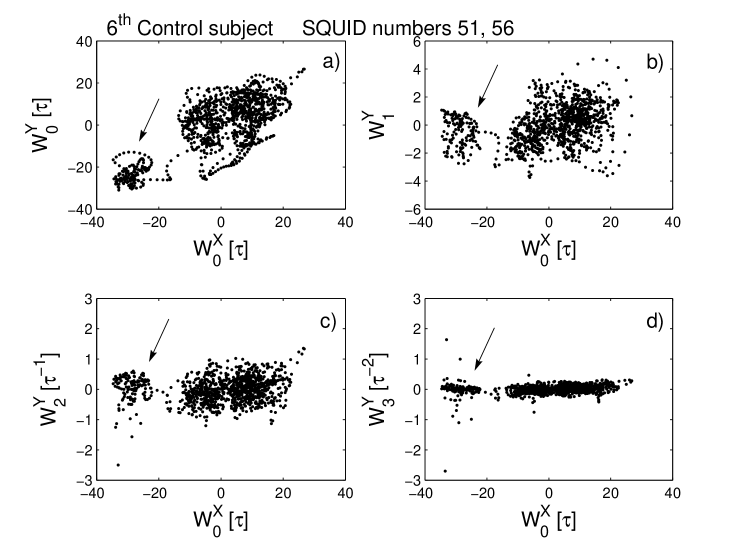
Figs. 3, 4 demonstrate the plain phase projections of the phase clouds of dynamic orthogonal variables , where . To represent the generalized view of phase portraits of possible combinations of the dynamic orthogonal variables we have chosen first four of them. On phase portraits for healthy subject’s brain signals (Fig. 3) two phase areas similar on structure are distinctly manifested. Smaller of them (it is shown by the arrow) corresponds to the magnetic field dynamics when the flickering stimulus is switched off. Switching-on of stimulus causes the occurrence of transition between the phase cloud areas that is connected with changes of amplitude in initial signals (Fig. 1).
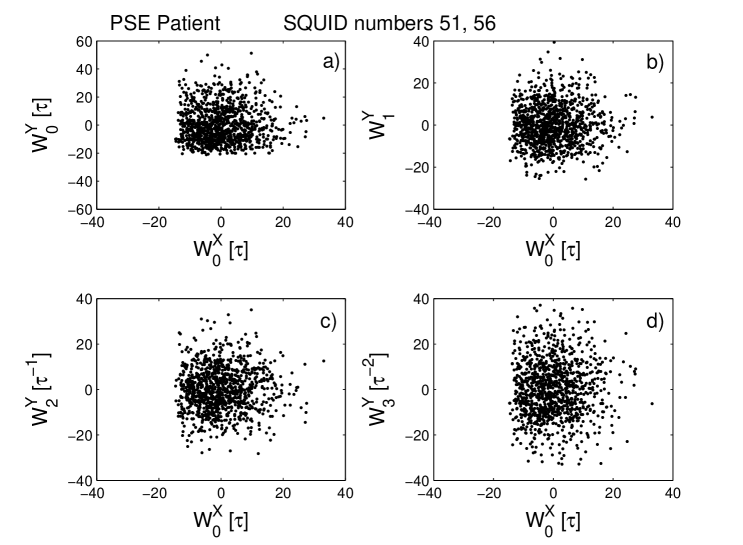
Other picture is observed in the phase portraits of brain signals in patient with PSE (Fig. 4). First, phase clouds have bigger sizes than those for the healthy subject. Secondly, they have stratified structure concerning the central nucleus. It means, that switching-on of stimulus does not cause the appreciable phase changes in dynamics of the brain signals.
IV.2 Spectral cross-correlation properties of human neuromagnetic responses
Power spectra of used cross-correlation functions for the studied neuromagnetic signals allow to extract unique information about the collective phenomena in brain functioning.
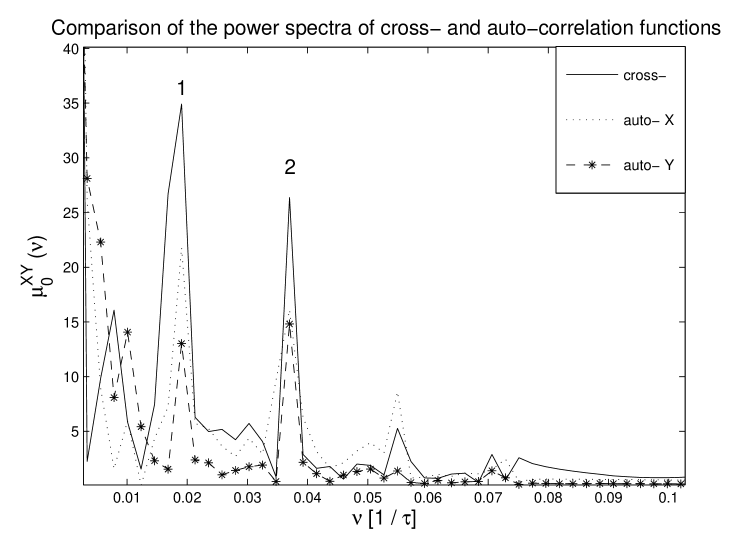
To demonstrate the general mechanisms of coordination in cerebral cortex signals we present power spectra of auto correlation functions for two signals and power spectrum of respective cross-correlation function in Fig. 5. These dependencies are derived for neuromagnetic responses of one of the healthy subjects. Their comparison distinctly detects the increasing of respective peaks in CCF power spectrum (see, for example, peaks 1 and 2). Actually, we reveal here a frequency-phase synchronization between the cerebral cortex signals as a response to color flickering influence. Thus analysis of the initial CCF power spectra allows to detect synchronization of the brain signals and reveal its frequencies.
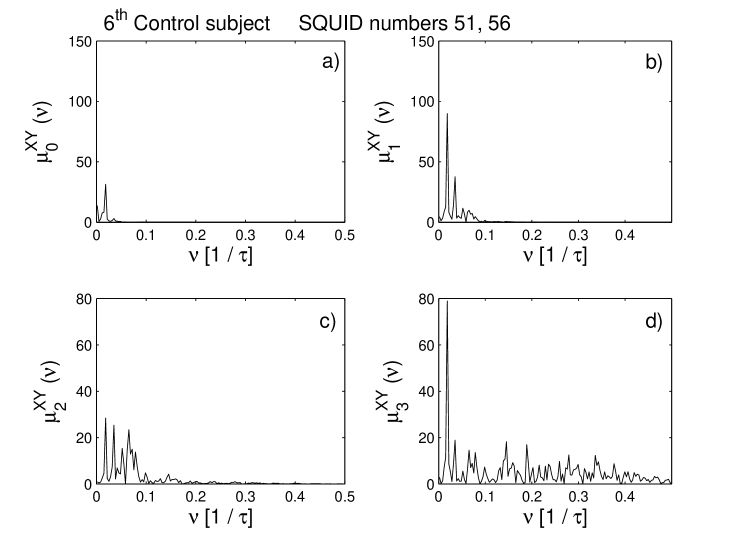
Power spectra of initial CCF and respective memory functions for the brain signals of healthy subject (Fig. 6) are characterized by two peaks. The most significant of them is in the frequency 9.18 Hz, i.e. it is within the frequency range of normal brain rhythms. These rhythms reflect the complex psycho-physiological processes of brain activity. Therefore strong change of their characteristic frequencies is the indicator of functioning abnormalities in human brain and the central nervous system. The second peak has frequency of 17.56 Hz. Besides memory functions power spectra contain the additional peaks in higher frequencies. They reflect specific features of the brain bioelectric activity. Note, that their frequencies are multiple of 8.3 Hz, i.e. of frequencies of the normal brain physiological rhythms. The analysis of CCF and memory functions power spectra derived for combinations of control group signals, shows, that all principal peaks are in the field of low frequencies (up to 50 Hz), and the highest peaks have frequency of 8 - 12 Hz. Thus, the frequency-phase synchronization of brain signals in healthy people occurs in a low-frequency range.
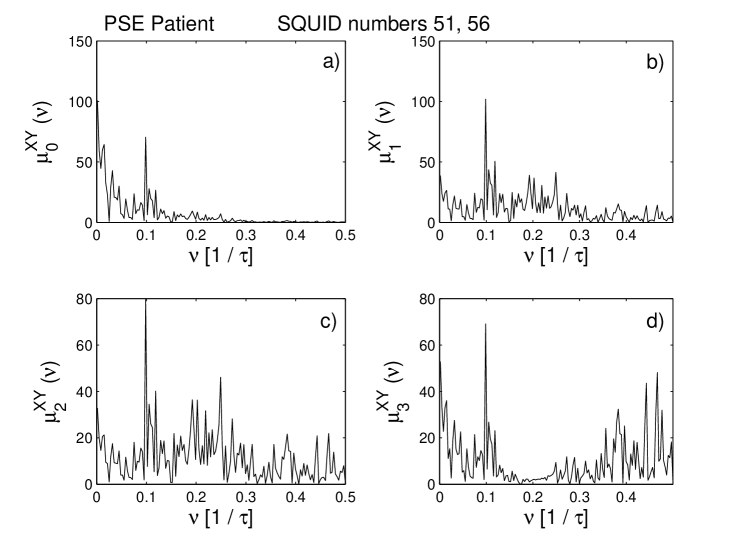
Just the opposite picture is observed in power spectra of cross-correlation functions for brain signals of the patient with PSE (Fig. 7). Peaks fill in all range of frequencies. Thus the process with frequency of 49.33 Hz is dominating. Spectra in all relaxation levels have the same kind.
Specific character in interaction of brain signals of the patient with photosensitive epilepsy reflects abnormalities in reaction to flickering stimulus. Considered power spectra allow to take apart the development of abnormal high neuron collective activity of spaced cerebral cortex areas, as an pathological reaction to visual influences, resulting in epileptic seizure. At the same time in healthy people we reveal the original protective mechanism blocking the development of such reaction. At PSE the suppression of this mechanism is reflected in domination of more high-frequency processes on intensity comparable with the normal physiological rhythms.
IV.3 Differentiation of intensity of the statistical memory at PSE
To reveal the crucial role of statistical memory effects in cerebral cortex activity at PSE we shall use the cross-correlation information measure of memory . At first the non-Markovian parameter was introduced in statistical physics of condensed matter Shu1 ; Shu2 , however later it proved itself in detecting the physical mechanisms of abnormal functioning of live systems rmy1 ; rmy2 ; rmy3 .
Both non-Markovian parameter and its generalization for cross-correlation analysis allow to characterize the degree of statistical memory effects in long-range component of discrete dynamics. If , then the Markovian components dominate in dynamics of stochastic processes. In this case the time of memory existence is too much shorter than relaxation time of initial CCF. The weak (short) statistical memory is manifested. Decrease of this information measure characterizes the expansion of memory lifetime. means that the processes are characterized by long-range (strong) statistical memory. In this case the time of memory existence is covariant with the relaxation time of initial CCF. When we can consider the studied processes to be quasi-Markovian with moderate (intermediate on time existence) statistical memory. Thus, the introduced quantitative criterium allows to parameterize the memory effects intensity and the velocity of loss of relaxation processes.
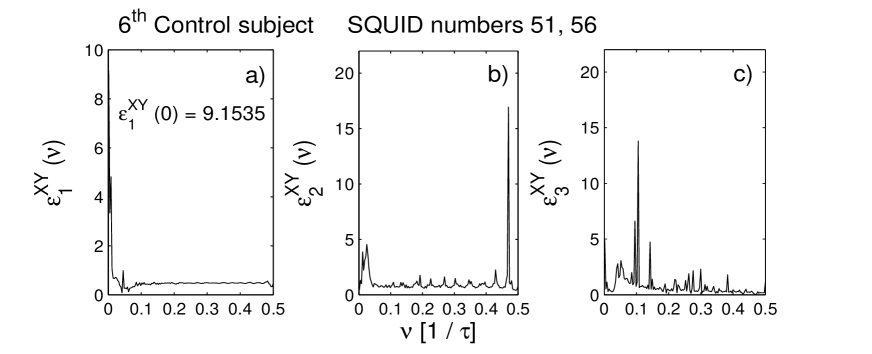
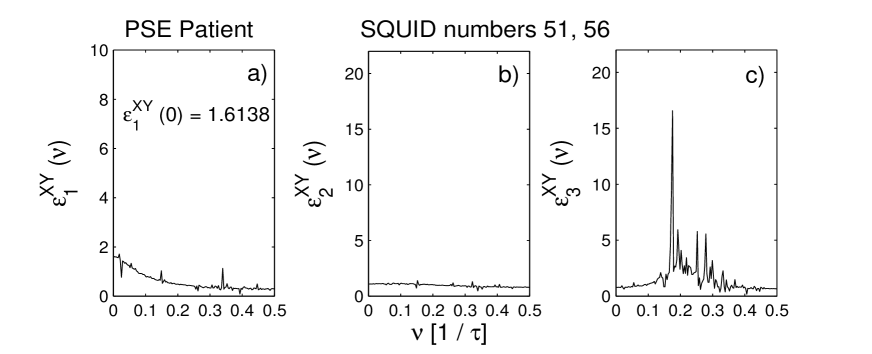
In Figs. 8, 9 we have presented the frequency spectra of information measures of memory , where , for neuromagnetic responses of spaced SQUIDs No. 51, No. 56. Statistical memory intensity in time intervals about length of initial series is determined by the low-frequency areas, and the high-range frequencies correspond to smaller time scales. To study the general manifestations of statistical memory effects in initial time series we shall consider only the parameter . For healthy subject the value of this parameter is . It means that the statistical memory effects are decreased in scales of time series length at the same time. For patient the parameter value is . Frequency dependences of in case of healthy subject (see Figs. 8b, c) are characterized by the significant peaks in low- and high-frequency ranges against the background of general oscillation structure with aliquot frequencies. At PSE (Figs. 9b, c) such structure of information measures spectra is depressed.
To study the general character of statistical memory manifestation in the dynamics of neuromagnetic responses of spaced cerebral cortex areas we derived the ratios of averaged values of the information measure for control group and respective value for patient with PSE. These ratios are derived for all combinations of considered SQUIDs and are presented in Table 1. Analysis of the presented values allows to divide the SQUIDs combinations into three groups:
| SQUID | 30 | 34 | 56 | 57 |
| 51 | 4.22 | 24.10 | 6.03 | 20.48 |
| 52 | 0.92 | 1.45 | 0.72 | 2.42 |
| 53 | 3.69 | 37.35 | 4.28 | 3.40 |
-
1.
SQUID combinations: 52-30, 52-34, 52-56, 52-57. The differences in information measures are less than of equal to 2.5 times. At PSE the coupling of signals, generated by these cerebral cortex areas, considerably does not change.
-
2.
SQUID combinations: 51-30, 51-56, 53-30, 53-56, 53-57. At PSE the mutual dynamics of neuromagnetic responses, generated by these areas is characterized by the significant increase of memory effects, that may be considered as the diagnostic indicator of pathological changes.
-
3.
Finally the mutual behavior of signals, registered by SQUIDS 51-34, 51-57, 53-34 is characterized by the most dramatic (in 20 – 37.5 times) increase of statistical memory intensity at PSE. Coupling of these areas changes most strongly.
Actually, parameter allows to quantitative differ the manifestation of statistical memory effects in mutual dynamics of neuromagnetic responses in patient with PSE. Thus the possibility of revealing the peculiar zones of anomalous collective neuron excitation (as an example, SQUID No. 51) at PSE, at which the depression of brain regulator functions, as a response to flickering color stimuli occurs. Note that earlier in paper rmy3 some conclusions have been made about the PSE’s abnormalities of MEG signal co-ordinations at influence of flickering stimuli.
V Conclusion. The role of cross-correlations and collective effects in complex systems
Time signals generated by a complex system contain the unique information about its organization and character of couplings between its constituent systems. Therefore a representation of this information as a set of variables, i.e. parametrization of complex systems dynamics, is crucial to understand the complex system. To analyze the quantitative and qualitative parameters of the mutual dynamics of complex system, we here use the cross-correlation functions.
To study the mechanisms of collective phenomena in dynamics of cerebral cortex, we analyze MEG signals from healthy healthy subjects and a patient with PSE while viewing chromatic flickering stimuli, we have used generalization of memory functions formalism in case of cross-correlation analysis.
Analysis of cross-correlations and collective effects in the mutual dynamics of MEG responses reveals a protective mechanism present in healthy brain, which acts against adverse external perturbations and manifests in certain regime of frequency-phase synchronization. In healthy subjects this mechanism blokes the developing of epileptic reaction to the influence of flickering light. In this case power spectra of the initial cross-correlation function and memory functions demonstrate a clear dominance of the low-frequency processes in coupling of MEG responses, respective to the normal brain rhythms. At the same time the high-frequency processes become dominant in the MEG responses brain signals of the patient with PSE. Therefore it is reputed that the substitution of low-frequency synchronization of the MEG signals by high-frequency synchronization at flickering light influence is an reliable indicator of PSE.
The proposed analysis has offered not only a new insight into the character of the pathological changes in patient’s brain responses but also reveals a high degree of individuality in neuromagnetic brain responses.
VI Acknowledgments
This work is supported by Russian Foundation for Basic Research (Grant No. 08-02-00123-a). We thank K. Watanabe and S. Shimojo for the experimental data. We also thank Anatolii V. Mokshin and Ramil M. Kusnutdinoff for their help with numerical computations and Elvira R. Nigmatzyanova for technical assistance.
References
- (1) M. Rosenblum, A. Pikovsky, J. Kurths, Phase synchronization of chaotic oscillators, Phys. Rev. Lett. 76 (1996) 1804-1807.
- (2) F. Mormann, K. Lehnertz, P. David, C. E. Elger, Mean phase coherence as a measure for phase synchronization and its application to the EEG of epilepsy patients, Phys. D 144 (2000) 358-369.
- (3) R.Q. Quiroga, A. Kraskov, T. Kreuz, P. Grassberger, Performance of different synchronization measures in real data: A case study on electroencephalographic signals, Phys. Rev. E 65 (2002) 041903-1-14.
- (4) A.G. Rossberg, K. Bartholomé, H.U. Voss, J. Timmer, Phase synchronization from noisy univariate signals, Phys. Rev. Lett. 93 (2004) 154103-1-4.
- (5) J.-P. Lachaux, E. Rodriguez, J. Martinerie, F.J. Varela, Measuring phase synchrony in brain signals, Hum. Brain Mapp. 8 (1999) 194-208.
- (6) V.S. Afraimovich, N.N. Verichev, M.I. Rabinovich, Stochastic synchronization of oscillation in dissipative systems, Izv. Vyssh. Uchebn. Zaved., Radiofiz. 29 (1986) 1050-1060 (in Russian).
- (7) N.F. Rulkov, M.M. Sushchik, L.S. Tsimring, H.D.I. Abarbanel, Generalized synchronization of chaos in directionally coupled chaotic systems, Phys. Rev. E 51 (1995) 980-994.
- (8) B. Podobnik, H.E. Stanley, Detrended cross-correlation analysis: a new method for analyzing two nonstationary time series, Phys. Rev. Lett. 100 (2008) 084102-1-4.
- (9) W.-X. Zhou, Multifractal detrended cross-correlation analysis for two nonstationary signals, Phys. Rev. E 77 (2008) 066211-1-4.
- (10) B. Podobnik, D. Horvatić, A.M. Petersen, H.E. Stanley, Cross-correlations between volume change and price change, Proc. Natl. Acad. Sci. USA 106 (2009) 22079-22084.
- (11) B. Podobnik, I. Grosse, D. Horvatic, S. Ilic, P.Ch. Ivanov, H.E. Stanley, Quantifying cross-correlations using local and global detrending approaches, Eur. Phys. J. B 71 (2009) 243-250.
- (12) V. Plerou, P. Gopikrishnan, B. Rosenow, L.A.N. Amaral, H.E. Stanley, Universal and nonuniversal properties of cross correlations in financial time series, Phys. Rev. Lett. 83 (1999) 1471-1474.
- (13) S. Pincus, R.E. Kalman, Irregularity, volatility, risk, and financial market time series, Proc. Natl. Acad. Sci. USA 101 (2004) 13709-13714.
- (14) J.S. Richman J.R. Moorman, Physiological time-series analysis using approximate entropy and sample entropy, Am. Physiol. Heart Circ. Physiol. 278 (2000) H2039-H2049.
- (15) I. Ginzburg, H. Sompolinsky, Theory of correlations in stochastic neural networks, Phys. Rev. E 50 (1994) 3171-3191.
- (16) S. Arianos, A. Carbone, Cross-correlation of long-range correlated series, J. Stat. Mech.: Theory and Experiment (2009) P03037.
- (17) R. Yulmetyev, P. Hänggi, F. Gafarov, Stochastic dynamics of time correlation in complex systems with discrete time, Phys. Rev. E 62 (2000) 6178-6194.
- (18) R. Yulmetyev, P. Hänggi, F. Gafarov, Quantification of heart rate variability by discrete nonstationary non-Markov stochastic processes, Phys. Rev. E 65 (2002) 046107-1-15.
- (19) R.M. Yulmetyev, D.G. Yulmetyeva, P. Hänggi, S. Shimojo, J. Bhattacharya, Strong memory in time series of human magnetoencephalograms can identify photosensitive epilepsy, JETP 104 (2007) 644-650.
- (20) P. Gaspard, X.-J. Wang, Noise, chaos, and (, )-entropy per unit time, Phys. Rep. 235 (1993) 291-343.
- (21) S.K. Godunov, V.S. Ryaben’kii, Introduction in Theory of Difference Schemes (GITTL, Moscow, 1962).
- (22) A.O. Gel’fond, Calculation in Finite Diferences (GITTL, Moscow, 1952).
- (23) K. Watanabe, T. Imada, K. Nihei, S. Shimojo, Neuromagnetic responses to chromatic Flicker: implications for photosensitivity, Neurorep. 13 (2002) 2161-2165.
- (24) J. Bhattacharya, K. Watanabe, S. Shimojo, Nonlinear dynamics of evoked neuromagnetic responses signifies potential defensive mechanisms against photosensitivity, Int. J. Bifur. Chaos 14 (2004) 2701-2719.
- (25) V.Yu. Shurygin, R.M. Yulmetyev, V.V. Vorobjev, Physical criterion of the degree of non-Markovity of relaxation processes in liquids, Phys. Lett. A 148 (1990) 199-203.
- (26) V.Yu. Shurygin, R.M. Yulmetyev, The space dispersion of the structure relaxation in simple liquids, ZhETF 99 (1991) 144-154.