11email: iacolina@ca.astro.it 22institutetext: INAF-Osservatorio Astronomico di Cagliari, Loc. Poggio dei Pini, Strada 54, 09012 Capoterra (CA), Italy 33institutetext: Università di Palermo, Dipartimento di Scienze Fisiche ed Astronomiche, via Archirafi 36, 90123 Palermo, Italy
Search for pulsations at high radio frequencies from accreting millisecond X-ray pulsars in quiescence
Abstract
Context. It is commonly believed that millisecond radio pulsars have been spun up by transfer of matter and angular momentum from a low-mass companion during an X-ray active mass transfer phase. A subclass of low-mass X-ray binaries is that of the accreting millisecond X-ray pulsars, transient systems that show periods of X-ray quiescence during which radio emission could switch on.
Aims. The aim of this work is to search for millisecond pulsations from three accreting millisecond X-ray pulsars, XTE J1751–305, XTE J1814–338, and SAX J1808.4–3658, observed during their quiescent X-ray phases at high radio frequencies (5 8 GHz) in order to overcome the problem of the free-free absorption due to the matter engulfing the system. A positive result would provide definite proof of the recycling model, providing the direct link between the progenitors and their evolutionary products.
Methods. The data analysis methodology has been chosen on the basis of the precise knowledge of orbital and spin parameters from X-ray observations. It is subdivided in three steps: we corrected the time series for the effects of (I) the dispersion due to interstellar medium and (II) of the orbital motions, and finally (III) folded modulo the spin period to increase the signal-to-noise ratio.
Results. No radio signal with spin and orbital characteristics matching those of the X-ray sources has been found in our search, down to very low flux density upper limits.
Conclusions. We analysed several mechanisms that could have prevented the detection of the signal, concluding that the low luminosity of the sources and the geometric factor are the most likely reasons for this negative result.
Key Words.:
Pulsar: general – Pulsar: individual (XTE J1751–305, XTE J1814–338, SAX J1808.4–3658), neutron star, X-ray binary1 Introduction
It is commonly believed that accreting millisecond X-ray pulsars (AMXPs), transient binary systems hosting a fast spinning ( 1 ms) and weakly magnetised ( Gauss) neutron star (NS), are the progenitors of the radio millisecond pulsars (MSPs), as argued by the recycling model (Alpar et al. 1982; Bhattacharya & van den Heuvel 1991). This model asserts that the NS in these systems is spun up by the transfer of matter and angular momentum from its low-mass (M 1 M⊙) companion star via the formation of an accretion disk. When this process ends, the NS switches on as a radio MSP.
A basic requirement for the switching on of the radio emission is that the space surrounding the NS has to be free of matter, a condition that can be fulfilled during the quiescence phase of AMXPs. For this reason this phase constitutes the most promising one to investigate for confirming of the recycling model. The aim of this work is, in fact, to search for radio millisecond pulsations from a sample of AMXPs in their quiescence phase: a positive result would unambiguously establish that AMXPs are the progenitors of at least some of the radio MSPs.
In the past decade, from 1998 April, the date of the discovery of the first AMXP, SAX J1808.4–3658 (Wijnands & van der Klis 1998), several attempts have been made to obtain this confirmation (e.g. Burgay et al. 2003), but, despite the eleven additional systems discovered since (e.g. Galloway et al. 2002; Casella et al. 2008), we have not obtained a positive result yet.
A possible explanation of some of these failures has been given by Burderi et al. (2001), asserting that detection of radio pulsations from AMXPs could be hampered by matter surrounding the system. In fact, during the so-called radio-ejection phase, the pressure of the rotating magneto-dipole could prevent the infalling matter from the companion of the NS in the binary system from reaching the NS Roche lobe, forcing it to leave the system from the Lagrangian point . Once this happens, such matter, which is still carrying the angular momentum, will rotate around the two stars embedding the system. Even if the pulsar radio emission was switched on and the system in X-ray quiescence, it could be absorbed by a free-free mechanism. Since the optical depth for the free-free absorption, , depends on the square inverse of the frequency, observations at higher frequencies could encompass this problem.
With this scenario in mind we have undertaken a campaign of observation at high radio frequencies (see Table 1) for four AMXPs, XTE J0929–314, XTE J1751–305, XTE J1814–338, and SAX J1808.4–3658, in their quiescence phase. Results for XTE J0929–314 were presented in Iacolina et al. (2009). Here we used the same equation to estimate for the other three sources, and we obtained the values listed in Table 1. The parameters are: for the four sources, , ; for XTE J1814–338, , , (Markwardt & Swank 2003); for XTE J1751–305, , , (Markwardt et al. 2002); for XTE J0929–314, , , (Galloway et al. 2002); and for SAX J1808.4–3658, (which is the average mass transfer rate for the 1998, 2000, and 2002 outbursts, see Papitto et al. 2005), , . In this table, the values of obtained at 1.4 GHz (the typical frequency used to observe pulsar) are much higher than unity, so the radiation would be totally absorbed, while for frequencies higher than 5 GHz we obtained values smaller or close to unity for all the sources and, reasonably assuming that the matter enclosing the system is clumpy (i.e. there are favourable directions where the optical depth is lower than the average values of the Table), we have a higher probability of detecting the radio signal.
| Source | |||
|---|---|---|---|
| 1.4 GHz | 6.5 GHz | 8.5 GHz | |
| XTE J1814–338 | 2.2 | 1.2 | 0.05 |
| XTE J1751–305 | 27.8 | 1.1 | 0.7 |
| XTE J0929–314 | 5 | 0.2 | 0.1 |
| 1.4 GHz | 5 GHz | 6 GHz | |
| SAX J1808.4–3658 | 9.3 | 0.7 | 0.5 |
The unknown inclination of the systems negligibly affects the estimate of the optical depth, considering that, while the estimated companion mass only slightly increases for a decrease in the inclination, the amount of matter along the line of sight significantly decreases, because the disk is in the orbital plane.
2 The sources, the observations, and the data analysis method
Two series of radio observations were taken on 2003 December 20–23 for XTE J1751–305 and XTE J1814–338, and on 2002 August 5–7 for SAX J1808.4–3658, using the Parkes 64 m radio telescope. Observation parameters are listed in Table 3. The data analysis methodology was chosen on the basis of the precise knowledge of the spin and orbital parameters from X-ray observation. It is the same as was adopted for the source XTE J0929–314 presented by Iacolina et al. (2009), where it is described in detail.
The original ephemerides were published by Markwardt et al. (2002) for XTE J1751–305, by Markwardt & Swank (2003) for XTE J1814–338 and by Chakrabarty & Morgan (1998) for SAX J1808.4–3658, and subsequently refined by Papitto et al. (2007, 2008) for XTE J1751–305 and XTE J1814–338, and by Hartman et al. (2009) (but also by Burderi et al. 2009, Di Salvo et al. 2008 and Hartman et al. 2008) for SAX J1808.4–3658. Table 3 reports the most updated ephemerides used in this work.
The first part of the data analysis was to correct the time series for the dispersion effects of the ISM; the steps, the ranges of DMs used, and the values of the local DMs for the three sources are indicated in Table 3 (for SAX J1808.4–3658, we considered the highest mass transfer rate assumed in quiescence, /y, proposed by Di Salvo et al. 2008). We then barycentred the data series to correct for the orbital effects considering the propagation of the uncertainties in the ephemerides derived from X-ray observations over the time range between X-ray and radio observations. This time range corresponds to 20000 orbits for XTE J1751–305 and 1000 orbits for XTE J1814–338. For SAX J1808.4–3658, the adopted X-ray ephemerides are derived from the analysis of the secular evolution reported by Hartman et al. (2009) (see the Table 3), which refers to the time of 100 orbits after the radio observations.
For XTE J1751–305, only the propagation of the orbital period error (90% confidence level) affected the time series losing the possibility of detecting the signal: i.e. producing a broadening of the pulse of 0.9 in pulsar phase. To reduce this broadening to at most 0.1 in pulsar phase, one has to search for the signal at 18 trial values of the orbital period, 9 above and 9 below the nominal value, covering the uncertainty range.
For XTE J1814–338 and SAX J1808.4–3658, the uncertainty in all the parameters within the 90% confidence level for XTE J1814–338 and 1 level for SAX J1808.4–3658 does not affect the detectability of the pulsation. We then corrected the data series by only using the nominal values of the parameters.
The last step in this search is to fold the time series using the spin parameters reported in Table 3. The spin period range explored has to be chosen by considering the nominal value of the spin period at the epoch of the radio observations, as explained by Iacolina et al. (2009).
For SAX J1808.4–3658, which is the only AMXP that showed more than one outburst, we considered the value of the spin period at the epoch of the X-ray observations, , derived by Hartman et al. (2009) and the value of its derivative, , measured during the outburst closest to the radio observations time, reported by Burderi et al. (2006) and listed in Table 3, which turns out to be higher than what is derived by the analysis of the secular evolution obtained by Hartman et al. (2009) and constitutes an upper limit in the search (see below). The folding trial values are indicated in Table 3.
To check the plausibility of the adopted spin period interval, for XTE J1814–338, we derived the spin period derivative, , through an estimate of the surface magnetic field, considering the magnetic torque acting on the neutron star, as discussed by Iacolina et al. (2009). The value obtained is , which is lower than and then safely contained in our interval of spin period trial values. For SAX J1808.4–3658, Burderi et al. (2006) calculated a value of the magnetic field equal to Gauss. The spin period derivative, therefore, results , which is once again .
For XTE J1751–305 Wijnands et al. (2005) derived an estimate of the magnetic field during its quiescence phase constrained to be G, using the value reported in Table 3 for the distance. The spin period derivative resulted to be which is lower than , consequently, the adopted interval of spin periods is again safely large.
3 Results
At the end of the three steps of analysis we produced 67000 folded profiles for XTE J1751–305, 330 for XTE J1814–338, and 200 for SAX J1808.4–3658, reporting the results from the folding of the dedispersed, deorbited, and barycentred time series. The best ones were displayed for visual inspection to search for possible pulsar suspects.
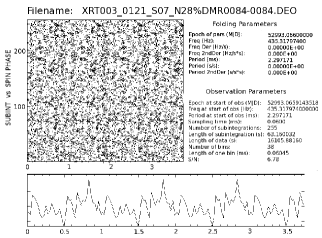
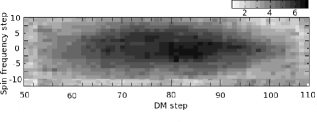
For XTE J1751–305, the highest obtained was 6.78 corresponding to a peak at 4 significance, the corresponding plot is shown in Fig. 1 (upper panel), where the grayscale on the left shows the signal in the 255 subintegrations in which the whole observation was split vs the spin phase, while the parameters used for the folding are indicated on the right. The diagram at the bottom displays about 4 phases of the integrated pulse profile. The parameters for the pulsar suspect are = 735.41 pc cm-3, = 2545.34361 s, = 435.317974 Hz. This peak has a 40% probability of not being randomly generated over the 40755 trial foldings of the dataset corresponding to one of the two observations at 8.5 GHz. Analysing the behaviour of the as a function of the spin frequency and DM trial values, a decreasing trend from a peak at 6.78 is found. Since this peak was at the limit of our search interval in spin frequency, we considered it appropriate to investigate for 11 more steps in the spin frequency, discovering, in this way, the whole trend: the maximum, which corresponded to the same , is defined in all the directions. The result is displayed in Fig. 1 (lower panel), where in the y-axis we have the spin frequency (10 steps above and 11 below the nominal value, corresponding to 0) and in the x-axis, the DM (60 steps corresponding to the interval between 485.22 and 932.54 pc cm-3) plotted for an orbital period s. A clear maximum is well defined, hence supporting the plausibility of the suspect.
This result is not confirmed in the other observation (at the same frequency) elaborated with the same parameters, but this could be due to the clumpiness of the matter around the system. This suspect may thus deserve additional investigation in the future.
The highest s reached for XTE J1814–338 and for SAX J1808.4–3658 were 4.67 and 4.41, corresponding to a peak at 2.6 and 2.2 significance, respectively, with a probability of being real radio signals and not produced by noise of 18% and 20% over the 186 and 57 trial foldings of their single dataset, respectively. Unfortunately, visual inspection of these two results and others at lower s did not provide any evidence of the pulsed signal, and no other investigations have shown the positive signs in the trend of the obtained for XTE J1751–305. Finally, the observations at the other frequency, folded with the same parameters, did not displayed any suitable shape for the signal. For these two sources, we can thus conclude that no pulsed radio signal has been detected at their spin period in our observations.
3.1 Upper limit on the flux density
Considering the parameters indicated in Table 3 and a duty cycle, , of 15%, we estimated the upper limit on the flux density for the three observed sources at the nominal DM with the Eq. 9 in Iacolina et al. (2009). Including results for XTE J0929–314 (Iacolina et al. 2009), we obtained the values indicated in Table 1.
| Source | (Jy) | |
|---|---|---|
| 6.5 GHz | 8.5 GHz | |
| XTE J1814–338 | 52 | 25 |
| XTE J1751–305 | – | 31 - 30 |
| XTE J0929–314 | 68 | 26 |
| 5 GHz | 6 GHz | |
| SAX J1808.4–3658 | 59 | 59 |
4 Discussion
In this section we discuss the results of our findings, including results for XTE J0929–314 presented in Iacolina et al. (2009). A part for the result obtained for the 8.5 GHz observation of XTE J1751–305, deserving additional investigation, no radio pulsed emission has been found above the reported upper limits in the data analysed. Assuming that the radio emission was switched on during the observations of the three sources, we investigated the possible reasons that prevented detecting of the radio signals.
Considering Eq. 11 in Iacolina et al. (2009), we estimated the probability that the beams of the sources do not intersect our line of sight. Assuming a typical duty cycle of 15% for each source, the probability that the beams of all the sources (including XTE J0929–314) are missing our line of sight is 19%. In order to exclude this geometric bias we would have to analyse the whole known sample of twelve AMXPs, and the probability of missing all the beams of the whole sample will drop to about 0.1%.

The second possible reason that might have prevented the detection of a radio signal could be the low luminosity of the sources. As the true luminosity of pulsars cannot be measured because of the unknown beaming fraction, a ’pseudo luminosity’, , is defined as the observed flux density, , multiplied by the square of the pulsar distance, (Taylor & Manchester 1977): .
In Fig. 2 the logarithmic distribution of the pseudoluminosity at 1.4 GHz of the sample of 46 known galactic field MSPs is shown222Data taken from the ATNF pulsar catalogue – http://www.atnf.csiro.au/research/pulsar/psrcat/; Manchester et al. (2005).. The vertical red lines indicate the lower values of the upper limits on of XTE J1751–305, XTE J1814–338, SAX J1808.4–3658, and XTE J0929–314 (for the observations at 8.5 GHz and 5 GHz), scaled at 1.4 GHz, considering a dependence on the frequency , with an index , and for the distances indicated in Table 3.
These limits determine the probability that the true pseudo luminosity of each source is too faint for detection in our search. We calculated that this probability is about 90% for XTE J1814–338 and XTE J1751–305 and 80% for SAX J1808.4–3658 and for XTE J0929–314. The combined probability of the non detection due to the luminosity threshold of our survey is 50%. This percentage is not negligible and can be reduced by a deeper search and/or by a larger sample.
Expanding the sample to all twelve known AMXPs, with a probability equal to about 80% for each one, the combined probability would be 10%, not enough for a safe detection. For a combined probability less than 0.1%, we also have to perform a deeper search. The upper limit in pseudo-luminosity for each source having such a probability is mJy kpc2. The limit in flux for an average distance of 7 kpc becomes mJy at 1.4 GHz which, scaled at 4.7 GHz (as, for example, for the observation of SAX J1808.4–3658), becomes mJy. Such a limit can be reached by performing observations using telescopes with a larger bandwidth and higher instantaneous sensitivity. In fact, a 4.7 GHz observation of SAX J1808.4–3658, performed using a 2 GHz bandwidth and 2.01 K Jy-1 gain obtainable at the Green Bank radio telescope (GBT), would have reached a flux density limit of 0.003 mJy.
5 Conclusions
We performed a search for millisecond pulsations in three AMXPs, XTE J1814–338, XTE J1751–305, and SAX J1808.4–3658, in their quiescence phases at high radio frequencies. Discussion was done by including the previous results obtained by Iacolina et al. (2009) for XTE J0929–314. Except for the case of XTE J1751–305, for which further investigations are needed, no pulsations with the expected periodicity have been detected in the analysed data. The flux density upper limits determined by our search (including XTE J0929–314) are indicated in Table 1.
Possible mechanisms that might have hampered the observation of the pulsed signal could concern the luminosity of the four analysed sources, lower than our limit of detection, resulting in a 50% combined probability of non detection, or the anisotropic nature of the pulsar emission, with a probability of 19% that the beam of all the four sources does not intersect our line of sight.
Acknowledgements.
This work is supported by the Italian Space Agency, ASI-INAF I/088/06/0 contract for High Energy Astrophysics, and by the RAS (Regione Autonoma della Sardegna), PO-FSE 2007-13, L.R. 7/2007.References
- Alpar et al. (1982) Alpar, M. A., Cheng, A. F., Ruderman, M. A., & Shaham, J. 1982, Nature, 300, 728
- Bhattacharya & van den Heuvel (1991) Bhattacharya, D. & van den Heuvel, E. P. J. 1991, Phys. Rep., 203, 1
- Burderi et al. (2006) Burderi, L., Di Salvo, T., Menna, M. T., Riggio, A., & Papitto, A. 2006, ApJ, 653, L133
- Burderi et al. (2001) Burderi, L., Possenti, A., D’Antona, F., et al. 2001, ApJ, 560, L71
- Burderi et al. (2009) Burderi, L., Riggio, A., di Salvo, T., et al. 2009, A&A, 496, L17
- Burgay et al. (2003) Burgay, M., Burderi, L., Possenti, A., et al. 2003, ApJ, 589, 902
- Casella et al. (2008) Casella, P., Altamirano, D., Patruno, A., Wijnands, R., & van der Klis, M. 2008, ApJ, 674, L41
- Chakrabarty & Morgan (1998) Chakrabarty, D. & Morgan, E. H. 1998, Nature, 394, 346
- Di Salvo et al. (2008) Di Salvo, T., Burderi, L., Riggio, A., Papitto, A., & Menna, M. T. 2008, MNRAS, 389, 1851
- Galloway et al. (2002) Galloway, D. K., Chakrabarty, D., Morgan, E. H., & Remillard, R. A. 2002, ApJ, 576, L137
- Hartman et al. (2008) Hartman, J. M., Patruno, A., Chakrabarty, D., et al. 2008, ApJ, 675, 1468
- Hartman et al. (2009) Hartman, J. M., Patruno, A., Chakrabarty, D., et al. 2009, ApJ, 702, 1673
- Iacolina et al. (2009) Iacolina, M. N., Burgay, M., Burderi, L., Possenti, A., & di Salvo, T. 2009, A&A, 497, 445
- Manchester et al. (2005) Manchester, R. N., Hobbs, G. B., Teoh, A., & Hobbs, M. 2005, VizieR Online Data Catalog, 7245, 0
- Markwardt & Swank (2003) Markwardt, C. B. & Swank, J. H. 2003, IAU Circ, 8144, 1
- Markwardt et al. (2002) Markwardt, C. B., Swank, J. H., Strohmayer, T. E., Zand, J. J. M. i., & Marshall, F. E. 2002, ApJ, 575, L21
- Papitto et al. (2007) Papitto, A., di Salvo, T., Burderi, L., et al. 2007, MNRAS, 375, 971
- Papitto et al. (2005) Papitto, A., Menna, M. T., Burderi, L., et al. 2005, ApJ, 621, L113
- Papitto et al. (2008) Papitto, A., Menna, M. T., Burderi, L., di Salvo, T., & Riggio, A. 2008, MNRAS, 383, 411
- Taylor & Manchester (1977) Taylor, J. H. & Manchester, R. N. 1977, ApJ, 215, 885
- Wijnands et al. (2005) Wijnands, R., Homan, J., Heinke, C. O., Miller, J. M., & Lewin, W. H. G. 2005, ApJ, 619, 492
- Wijnands & van der Klis (1998) Wijnands, R. & van der Klis, M. 1998, Nature, 394, 344
3
| Pulsar names | XTE J1814–338 | XTE J1751–305 | SAX J1808.4–3658 | |||
|---|---|---|---|---|---|---|
| Source parameters | ||||||
| Right ascension (J2000.0) | 18h13m3904 | 17h51m1349 | 18h08m2754 | |||
| Declination (J2000.0) | 33∘46′223 | 30∘37′234 | 36∘58′443 | |||
| Orbital period, (s) | 15388.7229(2) | 2545.342(2) | 7249.156980(4) | |||
| Projected semi-major axis, (lt-ms) | 390.633(9) | 10.125(5) | 62.812(2) | |||
| Eccentricity, | ||||||
| Spin period, (s) | 0.0031811056698(1) | 0.002297172972(2) | 0.00249391975978(6) | |||
| Mean spin period derivative, (s s-1) | 6.7(7) | 1.95(10) | 4.7(9) | |||
| Ascending node passage, (MJD) | 52797.8101689(9) | 52368.0129023(4) | 52499.9602472(9) | |||
| Distance, (kpc) | 8 | 6.7 | 3.5 | |||
| Nominal DM (pc cm3) | 200 | 400 | 100 | |||
| References | 1 | 2 | 3,4 | |||
| Observation parameters | 1st | 2nd | ||||
| Central radio frequency, (GHz) | 6.4105 | 8.4535 | 8.4535 | 8.4535 | 4.7495 | 6.3515 |
| Data series time, (s) | 25053 | 10669 | 17145 | 22864 | 35685 | 35051 |
| Sampling time, (s) | 92 | 50 | 60 | 100 | 125 | 125 |
| Samples number, | 228 | 227 | 228 | 227 | 228 | 228 |
| Nominal gaina𝑎aa𝑎aValues derived from the Parkes website: http://www.parkes.atnf.csiro.au/observing/documentation/., (K Jy-1) | 0.46 | 0.59 | 0.59 | 0.46 | ||
| System temperaturea𝑎aa𝑎aValues derived from the Parkes website: http://www.parkes.atnf.csiro.au/observing/documentation/., (K) | 50 | 25 | 25 | 50 | ||
| Number of 3 MHz channels, | 192 | 192 | 192 | |||
| Data analysis parameters | ||||||
| Number of DMs | 186 | 151 | 195 | 127 | 135 | 57 |
| DM range (pc cm3) | 501000 | 1001700 | 20400 | |||
| Local DM (pc cm3) | 20 | 260 | 230 | |||
| Number of steps | 1 | 19 | 1 | |||
| Number of folding steps | 1 | 11 | 1 | |||
| Other parameters | ||||||
| Sky temperature, (K) | 0.06 | 0.03 | 0.09 | 0.13 | 0.06 | |
| Dispersion broadening, (s) | 9.5 DM | 4.2 DM | 4.2 DM | 23 DM | 9.7 DM | |
| Scattering broadening, (s) | 9.6 | 3 | ||||