The Type Ic SN 2007gr: a census of the ejecta from late-time optical-infrared spectra
Abstract
Nebular spectra of Supernovae (SNe) offer an unimpeded view of the inner region of the ejecta, where most nucleosynthesis takes place. Optical spectra cover most, but not all of the emitting elements, and therefore offer only a partial view of the products of the explosion. Simultaneous optical-infrared spectra, on the other hand, contain emission lines of all important elements, from C and O through to the Intermediate Mass Elements (IME) Mg, Si, S, Ca, and to Fe and Ni. In particular, Si and S are best seen in the IR. The availability of IR data makes it possible to explore in greater detail the results of the explosion. SN 2007gr is the first Type Ic SN for which such data are available. Modelling the spectra with a NLTE code reveals that the inner ejecta contain of material within a velocity of km s-1. The same mass of 56Ni derived from the light curve peak () was used to power the spectrum, yielding consistent results. Oxygen is the dominant element, contributing . The C/O ratio is . IME account for . This confirms that SN 2007gr was the explosion of a low-mass CO core, probably the result of a star of main-sequence mass . The ratios of the Ca ii lines, and of those of Fe ii, are sensitive to the assumed degree of clumping. In particular, the optical lines of [Fe ii] become stronger, relative to the IR lines, for higher degrees of clumping.
keywords:
Supernovae: general – Supernovae: individual: SN 2007gr – Radiation mechanisms: thermal1 Introduction
Supernovae (SNe) are the final explosion marking the end of the life cycle of different types of stars. Massive stars () explode when their core can no longer synthesise new elements and undergoes collapse. Thermonuclear SNe (SNe Ia) are the complete explosive destruction of White Dwarfs reaching the Chandrasekhar mass limit, most likely via accretion in a binary system (Hillebrandt & Niemeyer, 2000), although other channels have been proposed (Pakmor et al., 2010; Fink et al., 2010). There are a number of ways to measure the properties of SNe and infer those of the progenitor stars: classically, the analysis of SN light curves yields information about the mass ejected in the explosion and the explosion kinetic energy (Arnett, 1982). Combined studies of the light curve and the spectra allow a more precise estimate of these parameters, as well as of the abundances in the ejecta, for both SNe Ia and core-collapse SNe (e.g. Mazzali et al., 2008a, b, respectively).
The properties of the progenitor star may be inferred through direct imaging (e.g. Smartt, 2009) or searches for the surviving companion in the case of SNe Ia (e.g. Ruiz-Lapuente et al., 2004). However, the only method that looks directly at the SN ejecta when they are transparent but not yet a remnant is nebular-epoch spectroscopy. Soon after the explosion, the SN nebula is still optically thick, and only the outer layers can be observed. About 6 months to one year after the explosion, however, expansion makes the nebula sufficiently thin that it becomes essentially transparent to radiation. In this phase the gas is heated by collisions with the fast particles produced in the thermalization process of the -rays and the positrons produced in the decay of 56Co to 56Fe, and it cools via line emission. As optical depth effects are negligible, the energy that is deposited is immediately re-radiated, which makes it easier to estimate the 56Ni mass (Axelrod, 1980). This phase can be used to study the inner layers of SNe, yielding information on the details of the explosion, both for SNe Ia (Mazzali et al., 2007a) and core-collapse SNe, especially those that have lost the outer layers (Type Ib/c, Maeda et al., 2008; Maurer et al., 2010).
One major advantage of the nebular phase is that the luminosity emitted by a certain ion depends, albeit indirectly, on the mass of the ion itself. A reliable estimate of the emitting mass requires then two basic elements: observational coverage of the largest possible number of lines of different elements and a reliable calculation of the ionization and excitation state of the gas. For the latter, NLTE calculations are usually performed. The former requirement implies essentially observing as wide a spectral range as possible. Traditionally, because of the faintness of SNe in the nebular phase and the easier availability of optical detectors, in almost all cases only optical spectra of SNe in the nebular phase were obtained. However, several important line emission features are located at IR wavelengths. This includes elements such as Si, which is very important for SNe and has no strong emission lines in the optical, so that its mass cannot be derived from optical spectra. Also, the ratios of different lines of the same element can be used to determine the density of the emitting gas (e.g. Ca ii, Li & McCray, 1993), (Fe ii, Leloudas et al., 2009).
Only a very small number of nebular-phase IR spectra of SNe is available, and these are typically SNe Ia spectra (e.g. Spyromilio et al., 2004; Motohara et al., 2006). Among core-collapse SN, there are late-time IR spectra for the peculiar SN IIP 1987A (Fassia et al., 2002), and for the highly reddened SN IIP 2002hh (Pozzo et al., 2006). The first stripped-envelope SN for which late-time IR spectra have been obtained is the Type Ic SN 2007gr (Hunter et al., 2009).
SNe Ic show neither H nor He in their spectra (Filippenko, 1997), and come with a very diverse range of observational (Matheson et al., 2000) and physical properties (Mazzali et al., 2006). These depend on the properties of the progenitor star and the details of the explosion, ranging from ejected masses of , 56Ni masses of and kinetic energies of erg for “normal” events (e.g. Sauer et al., 2006) to ejected masses of , 56Ni masses of and kinetic energies of erg for GRB-connected hypernovae (Mazzali et al., 2006).
SN 2007gr had normal luminosity and spectral appearance, but was characterised by the unusual presence of carbon lines in the early-time spectra, indicating that C was not fully burned to O (Valenti et al., 2008). A simple light curve analysis (Hunter et al., 2009) suggests that SN 2007gr ejected of material with kinetic energy erg, which would make it a rather ordinary SN Ic. High-resolution radio observations of SN 2007gr revealed emission from an expanding source (Paragi et al., 2010, but see Soderberg et al. (2010)). This expansion was interpreted as evidence for material moving at mildly relativistic velocities in what seems to be a bipolar jet. This is at odds with the existing picture where all SNe associated with emission from relativistic material also show large expansion velocities in the early phase (), which links the relativistic material to the bulk of the SN ejecta, and are characterised by large values of the ejected mass and the explosion energy (Mazzali et al., 2006).
We use the nebular spectra of SN 2007gr, including one simultaneous optical-IR spectrum obtained more than one year after the explosion, to determine the properties of the inner ejecta.
In the following, in Section 2 we briefly review the data we use, in Section 3 we discuss the nebular model used for the calculations, Section 4 presents the results of one-zone models, Section 5 deals with the models obtained using a density profile, and in Section 6 our results are discussed.
2 The Data
Nebular-phase spectra of SN 2007gr were obtained at various epochs, as outlined in Hunter et al. (2009). Earlier optical spectra have epochs of 103 to 158 days after maximum. These spectra are not fully nebular. The same is true for various IR spectra obtained at similar epochs. At day 375 after maximum a simultaneous optical-IR spectrum was obtained. Since the optical and the IR spectra were obtained within one day of one another, spectral evolution and relative calibration are not an issue, unlike data at earlier epochs. The very advanced phase of this later spectrum ensures that it is fully nebular. The spectrum was presented in Figures 7 (optical) and 12 (IR) of Hunter et al. (2009).
Here we use the very late optical-IR spectrum at 376.5 days after maximum for our calculations111This spectrum was incorrectly labelled as +375.5 days in Hunter et al. (2009), who did not take into account that 2008 was a leap year., and verify results using the optical spectrum at 158 days after maximum.
SN 2007gr exploded in a crowded region in the spiral galaxy NGC 1058. In particular, SN 2007gr is flanked on either side by a relatively bright stellar association (see Hunter et al., 2009, Fig. 1) and several fainter sources within 150 pc (see Crockett et al., 2008, Fig. 1). At the late epochs under consideration, when the SN is faint in comparison with these adjacent objects, particular attention must be paid to the estimation of the background flux. In order to estimate the contribution of these sources we extracted spectra obtained in the vicinity of SN 2007gr. The resulting background contribution clearly depends on the choice of location at which the flux was estimated. We experimented with several extractions along the spatial profile and chose the background contribution that best matched the underlying slope in the SN continuum. We then scaled this background to the apparent SN continuum and subtracted it from the SN spectrum (no strong continuum is expected from the SN at late epochs). The contaminating sources (within 150 pc) are probably clusters (Crockett et al., 2008) with spectral energy distributions that peak at blue wavelengths, so while some contamination affects the entire spectrum, it is expected to be particularly severe at bluer wavelengths.
3 The model
We modelled the spectra of SN 2007gr using a code which computes the energy deposition from the radioactive decay of 56Ni and 56Co in the SN ejecta, uses the deposited energy to estimate ionization and excitation, and balances this with gas cooling via line emission in a NLTE scheme (Ruiz-Lapuente & Lucy, 1992). The method follows that developed by Axelrod (1980).
The code allows the use of clumping, expressed in terms of a clumping factor , which is defined as the inverse of the filling factor (Li & McCray, 1993; Maurer et al., 2010). This assumes that the gas is distributed uniformly, but resides in clumps. The effect of clumps is to increase the local density, and hence to favour recombination. Clumping also reduces the population of the excited levels, which may be important in the context of the ratio of optical to IR flux, as suggested by Leloudas et al. (2009). For SNe Ib/c, Mazzali et al. (2001) found that a typical clumping yields best results, while for SNe Ia clumping is not regarded to be necessary if a detailed model of the explosion is used (e.g. Mazzali et al., 2008a). The need for clumping in SNe Ib/c may be the result of an inaccurate treatment of ionization.
Improvements in the treatment of ionization (Maurer & Mazzali, 2010) make the code more reliable, in particular for SNe where Ni and Fe do not dominate the ejecta. These improvements were introduced in the context of including a treatment of oxygen recombination. A simultaneous improvement of the treatment of ionization was also necessary in order to make the calculation of the recombination rate more reliable. Forbidden line emission is influenced by this new treatment only weakly. Results with the old and new codes are shown and compared in Section 4.
In a one-zone version, the code assumes that the gas is distributed with uniform density and abundances within a sphere of radius , where is the outer velocity of the expanding nebula, as determined from the width of the emission lines, and is the time elapsed from explosion. This takes advantage of the fact that in SN ejecta any given parcel of matter is characterised by a velocity which remains constant as long as the ejecta are not slowed down by interaction with circumstellar material. Results obtained with this model are presented in Section 4.
In a more sophisticated version the SN envelope is divided into uniform radial shells. Deposition of -rays and positrons is computed using a Montecarlo scheme, and emission is computed within each shell. This version can be used if a detailed model of the explosion is available, which describes the run of density with ejecta velocity, or if one is sought for from fitting the profile of the nebular lines (e.g. Mazzali et al., 2007b). Results obtained with this model are presented in Section 5.
For the distance and reddening to SN 2007gr we use the same values (d=9.3 Mpc, i.e. distance modulus mag; E(B-V)) as in Hunter et al. (2009).
4 One-zone models
For the nebular spectra of SN 2007gr we used first the 1-zone code to define the general properties of the ejecta. Here we show 1-zone model results obtained first without and then with the oxygen recombination module and compare them. We then applied the shell model to improve the results and the fits. These are discussed in the next section.
4.1 One-zone models, old code
4.1.1 Day 172
The first nebular spectrum we model was obtained on 2008 Jan 29. We assign it an epoch of 172 days after explosion, using an arbitrary risetime of 13.5 days, which is typical for SNe Ic and is consistent with the risetime deduced by (Hunter et al., 2009), days.
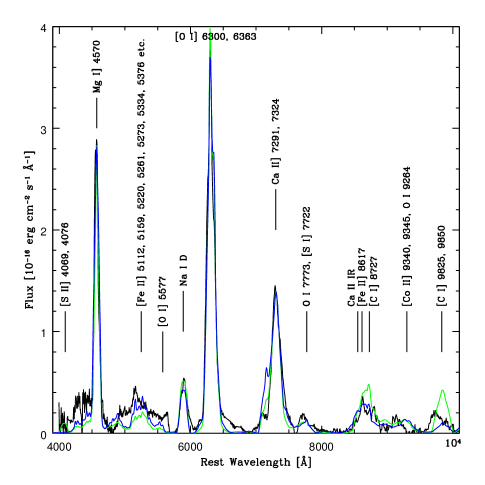
The strongest lines in the spectrum are typical of SNe Ic: [O i] 6300, 6363 Å, Mg i] 4570 Å, Ca ii] 7291, 7324 Å, the Ca ii IR triplet near 8600 Å, and Na i D near 5900 Å. Ca ii H&K may be seen at the blue edge of the spectrum. The spectrum can be fitted reasonably satisfactorily assuming an outer velocity of 5000 km s-1 and , which is typical for SNe Ic (Figure 1, blue line). The 56Ni mass was kept fixed at , as indicated by the light curve peak (Hunter et al., 2009). This value yields fairly good results. The mass enclosed within 5000 km s-1 is , oxygen being the main constituent ().
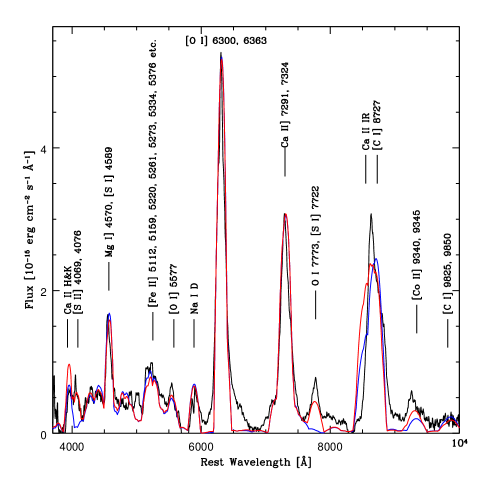
While most emission lines are reproduced, and identified in Figure 1, the main shortcomings of the model are as follows. The line near 4050Å is not reproduced. This is probably [S ii] 4069, 4076 Å, which is predicted to be present but is much too weak when compared to the data. The low ionization degree of sulphur (% in the models with the old treatment of ionization) is probably responsible for the weakness of the emission line. The broad base of [O i] 6300, 6363 Å is not reproduced. This is the effect of adopting a sharp outer boundary to the nebula. Shell models will improve this (see Section 5). The emission line at Å is not reproduced. This is most likely the recombination line O i 7773 Å, which is addressed in the next sub-section. An alternative possibility is [S i] 7723 Å. This is indeed predicted by the model as the strongest line of sulphur, but is much too weak. The second strongest sulphur line in the model is [S ii] 4068, 4076, which is too weak for a S mass of . The third strongest feature is [S i] 4507, 4589 Å, which is completely swamped by the strong Mg i] 4570 Å line. In order to reproduce both the line near 7750 Å and that near 4050Å as due to sulphur, the S mass must increase to an unreasonable , confirming that the line near 7700 Å is O i 7773. Additionally, cooling by S emission weakens the other lines, so that all other masses must increase, to a total of . Such a large S mass fraction seems to contradict nucleosynthesis results (Woosley & Weaver, 1995).
The line at 8700 Å is too weak. This is a blend of Ca ii IR triplet and [C i] 8727 Å. Increasing the strength of the [C i] line is not an option, as the wavelength of the line does not match that of the emission peak (assuming spherical symmetry). Also, the strength of the other carbon line, [C i] 9825, 9850 Å, is already overestimated. Therefore, a weak Ca ii line is the likely cause of the discrepancy. This may indicate a different degree of clumping than adopted in the calculation (see Li & McCray, 1993). We however refrain from investigating clumping here, since this may be better done using the optical/IR spectrum of day 390, which has a broader wavelength coverage, and the new code, which includes oxygen recombination and an updated treatment of ionization. Finally, the line at 9300 Å, which is mostly due to [Co ii] 9340, 9345, is not correctly reproduced. This may be caused by insufficient background subtraction.
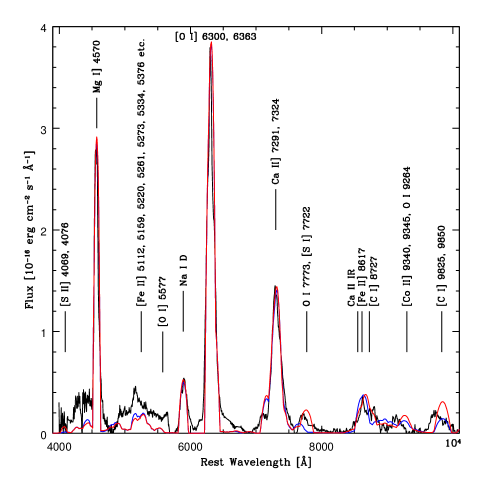
4.1.2 Day 390
The later spectrum is fully nebular, and it is therefore to be expected that our code can reproduce it better than the earlier one. Additionally, it covers both the optical and the IR essentially simultaneously, making it possible to narrow down the range of acceptable parameters. Many of the strongest features are the same as on day 172. One of the key features for modelling is the [Fe ii] line near 5200 Å. This is composed mostly of lines at 5159, 5262, 5273, and 5333 Å. Other strong lines include the structured blend near 8700 Å, which is due to a mix of a weak Ca ii IR triplet, [C i] 8727 Å, and [Fe ii] lines, the strongest being at 8617 and 8892 Å (Figure 2). The [Fe ii] 8617 Å line is actually the strongest of all these emissions, which explains why the observed profile peaks between Ca ii IR and the [C i] line. Uncertainties in the strength of the [Fe ii] lines may be responsible for the poor reproduction of the corresponding emission at day 172.
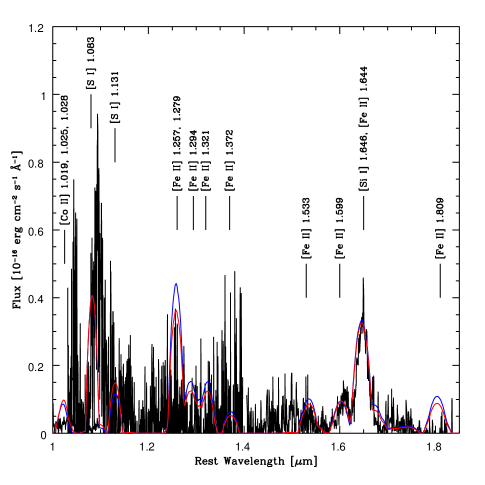
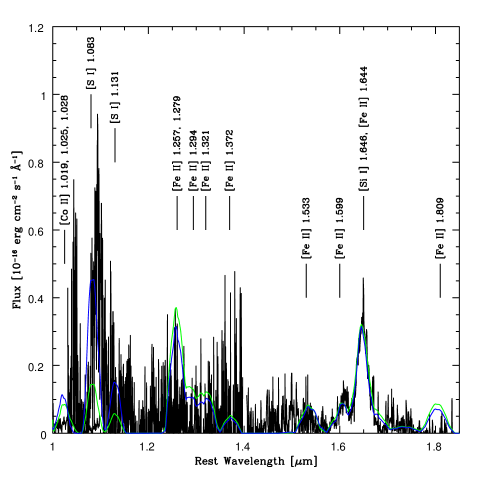
Moving to the IR, several other features are visible which allow relative comparisons. They are labelled in Figure 3. One of the most useful is [Si i] 1.604, 1.646 , which is the strongest silicon line, blended with [Fe ii] 1.599, 1.644, 1.664 . Lines of [Fe ii] are also seen near 1.25 (strongest contributors to the feature being lines at 1.249, 1.257, 1.270, 1.279, 1.321 ), but the spectrum is very noisy there. Other lines of IME are also present in the IR.
| code v. | epoch | vel | Mass | Te | log(ne) | M(C) | M(O) | M(Ne) | M(Mg) | M(Si) | M(S) | M(Ca) | M(56Ni) |
|---|---|---|---|---|---|---|---|---|---|---|---|---|---|
| [days] | km s-1 | K | cm-3 | ||||||||||
| old | 172 | 5000 | 1.40 | 5100 | 7.4 | 0.25 | 0.99 | 6.0e-5 | 1.25e-3 | 0.006 | 0.023 | 0.053 | 0.076 |
| new | 172 | 5000 | 1.83 | 4870 | 7.7 | 0.25 | 1.40 | 6.0e-5 | 1.00e-3 | 0.006 | 0.070 | 0.019 | 0.076 |
| old | 390 | 4000 | 1.04 | 3560 | 6.4 | 0.05 | 0.81 | 2.7e-4 | 2.80e-2 | 0.006 | 0.023 | 0.048 | 0.076 |
| new | 390 | 4000 | 1.28 | 3430 | 6.6 | 0.14 | 0.99 | 3.5e-4 | 3.25e-2 | 0.009 | 0.024 | 0.013 | 0.076 |
Since the flux in the IR lines of iron is basically determined from the flux in the optical lines (despite some influence of clumping) the abundance of Si can be determined from the line near 1.65 . This line has contributions from both [Si i] 1.608, 1.646 and [Fe ii] 1.644, 1.664 (Hunter et al., 2009). Given the abundances adopted in our model, Fe and Si contribute roughly equally to the observed emission. Fitting any difference between the observations and the synthetic [Fe ii] feature as due to [Si ii] is actually the only way to derive the abundance of Si from the nebular spectra. The abundance of sulphur can be determined from the strong [S i] line at 1.1 . This is composed of lines at 1.08 and 1.13 , which are much stronger than the sulphur lines which are seen in the optical. Unfortunately the region of the spectrum near 1.1 is very noisy. The ratio of optical to IR [Fe ii] emission lines is affected by the degree of clumping in the ejecta. However, since we have an independent estimate of the 56Ni mass from the light curve, we can use that value (), which basically fixes the amount of iron at day 390, and modify the filling factor to obtain a best match to the optical-IR Fe emission. Any additional flux in the 1.6 line can then be attributed to silicon, while at 1.1 sulphur can be assumed to contribute.
Using the one-zone model, the spectrum can be best matched using an outer velocity of km s-1. This is significantly less than at day 172. Clearly the outer regions of the nebula are becoming transparent, and the emission lines become narrower (see also Taubenberger et al., 2009). This evolution indicates that the density structure in the ejecta is important in shaping the nebular emission lines, and it suggests that the approximation of a one-zone model is not ideal. As in the model for day 172, we used a 56Ni mass of . A clumping factor yields the best ratio of optical to IR flux. At this epoch the model contains a mass of , and it is again dominated by oxygen (). Other elements have smaller mass. In particular, the Si mass required to reproduce the line is only . This is a very small mass, especially considering that other IME are more abundant (e.g. S, Ca, Mg). Still, this model reproduces most features. The main shortcoming may be in the [Fe ii] line near 5200 Å, which may suggest that a somewhat larger 56Ni mass may be required. However, background subtraction may be uncertain here, since the shape of the feature is reproduced reasonably well, as is the ratio of other Fe lines in the optical and IR. Interestingly, this ratio increases for increasing clumping factor. The higher density in the clumps favours recombination and a greater role of collisional processes, which support the population of the excited levels. Otherwise, at the low temperatures that characterise the SN nebula at very advanced epochs, IR lines should dominate (the so-called IR catastrophe, Axelrod, 1980). We present a model with more clumping in Section 5.
Although the mass of elements such as O and Ca is consistent at the two epochs, others change significantly. In particular, the Mg mass in the later spectrum is much larger than in the earlier one and the same is true, to a lesser extent, for Na. Clearly these elements are not very well constrained by the model, probably because of an incomplete treatment of ionization. Quite likely, both Mg and Na are highly ionized at early epochs and become less ionized at later phases. Given the low ionization potentials of Na i and Mg i, the high ionization in the early phase is probably caused by photoionization and possibly thermal electron collisional ionization, neither of which are treated by the code. An estimate of the masses of Na and Mg based on the neutral species at times when ionization is still significant may therefore yield incorrectly large values if this ionization is not taken into account. Mass estimates obtained around 390 days should be more reliable than at 172 days.
Conversely, the C mass is much smaller in the later spectrum. Although this estimate is uncertain also because of the poor fit of the 8600 Å emission, to which [C i] contributes, the reduction that is observed may indicate that C is preferentially located at velocities between 4000 and 5000 km s-1. This is not unreasonable given the structure of a stellar core: helium seems to ”bottom out” at km s-1 in SN 2007gr, while C is observed at km s-1 also in the early phase (Hunter et al., 2009, Fig. 14).
4.2 One-zone models, updated code
We have recently introduced a number of updates and improvements to the original code. These are described by Maurer & Mazzali (2010). In particular, we have introduced recombination of O i and revisited the treatment of ionization. The former improvement was necessary in order to reproduce the O i 7773 Å emission line, which was completely missing in the old version of the code (e.g. Mazzali et al., 2007b). The improved treatment of ionization was necessary in order to provide a more accurate estimate of the electron density so that recombination rates can be reliably computed. While ionization rates were obtained from a simple analytical form in the older version of the code, in the new version they are calculated taking into account the atomic and electronic loss processes of non-thermal electrons explicitly (Maurer & Mazzali, 2010).
Using the improved treatment of ionization (Maurer & Mazzali, 2010), oxygen and other light elements are more ionized than they are using the old, simpler treatment, while the ionization rates of Fe-group elements do not change significantly. Therefore the ionization balance of SNe Ia (which are dominated by Fe-group elements) is not influenced much by the new treatment of ionization, while the ionization balance of SNe Ib/c, which are dominated by carbon and oxygen, is.
The increased ionization of oxygen and other light elements results in a larger electron density, which in turn favours recombination and the formation of the O i 7773 Å line, as explained in Maurer & Mazzali (2010). In practice, this turns out to reduce the need for clumping with respect to the old version of the code. Using the old ionization treatment it was possible to mimic the effect of higher ionization (higher electron densities) introducing a clumping factor. This can explain why clumping seemed to be necessary in SNe Ib/c but not in SNe Ia. As an example, the spectra of SN 2007gr can be reproduced using . This is sufficient to guarantee that Fe iii recombines to Fe ii (in SNe Ib/c [Fe iii] lines are not seen, unlike SNe Ia). In fact, with the new code the Fe iii/Fe ii ratio is similar to the value obtained with the old code. Although clumping is not necessarily required to obtain good fits to the forbidden line observations, it may nevertheless be important e.g. for the formation of the O i 7773 Å line (Maurer & Mazzali, 2010).
The abundances of most elements in SN 2007gr (and other SNe Ib/c) are determined from neutral or singly ionised species (e.g. C i, O i, Mg i, Na i, Si i, S i, Fe ii, Co ii). Higher ionization weakens the flux in these lines. This must be offset by somewhat increasing the mass of these elements in the nebula. Since the less ionized species remain the dominant ones even with the updated treatment of ionization, the effect on the mass estimate is small. One exception is calcium, for which the abundance is obtained from the more highly ionised species, Ca ii. In this case, higher ionization results in a smaller calcium mass (by a factor of 2-4 depending on the individual case).
The results for day 172 and 390 are shown in Figures 1, 2, and 3 as red lines. While the fits are similar to those obtained with the old model, the masses of some elements change somewhat. We now discuss the two epochs in turn.
4.2.1 Day 172
The new one-zone model for day 172 is characterised by the same outer velocity ( km s-1) and 56Ni mass () as the old code, and the results are similar. However, as we discussed above, less clumping is required () since the ionization degree is higher. In the old model the average ionization degree was (O ii/O i, Fe iii/Fe ii, etc.), the electron density cm-3 and the electron temperature K. With the improved treatment, the ionization of certain elements (O, Mg, Si, S) is higher, %. The resulting increase in favours recombination of Fe iii, Co iii and Ni iii, reducing the need for clumping. The ionization of Ca increases less than for lighter elements, and it is still only %, while that of Fe is essentially unchanged. The electron density is now cm-3 and the electron temperature K.
The increased fraction of highly ionized material weakens the flux in lines of ions such as O i, Mg i, Si i, making it necessary to include more mass in the ejecta. The total mass is now within km s-1. Oxygen is still the most abundant element, with a mass of , followed by C (). The masses of the other elements are comparable to the old model, since their degree of ionization does not change, except for Ca, which is reduced by about a factor of 3 (), in accordance with the increase in ionization. Calcium is the element for which the new treatment of ionization has the biggest impact, as the Ca mass is estimated from the less abundant singly ionised species. Iron-group lines are also mostly from singly ionised species (Fe ii, Co ii), but these are actually the highly abundant lower ionization states.
The improvements to the synthetic spectrum introduced by the updated model are subtle, but one can see that the recombination line O i 7773 Å is now present (Figure 1, red line). The mismatch with respect to the data may be due to background subtraction: the strength of the line seems to be reproduced reasonably well. Alternatively, several Fe ii lines near 7800 Å may be poorly reproduced if their collision strengths are not accurate. With the higher ionization, a weak [S ii] line is also visible near 4000 Å.
The sharpness of the peaks of most emission lines contrasts with the more rounded shapes of the synthetic profiles, which are assumed to be parabolae as expected from a homogeneous, homologously expanding sphere. This can be improved upon using a multi-zone approach.
4.2.2 Day 390
As for the day 172 model, the outer velocity ( km s-1) and 56Ni mass () used were the same with the new code as with the old one. The same clumping as on day 172 () was used. In the optical, the main improvement is that now O i 7773 Å is reproduced (Figure 2, red line). Again because of the higher average ionization, a somewhat larger mass is required. The mass within km s-1 is now . The oxygen mass is and the carbon mass is . All other elements have masses similar to those used for the model with the old code, except for Ca, which is reduced to . The model now has cm-3 and K.
In the IR, the quality of the fits with the two versions of the code is very similar (Figure 3, red line). As with the old code, a rather small mass of silicon is sufficient to reproduce the [Si i] line near .
5 Shell Models
In this section we present shell models for nebular observations of SN 2007gr at 172 and 390 days after explosion. The models were computed using the updated version of the code. The results of one-zone models (in particular abundances and their ratios) were used as the starting point for the shell models, which were however optimised independently. In contrast to the one-zone modelling we do not present ’best fit’ models for each epoch, but we try to find one model which can reproduce the observations at 172 and 390 days simultaneously. Only sodium and magnesium mass estimates change between the two epochs.
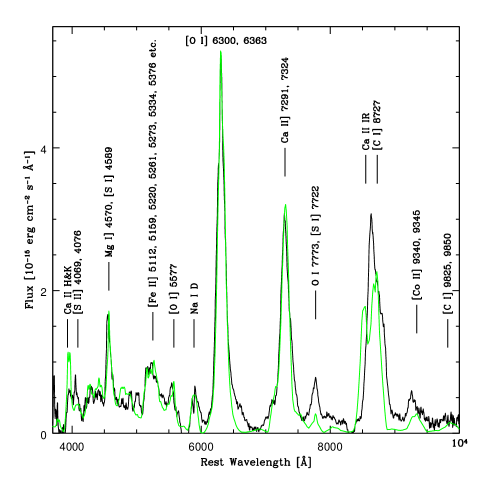
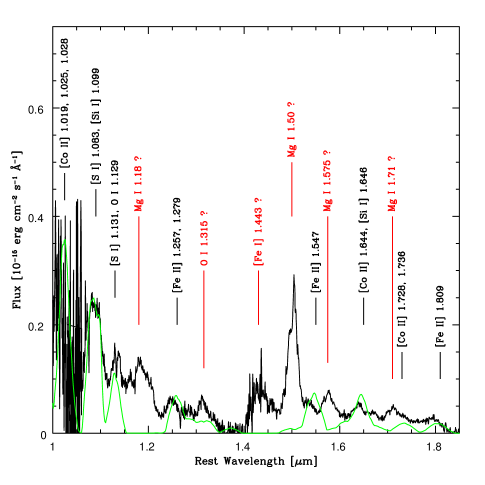
While there is no IR spectrum at 172 days, there is an IR observation of SN 2007gr at 190 days after explosion. In order to be able to merge the optical and the IR into a single spectrum, and lacking any IR photometry on day 172 (Hunter et al., 2009), we extrapolated the 190-day IR observation to 172 days. To do this, we computed the IR-to-optical flux ratio of synthetic models at 172 and 190 days, and scaled the 190-day IR observations to reproduce the expected ratio at 172 days. Since the difference is 18 days only, this extrapolation should be reasonable. We can then compare the optical and IR flux at both 172 and 390 days. Shell models for the day 172 optical spectrum and the rescaled IR spectrum of day 190 are shown in Figures 4 and 5, respectively, while fits for the day 390 optical and IR spectra are shown in Figures 6 and 7, respectively, as green lines.
The total mass of our model is below 6000 km s-1 (the model becomes inaccurate at higher velocities because -ray deposition is very small at low density). This is in rough agreement with the one-zone models (see Tables 1 and 2). In general, the masses derived with the shell model are slightly lower. This is expected since one-zone models usually produce too much flux around the peak of the lines, which leads to an overestimate of the line luminosity and thus of the amount of emitting material. Mass ratios of individual elements are similar to the one-zone models.
| epoch | Mass | M(C) | M(O) | M(Na) | M(Mg) | M(Si) | M(S) | M(Ca) | M(56Ni) |
|---|---|---|---|---|---|---|---|---|---|
| days | |||||||||
| 172 | 1.02 | 0.15 | 0.76 | 5.0e-5 | 9.5e-4 | 0.005 | 0.020 | 0.009 | 0.076 |
| 390 | 1.05 | 0.15 | 0.76 | 5.0e-4 | 0.028 | 0.005 | 0.020 | 0.009 | 0.076 |
One drawback of the nebular modelling approach is the poorly constrained distribution of 56Ni. The one-zone model assumes that 56Ni is distributed homogeneously. Some constraints on the precise distribution of 56Ni can be derived from the profile of the Fe ii blend near 5200 Å, but this is usually weak in SNe Ib/c. In addition, not all 56Ni distributions can consistently reproduce the evolution of the spectrum from 172 to 390 days. In our shell model 56Ni is more centrally concentrated than in the one-zone models, in agreement with theoretical expectations. The uncertainty on the total mass caused by this assumption should be %.
We use a clumping factor , which gives the best overall agreement with the observations, although individual lines or line ratios can sometimes be better reproduced using different values. Any moderate value, seems possible, taking into account uncertainties in the atomic data and the calculation procedure.
Since the same model is used for both epochs (apart from differences in the Na and Mg content), we discuss the two epochs together, focussing on individual elements.
The carbon distribution is mainly derived from modelling the [C i] 8727 Å emission at 172 days. The flux in this region is a blend of [C i] and Ca ii emission and the observed flux profile cannot be reproduced by any model with our nebular code. It may be that the Ca ii flux is scattered by the carbon line, a process which is not simulated by the code. Alternatively, [Fe ii] lines may be stronger than predicted by the model, as discussed in Section 4.2.1. At day 172, we try to reproduce the flux at the wavelength of the [C i] line. Using the same carbon abundance, at 390 days the synthetic [C i] 8727 Å line is stronger than in the observations. This may be an indication that at day 172 the line was powered by scattering of Ca ii flux: since this process is not treated in our code, we may have had to assume a higher carbon mass than is really present in the SN ejecta. Since no other line of carbon is visible, the estimate of the carbon mass may thus be uncertain by a factor of .
The oxygen distribution and mass are mainly derived from modelling the [O i] 6300, 6363 Å doublet. The observations are matched rather well by the synthetic flux at both epochs. The strength of the [O i] 5577 Å line depends on clumping. Using a clumping factor it is reproduced well at 172 days. At 390 days the line is no longer visible, since its formation is strongly favoured at higher densities. With the new code, several permitted O i lines which arise from recombination can be modelled. The O i 7773 Å line is not reproduced with sufficient strength at 172 days, but at 390 days the synthetic flux is in good agreement with the observations (see Maurer & Mazzali (2010) for a detailed discussion of the formation of this line). The O i 8447 Å line is blended with strong Ca ii emission and cannot be identified. The O i 9264 Å line is too weak at day 172. Since its formation is directly related to the 7773 Å line this is expected. In the IR, the O i 1.129 m line is swamped by [S i] 1.131 m. At 390 days the synthetic flux of the O i 7773 Å and 9264 Å lines reproduces the observations, taking into account the possible background. The O i 8447 Å line still cannot be identified in the observations.
Sodium and magnesium are modelled fitting the Na i D and Mg i] 4571 Å observations, but different masses are required at different epochs (see Sec. 4.2), which indicates that these ions are not accurately treated. In fact, the IR spectrum at day 190 shows a number of emission lines which are not reproduced by the code (see red marks in Figure 5). The line at 1.5 was identified as Mg i 1.503 by Pozzo et al. (2006). Several other lines can be identified as permitted Mg i transitions, as indicated in Fig. 5. These lines could be produced by recombination of Mg ii. To our knowledge, this is the first time these lines are identified in a nebular spectrum of a SN. The flux in these lines is intrinsically weak (note the factor difference in the vertical scale of Fig. 5 with respect to Fig. 4). Inclusion of a detailed treatment of Mg ii recombination may result in a better fit of these lines and in a more accurate determination of the Mg mass.
Two other lines are not identified in the IR spectrum at day 190. The line at m may be O i 1.315 m. This would be part of the O ii recombination process. The emission near 1.43 m was identified as [Fe i] 1.443 m by Pozzo et al. (2006) in the spectrum of a SN Ia obtained very early in the nebular phase. While this identification may be possible, the lack of any other [Fe i] lines, in particular 1.294 and 1.355 m, which arise from the same lower level (the ground state of Fe i) and should have similar strength is a strong argument against this option, which remains however the only one we could find.
The silicon distribution is modelled fitting the [Si i] 1.588, 1.608 and 1.646 m lines at 390 days, when the [Si i] feature can be observed clearly. The line is blended with [Fe ii] lines, and the same procedure described in Section 4.1.2 is used to determine the mass of silicon. At 172 days this feature is blended with [Co ii] emission. Also with the shell model the silicon mass remains remarkably small.
The sulphur distribution can be obtained modelling the [S ii] 4070 line at 172 days, when it is more clearly visible, as well as the [S i] 1.083 and 1.131 m lines. The [S i] 7722 Å line is blended with O i 7773 Å. Since it is difficult to identify individual lines in the region around 4000 Å, we fix the sulphur mass by fitting the IR lines accurately, while aiming at an acceptable agreement for the 4070 Å line. At 390 days the synthetic IR lines seem to be too weak, but the observations are very noisy in that spectral region.
The calcium distribution and total mass are rather uncertain. The ratio of Ca ii] 7300 Å and the IR-triplet depends sensitively on density and clumping. In addition, the IR-triplet may interact with C i 8727 Å, a process which is not simulated in the code. We fix the Ca mass modelling the 7300 Å emission at 172 days. This gives a consistent result also at day 390.
Since we cannot obtain an estimate of the helium mass, the total mass in SN 2007gr is uncertain. Hunter et al. (2009) derive a total mass of 2 M⊙ from light curve modelling, which would imply M of He.
Finally, the spectra for day 390 show an apparent mismatch between the optical and IR Fe lines: most IR lines seem to be overestimated while the [Fe ii] emission near 5200 Å is too weak. In order to test whether this may be the effect of clumping, we have computed a model with a clumping factor which brings the optical synthetic spectrum into reasonable agreement with the observations. This requires extreme clumping (): the model is shown in Figures 6 and 7 as a blue line. Increased clumping leads also to a reduction in the flux of the [C i] lines in the optical. However, despite the large change in the flux of the optical [Fe ii] lines, the IR [Fe ii] lines are almost unaffected: increased clumping leads to a reduction of the population of the highly excited levels from which the optical lines are formed, but leaves the much larger population of the less excited levels from which the IR lines form basically unchanged. Another possibility would be to increase the 56Ni mass. The [Fe ii] complex near 5200 Å can be reproduced in sufficient strength for M(56Ni), but then the IR Fe lines become too strong. Further increase of the clumping seems unlikely: already with the spectrum at day 172 is poorly reproduced. Considering the uncertainties in the background subtraction, the Fe atomic data, the 56Ni distribution and the geometry, it is not possible to determine the degree of clumping accurately, at least using the code in its present state.
6 Discussion
The availability of a simultaneous optical-IR spectrum for SN 2007gr makes it possible to attempt an accurate estimate of the ejecta mass via a census of all elements that are expected to be abundant in the ejecta of a SN Ic.
Our models indicate that SN 2007gr ejected of heavy elements. Our models are sensitive to material expanding with km s-1. We adopt here the values from the shell model, since this offers the best reproduction of the observed line fluxes and profiles. We use a 56Ni mass of , as determined from the luminosity at light curve peak (Valenti et al., 2008; Hunter et al., 2009), and confirm that that value is a reasonable estimate. We find that oxygen is the dominant constitutent of the heavy-element ejecta, with a mass of . The IME abundances, many of which can be determined thanks to the IR spectrum, are quite small. In particular the Si mass, which is determined via the [Si i] 1.6 m line, is only . Since the Si mass is estimated from neutral silicon, which is the dominant ion, this result is not much influenced by ionization.
Our estimate of the Ca mass carries a larger uncertainty than for other elements since it is estimated from lines of Ca ii, which is less abundant than Ca i. Uncertainties in the ionization treatment can affect the mass estimate significantly (a factor of 3 or so).
Although we use moderate clumping (), it is not possible, at the current level of accuracy, to determine the exact degree of clumping.
The rather low value of the ejected mass may be increased if the mass of He and possibly Ne, which may be present to some extent, could also be accounted for. Hunter et al. (2009) estimated an ejected mass of 2 M from light curve models. If this estimate is correct, the He mass of SN 2007gr should be . This may be consistent with early-time observations of He i absorption, depending on the degree of mixing of He and radioactive material in the outer layers of the SN ejecta.
The result that the mass of the CO core ejected by SN 2007gr was suggests that the SN progenitor was a star of comparatively low mass, possibly similar to the progenitor of the prototypical low-energy SN Ic 1994I. In the case of SN 1994I a star of was proposed as the likely progenitor (Nomoto et al., 1994; Sauer et al., 2006). The star would have lost its outer hydrogen and helium layers through binary interaction. The progenitor of SN 2007gr may have had a similar evolutionary history, with less stripping of the outer layers. The estimate of the progenitor mass is also broadly consistent with the observational constraints derived by Crockett et al. (2008) from pre-explosion images.
Hunter et al. (2009) estimated a 56Ni mass of 0.076 M⊙. Using this value, we can reproduce the temporal evolution of the nebular observations from 172 to 390 days. At 172 days the strength of the [Fe ii] blend near 5200 Å is reproduced reasonably well, while at 390 days the synthetic flux at these wavelengths is too low. Uncertainties in a number of paramenters, like the degree of clumping, the 56Ni distribution, Fe collision strengths, geometry, reddening and background subtraction could be responsible for this. A high clumping factor () or a larger 56Ni mass () can approximately reproduce the strength of the [Fe ii] blend. However, an increased 56Ni mass leads to an over-estimate of less energetic [Fe ii] lines redwards of 6000 Å. Also, a 56Ni mass of more than is inconsistent with the 172 days spectrum. Therefore we estimate a total 56Ni mass between 0.07 and , but favour the lower values. Our results are in fact consistent with the estimates of the total and 56Ni mass presented in Hunter et al. (2009).
The elemental abundances that we derived are generally consistent with the nucleosynthetic yields of a star at roughly solar metallicity (Woosley & Weaver, 1995; Thielemann et al., 1996; Nomoto et al., 1997, 2006). The major discrepancy with respect to those results is actually for silicon, which we find to be about one order of magnitude less abundant. Our results are unlikely to be grossly in error because of an incorrect estimate of the ionization: Si i, the ion which is observed in the IR and from which the Si mass is determined, is the dominant silicon ion. On the other hand, possible uncertainties on the collision strengths of Si i, or of the Fe ii lines which also contribute to the feature at m from which the silicon abundance is measured, may cause uncertainties. If the [Fe ii] lines were completely removed, and the collision strength for the [Si i] lines remained the same, the silicon mass would increase by a factor of . At the same time, the results cited above, while in overall agreement, differ the most for IME (Si, S, Ca), and more recent calculation (S.E. Woosley, priv. comm.) show a somewhat smaller silicon mass, although again a factor of 10 error is unlikely. The most likely reason for the discrepancy may lie with the collision strengths. A new calculation of these values would be desireable.
The detection of radio emission from SN 2007gr, indicating the presence of material moving at sub-relativistic velocities () in two opposite jets (Paragi et al., 2010) is a very interesting finding. Normally, SNe associated with relativistic outflows such as GRBs or XRFs have exceptionally large kinetic energies and massive progenitors. This does not seem to be the case for SN 2007gr. Actually, the nebular spectra of SN 2007gr show that the core of the SN has rather low velocities, in agreement with the early phase, where Valenti et al. (2008) found maximum velocities of km s-1. Actually, in a paper that appeared after submission of this paper, Soderberg et al. (2010) argue that the radio data are consistent with a non-relativistic explosion, in line with our optical results.
Another peculiarity of SN 2007gr was the detection of strong carbon lines at early times (Valenti et al., 2008). These lines were observed with velocities between 7000 and 10000 km s-1. In the nebular spectra the [C i] 8727 Å line is detected, suggesting the presence of carbon also at low velocities (below 5000 km s-1). Modelling indicates a C/O ratio of , which is consistent with the inner layers of the CO core of a massive star (Woosley et al., 1994; Thielemann et al., 1996; Nomoto et al., 1997, 2006; Maeder & Meynet, 2003, 2005).
Finally, GRB/SNe are thought to be very aspherical (Maeda et al., 2006). Some evidence that all SNe Ib/c are aspherical, to some extent, was found by Maeda et al. (2008) using late-time spectra. Maurer et al. (2010) confirmed this, but suggested that for SNe Ib/c which are not particularly energetic there may be only a rather weak correlation between the velocities of the inner ejecta (“the core”) as derived from nebular spectroscopy and those of the outer ejecta, as inferred from the spectra near maximum. The highest velocities detected in the optical spectra () are always much lower than the sub-relativistic velocities which can give rise to radio emission, so SN 2007gr may be a case where a very small amount of material was ejected at in an otherwise normal SN Ic (Paragi et al., 2010). However, the recently published results of Soderberg et al. (2010), who rule out material moving at are in much better agreement with our results. From the nebular spectra we find no evidence of major core asphericities in SN 2007gr. This does not rule out that some asphericity may affect the innermost regions of the ejecta (Maurer et al., 2010). This may also help with the missing silicon if more fallback occurs in the less nuclearly processed equatorial regions. Clearly, further study of these very interesting events is necessary before a coherent picture that encompasses the entire range of SNe Ib/c properties and their relation to the those of the progenitor star can emerge.
Acknowledgments
We gratefully acknowledge helpful conversations with Stan Woosley and Ken Nomoto. Partial support from contract ASI/COFIS is acknowledged.
References
- Arnett (1982) Arnett, W. D. 1982, ApJ, 253, 785
- Axelrod (1980) Axelrod, T. S. 1980, Ph.D. Thesis, Univ. of California, Santa Cruz
- Crockett et al. (2008) Crockett, R M., et al. 2008, ApJ, 672, L99
- Fassia et al. (2002) Fassia, A., Meikle, W. P. S., & Spyromilio, J. 2002, MNRAS, 332, 296
- Filippenko (1997) Filippenko, A.V. 1997, ARAA, 35, 309
- Fink et al. (2010) Fink, M., Roepke, F. K., Hillebrandt, W., Seitenzahl, I. R., Sim, S. A., & Kromer, M. 2010, A&A, 514, A53
- Hillebrandt & Niemeyer (2000) Hillebrandt, W., & Niemeyer, J. C. 2000, ARAA, 38, 191
- Hunter et al. (2009) Hunter, D. J., et al. 2009, A&A, 508, 371
- Leloudas et al. (2009) Leloudas, G., et al. 2009, A&A, 505, 265
- Li & McCray (1993) Li, H., & McCray, R. 1993, ApJ, 405, 730
- Maeda et al. (2006) Maeda, K., Nomoto, K., Mazzali, P. A., & Deng, J. 2006, ApJ, 640, 854
- Maeda et al. (2008) Maeda, K., et al. 2008, Science, 319, 1220
- Maeder & Meynet (2003) Maeder, G. & Meynet, A. 2003, A&A, 404, 975
- Maeder & Meynet (2005) Maeder, G. & Meynet, A. 2003, A&A, 429, 581
- Matheson et al. (2000) Matheson, T., Filippenko, A. V., Ho, L. C., Barth, A. J., & Leonard, D. C. 2000, AJ, 120, 1499
- Maurer et al. (2010) Maurer, J. I., et al. 2010, MNRAS 402, 161
- Maurer & Mazzali (2010) Maurer, J. I., & Mazzali, P. A. 2010, MNRAS, in press
- Mazzali et al. (2001) Mazzali, P. A., Nomoto, K., Patat, F., & Maeda, K. 2001, ApJ, 559, 1047
- Mazzali et al. (2006) Mazzali, P. A., et al. 2006, ApJ, 645, 1323
- Mazzali et al. (2007a) Mazzali, P. A., Röpke, F. K., Benetti, S., & Hillebrandt, W. 2007, Science, 315, 825
- Mazzali et al. (2007b) Mazzali, P. A., et al. 2007, ApJ, 670, 592
- Mazzali et al. (2008a) Mazzali, P. A., Sauer, D. N., Pastorello, A., Benetti, S., & Hillebrandt, W. 2008, MNRAS, 386, 1897
- Mazzali et al. (2008b) Mazzali, P. A., et al. 2008, Science, 321, 1185
- Motohara et al. (2006) Motohara, K., et al. 2006, ApJ, 652, L101
- Nomoto et al. (1994) Nomoto, K., Yamaoka, H., Pols, O.R., van den Heuvel, E.P.J., Iwamoto, K., Kumagai, S., & Shigayama, T. 1994, Nature, 371, 227
- Nomoto et al. (1997) Nomoto, K., Hashimoto, M., Tsujimoto, T., Thielemann, F.-K., Kishimoto, N., Kubo, Y., & Nakasato, N. 1997, Nuclear Phys. A616, 79
- Nomoto et al. (2006) Nomoto, K., Tominaga, N., Umeda, H., Kobayashi, C., & Maeda, K. 2006, Nuclear Phys. A777, 424
- Pakmor et al. (2010) Pakmor, R., Kromer, M., Röpke, F. K., Sim, S. A., Ruiter, A. J., & Hillebrandt, W. 2010, Nature, 463, 61
- Paragi et al. (2010) Paragi, Z., et al. 2010, Nature, 463, 516
- Pozzo et al. (2006) Pozzo, M., et al. 2006, MNRAS, 368, 1169
- Ruiz-Lapuente et al. (2004) Ruiz-Lapuente, P., et al. 2004, Nature, 431, 1069
- Ruiz-Lapuente & Lucy (1992) Ruiz-Lapuente, P., & Lucy, L. B. 1992, ApJ, 400, 127
- Sauer et al. (2006) Sauer, D. N., Mazzali, P. A., Deng, J., Valenti, S., Nomoto, K., & Filippenko, A. V. 2006, MNRAS, 369, 1939
- Smartt (2009) Smartt, S. J. 2009, ARAA, 47, 63
- Soderberg et al. (2010) Soderberg, A.M., Brunthaler, A., Nakar, E., & Chevalier, R.A. 2010, ApJ, submitted, [arXiv:1005.1932v1]
- Spyromilio et al. (2004) Spyromilio, J., Gilmozzi, R., Sollerman, J., Leibundgut, B., Fransson, C., & Cuby, J.-G. 2004, A&A, 426, 547
- Thielemann et al. (1996) Thielemann, F.-K., Nomoto, K., & Hashimoto, M.-A. 1996, ApJ, 460, 408
- Taubenberger et al. (2009) Taubenberger, S., et al. 2009, MNRAS, 397, 677
- Valenti et al. (2008) Valenti, S., et al. 2008, ApJ, 673, L155
- Woosley et al. (1994) Woosley, S. E., Eastman, R. G., Weaver, T. A., & Pinto, P. A. 1994, ApJ, 429, 300
- Woosley & Weaver (1995) Woosley, S. E., & Weaver, T. A. 1995, ApJS, 101, 181