Formation of Cosmic Crystals in Highly-Supersaturated Silicate Vapor Produced by Planetesimal Bow Shocks
Abstract
Several lines of evidence suggest that fine silicate crystals observed in primitive meteorite and interplanetary dust particles (IDPs) nucleated in a supersaturated silicate vapor followed by crystalline growth. We investigated evaporation of m-sized silicate particles heated by a bow shock produced by a planetesimal orbiting in the gas in the early solar nebula and condensation of crystalline silicate from the vapor thus produced. Our numerical simulation of shock-wave heating showed that these m-sized particles evaporated almost completely when the bow shock is strong enough to cause melting of chondrule precursor dust particles. We found that the silicate vapor cools very rapidly with expansion into the ambient unshocked nebular region; the cooling rate is estimated, for instance, to be as high as for a vapor heated by a bow shock associated with a planetesimal of radius . The rapid cooling of the vapor leads to nonequilibrium gas-phase condensation of dust at temperatures much lower than those expected from the equilibrium condensation. It was found that the condensation temperatures are lower by a few hundred K or more than the equilibrium temperatures. This explains the results of the recent experimental studies of condensation from a silicate vapor that condensation in such large supercooling reproduces morphologies similar to those of silicate crystals found in meteorites. Our results suggest strongly that the planetesimal bow shock is one of the plausible sites for formation of not only chondrules but also other cosmic crystals in the early solar system.
1 Introduction
Vapor-solid (VS) growth is a major process for dust formation in the inner region of the early solar nebula, where the gas pressure was too low for a liquid phase to exist stably. Actually, there are several lines of evidence in interplanetary dust particles (IDPs) and primitive meteorites that the dust condensed directly from the vapor phase as suggested for example by enstatite whiskers elongated along the -axis found in IDPs (Bradley et al., 1983) and m-sized polyhedral olivine crystals with various morphologies found in matrix of primitive meteorite (Nozawa et al., 2009). Hereafter, we refer to these fine crystals as cosmic crystals. It is an important issue to reveal the formation environment of these cosmic crystals for understanding the early history of the solar system.
To reproduce the cosmic crystals, evaporation and condensation experiments have been performed by many authors so far. Mysen & Kushiro (1988) carried out experiments in the system composed of Mg2SiO4-SiO2-H2 in the pressure ranging from to and in the temperature ranging from to to determine phase relations of the system. In these experiments, condensation of MgSiO3 and SiO2 phases took place from the Si-rich vapor, which was produced by incongruent vaporization of enstatite. Tsuchiyama et al. (1988) analyzed these condensates with the use of an analytical transmission electron microscope (ATEM) and a scanning electron microscope (SEM) to compare the condensates produced in the experiment with enstatite crystals found in IDPs (Bradley et al., 1983). They concluded that the characteristic textures of clinoenstatite found in IDPs were not reproduced in the evaporation and condensation experiments by Mysen & Kushiro (1988).
Recently, Kobatake et al. (2008) carried out evaporation and condensation experiments to investigate a relationship between the growth conditions and morphologies of cosmic crystals condensed from highly supersaturated vapors. They used a sphere with forsteritic composition (Mg2SiO4) as an evaporation source and succeeded in reproducing various morphologies observed in m-sized cosmic olivine crystals. They found that types of the morphology depend on the condensation temperature . Namely, they found bulky-types at , platy-types at , and columnar-needle-types at under the total pressure of to . Furthermore, Yamada (2009) carried out the same experiments except that the evaporation source has enstatitic composition (MgSiO3) and succeeded in reproducing enstatite whiskers elongated along the -axis at . They also reproduced enstatite crystals of platy-types at . Crystals produced in their experiments have morphologies very similar to the cosmic crystals (Bradley et al., 1983; Nozawa et al., 2009). The condensation temperatures of these cosmic crystal analogs produced in the experiments aforementioned are substantially lower than the temperature of , at which forsterite and enstatite condense in equilibrium from the solar nebula gas with the total pressure of (Grossman, 1972, e.g.,). The reproduction of the morphologies of cosmic crystals in the experiments suggests that the cosmic crystals were formed in highly supercooled vapors through nucleation and successive crystal growth; the condensation temperatures of the cosmic crystals are lower than those expected from the equilibrium theory by a few hundred degrees or more. To produce such supercooled silicate vapor, one would require significant evaporation of silicate dust followed by rapid cooling of its vapor.
As a possible site of formation of the cosmic crystals, we notice a localized bow shock produced by a planetesimal revolving in a highly eccentric orbit in a gas of the solar nebula; the shocked region was originally proposed as a plausible site for chondrule formation (Hood, 1998; Ciesla et al., 2004; Hood et al., 2005, 2009). When chondrule precursor dust aggregates enter the bow shock, they do not evaporate significantly because of their large sizes ( mm) but melt then cool and solidify to form chondrules. However, small dust particles of m in size will evaporate completely behind the shock front if the shock is strong enough, and produce silicate vapor (Miura & Nakamoto, 2005). The vapor cools rapidly with expansion in the vicinity of the planetesimal in orbit, resulting in a highly supercooled state.
In this paper, we examine formation of cosmic crystals in the regions behind planetesimal bow shocks. The point of our discussion is whether the silicate vapor realizes the highly supercooling in which cosmic crystals of various morphologies are produced, or not. We give an overview of our model in §2. Section 3 describes the process of dust evaporation by shock-wave heating to evaluate the evaporation fraction of silicate dust particles in a wide range of the physical parameters. In §4, we investigate expansion of the silicate vapor behind the bow shock and estimate the cooling rate. Section 5 examines the properties of the condensates such as their particle sizes and morphologies expected from our model and compare the results with those obtained by the evaporation and condensation experiments. We discuss a comprehensive scenario on the formations of chondrules, cosmic crystals, and other materials in chondrites in §6.
2 Outline of the Model
As stated in §1, a possible site for formation of fine cosmic crystals is a localized bow shock region associated with a planetesimal orbiting in an eccentric orbit. There arises relative velocity between a planetesimal and the nebular gas both orbiting around the Sun, where the eccentricity of the planetesimal orbit is large. Weidenschilling et al. (1998) showed that the Jupiter mean motion resonances can excite planetesimal eccentricities up to or more. Nagasawa et al. (2005) analyzed the orbital evolution of terrestrial planetary embryos including the effect of the sweeping Jupiter secular resonance combined with tidal drag during dissipation of the protoplanetary gas disk. They found that the eccentricities of planetary embryos with mass of are excited up to or more at maximum and oscillate around the mean value of if Jupiter has the eccentricity of (the current value is ), where is the Earth mass. The relative velocity between the eccentric planetesimal and the circularly orbiting nebular gas is estimated to be , where and are, respectively, eccentricity and inclination of a planetesimal orbit and is its Keplerian velocity. For , we obtain
| (1) |
where is semi-major axis of a planetesimal orbit. The supersonic velocities relative to the nebula gas produce bow shocks in front of the planetesimals (Hood, 1998; Ciesla et al., 2004). The relative velocity of for at is large enough to cause melting of mm-sized silicate dust aggregates (Iida et al., 2001) and evaporation of m-sized dust particles (Miura & Nakamoto, 2005) in a region of the asteroid belt, where the gas density is at the midplane of the gas disk in the minimum mass solar nebula model (Hayashi et al., 1985).
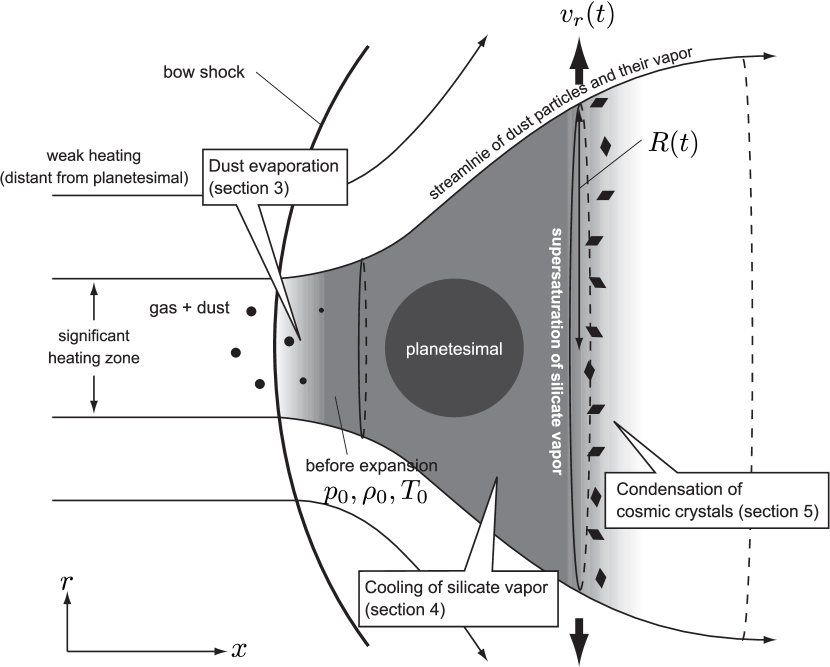
An outline of the model for cosmic crystal formation is illustrated in Fig. 1. When the shock front formed by supersonic orbital motion of a planetesimal passes through a region in the nebula, the nebular gas is abruptly accelerated whereas m-sized dust particles tend to keep their initial position because of their relatively large inertia. As a result, the dust particles find that they are exposed to a high-velocity gas flow suddenly and are heated to their evaporation temperature if the relative velocity and the gas density are large enough. Evaporation of the m-sized dust particles in the post-shock region will be discussed in §3. The silicate vapor thus produced expands outward because its pressure is higher than that of the ambient unshocked region. The cooling associated with the expansion will produce supercooled silicate vapor. We discuss the cooling process of the silicate vapor and its cooling rate in §4. The present model supposes that the cosmic crystals observed in meteorites are condensation products in the expanding silicate vapor supercooled behind the planetesimal bow shock. Their sizes, morphologies, and condensation temperatures strongly depend on the density of silicate vapor and the cooling rate. We shall show that various kinds of cosmic crystals observed in meteorites are formed in the cooling of the silicate vapor produced by planetesimal bow shocks (§5). We shall point out that the present model leads to simultaneous formation of chondrules and fine cosmic crystals (§6), and that their formation is an inevitable consequence of formation of planetary systems.
3 Evaporation of m-Sized Dust Particles
3.1 Evaporation fraction
We carry out numerical simulations of shock-wave heating by using a one-dimensional plane-parallel model developed by Miura & Nakamoto (2006). Actually, the structure of nebular gas around a planetesimal is not of one-dimensional plane-parallel structure. However, the two-dimensional hydrodynamic simulation by Ciesla et al. (2004) showed that the one-dimensional plane-parallel approximation was valid in the vicinity of a planetesimal we are concerned with, say, a few times of planetesimal radius . We set a computational domain along the -axis to be , where the -axis is parallel to the gas flow and at the shock front. In this region, the shocked gas structure can be regarded as one-dimensional plane-parallel (Hood et al., 2009). The simulations were carried out with varying the following input parameters: the planetesimal radius , the pre-shock gas number density , the dust-to-gas mass ratio , and the shock velocity . In the simulations we set the ranges of parameters to be , , , and , respectively. We take particle radius to be as a typical size of fine dust particles; a scaling to other sizes is easily done with the use of Eq. (3). The case of is investigated to see the dependence of the evaporation fraction on , although it will require significant settling or concentration of dust particles.
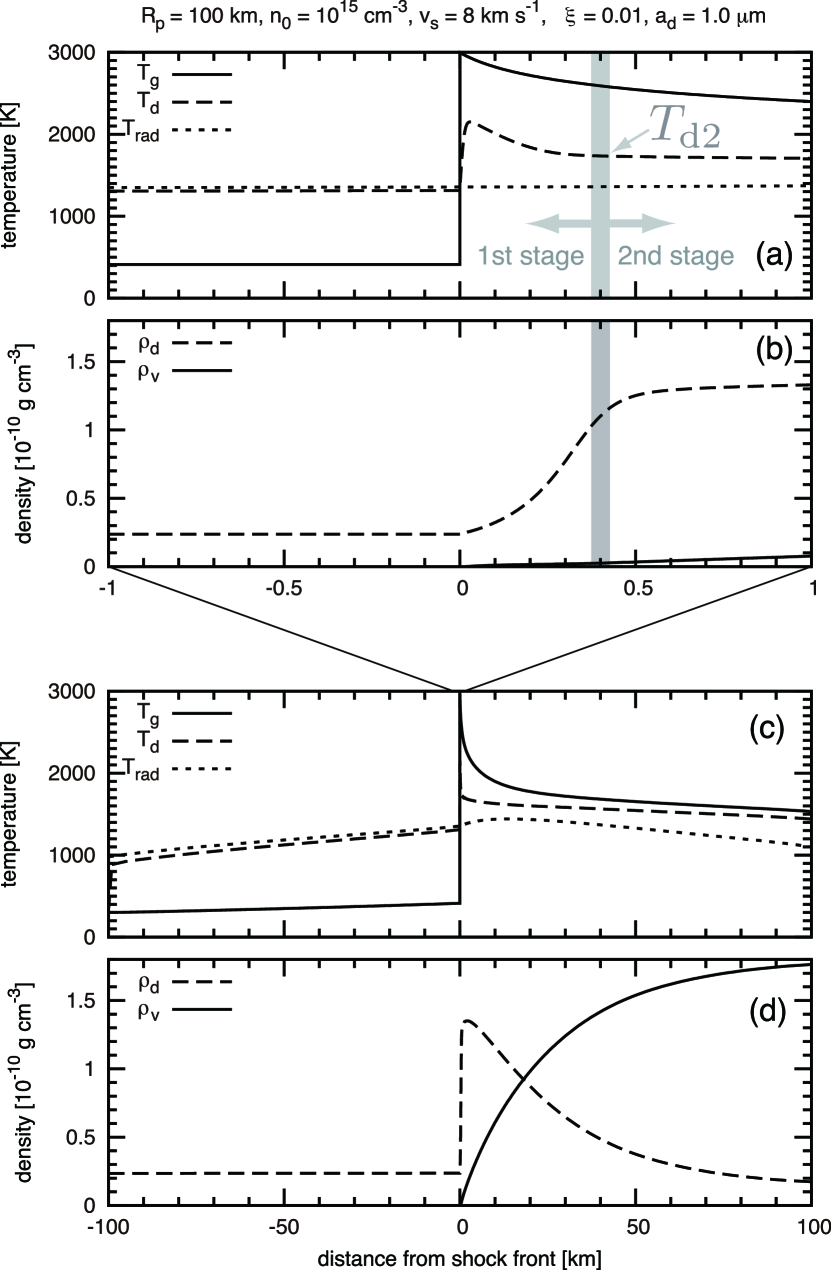
Figure 2 shows the result for , , , and . Panel (a) shows temperature profiles of the gas (, solid line), the dust particles (, dashed), and the radiation field (, dotted) in the vicinity of the shock front (). Dust temperature increases rapidly just behind the shock front by gas frictional heating due to the velocity difference between gas and dust. In this stage, which we call the first stage, the dust temperature is determined by a balance among frictional heating, radiative cooling, and interaction with the ambient radiation field. The first stage ceases in a short period of time (less than in this case) because dust particles come to stop relative to the ambient gas. Panel (b) shows density profiles of dust (, dashed) and silicate vapor (, solid), which is produced by evaporation of the dust. It is found that the dust density increases behind the shock front () because of deceleration by the gas friction. On the other hand, the vapor density remains much smaller than , indicating that evaporation of the dust particles during the first stage is negligible because of the very short duration of the first stage.
Panel (c) shows temperature profiles over a wide region around the planetesimal. The relative velocity between the gas and the dust particles is almost zero in almost all the region shown here (), so the frictional heating does not work. However, the dust temperature is kept above because of efficient collisional heating by the ambient hot gas; we call this stage of collisional heating the second stage. During the second stage, dust particles continue to evaporate gradually as is seen from the density profiles shown in panel (d). One should note that evaporation of dust occurs mainly in this stage. At the edge of the calculation zone (), the vapor density is , while the density of survived solid dust particles is . Therefore, the evaporation fraction defined by
| (2) |
equals 0.91 in the case shown in Fig. 2, implying that 90 % of the dust mass evaporate during the second stage.
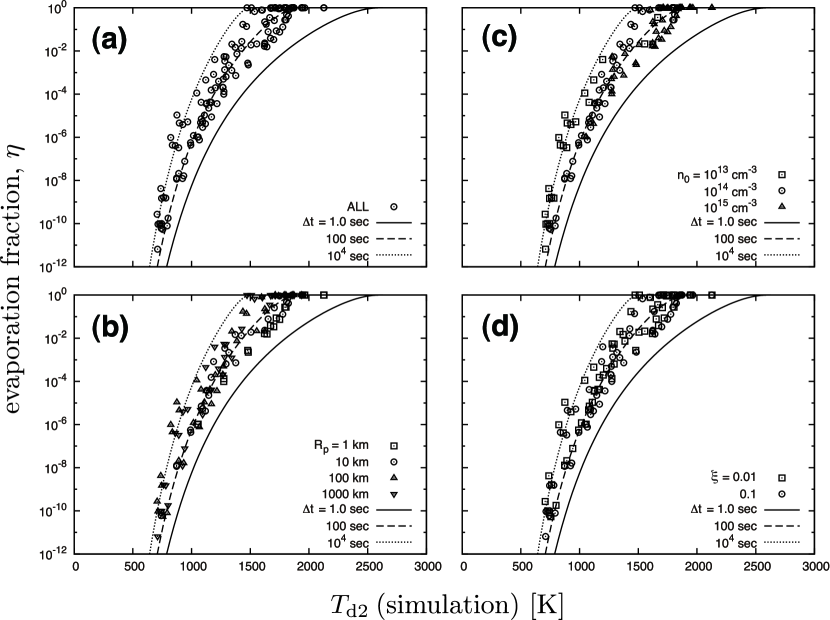
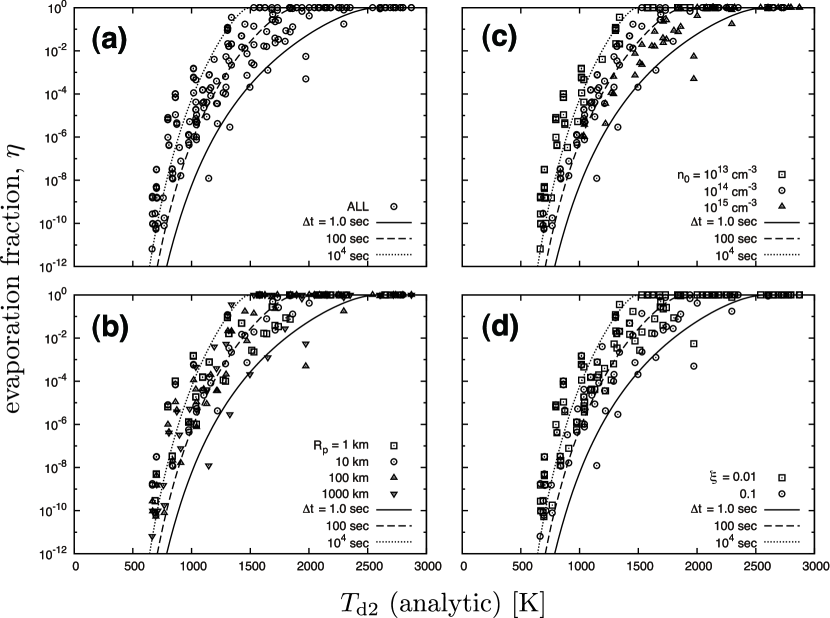
Figure 3 summarizes the evaporation fraction for various sets of values of the input parameters. Here, is shown as a function of dust temperature at the second stage. We take the dust temperature at the time when , where is root mean square of thermal velocities of the gas molecules and is the velocity of dust particles relative to the gas; the result changes little even if we take . Open circles in panel (a) show numerical results for all sets of the input parameters. Figure 3 indicates that increases rapidly with increasing . The temperature dependence of is given by
| (3) |
where is size decrease of a dust particle after finishing substantial evaporation and is given by
| (4) |
for a spherical dust particle (see Appendix A for the derivation). Here, is material density of the dust particle, is the evaporation rate, i.e. mass of vapor evaporating from unit surface area of the particle per unit time, and is latent heat of evaporation divided by the gas constant. Note that is independent of the original size and is small for a large dust particle. The factor
| (5) |
indicates an effective duration of evaporation during the cooling timescale defined by
| (6) |
at . Note that the numerical results are reproduced well by Eqs. (3) and (4). This implies that the evaporation fraction mainly determined by dust temperature in the second stage in spite that there are many other factors (, , , and ) that may affect evaporation of the dust particles behind planetesimal bow shock.
The duration of substantial evaporation is proportional to the cooling timescale of the hot gas. The expression of is very complex in general because it depends on various physical processes such as vibrational/rotational transitions of CO and H2O molecules, thermal dissociation of H2 molecules, Lyman- emission, and so forth. For a gas of the solar abundance, however, the major cooling process is Lyman- emission for and thermal dissociation of H2 molecules for (Miura & Nakamoto, 2005, see Fig. 7). The timescale of cooling due to Lyman- emission is shorter than . Below , the gas cools within a timescale of due to vibrational/rotational transitions of CO and H2O molecules (Miura & Nakamoto, 2005, see Fig. 7). The cooling timescale of the hot gas does not depend on the number density of the gas significantly. In the present case, the cooling timescale of reproduces the numerical results well as is seen from Fig. 3.
Finally, let us examine the dependences of the evaporation fraction on the parameters other than the temperature. Panels (b), (c), and (d) examine the dependence of the evaporation fraction on , , and , respectively. In panel (b), for , , , and are plotted by different symbols to see the dependence of on . There seems no clear systematic dependence of on even if we vary by three orders of magnitude. Panel (c) examines the dependence on , the number density of pre-shock gas. There seems to be a slight trend that decreases with increasing but the dependence is unremarkable compared with the scatter of the data for each value of . Panel (d) examines the dependence on the gas-to-dust mass ratio ranging from to but we found no systematic trend of on , neither, within the plausible range of .
3.2 Analytic estimation of the dust temperature
We have shown that the evaporation fraction is determined mainly by the dust temperature in the second stage. However, one needs to elaborate numerical simulations to calculate . Instead, we derived an approximate analytic expression (B2) of in Appendix B by considering the energy balance of a dust particle in the second stage. The analytic formula of will also be useful for calculating the dust temperature and its evaporation in a planetesimal bow shock in general.
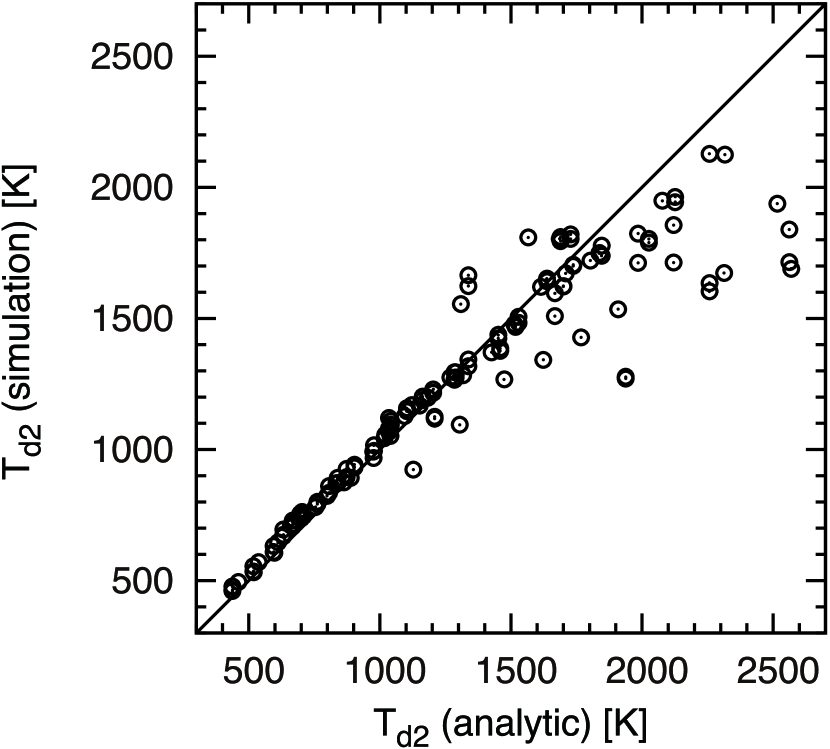
Figure 4 compares given by Eq. (B2) with that obtained from the numerical results. It is found that both agrees with the difference less than for . For , the numerical values of are systematically lower than those given by Eq. (B2). The reason of the deviation is that the analytic estimation ignores decrease in the optical depth due to dust evaporation in the shocked region. Actually, the decrease in the optical depth weakens the intensity of the ambient radiation field, which heat the dust. In consequence, the dust temperature decreases and its evaporation is suppressed. This negative feedback taken into account in the numerical simulation results in the numerical value of lower than that of the analytic estimation. The deviation at , however, does not influence the estimation of the evaporation fraction much because in any case at these temperatures as seen from Fig. 3.
Figure 5 shows the evaporation fraction as a function of dust temperature as does Fig. 3 but in the horizontal axis is replaced by the one calculated by using Eq. (B2). Although the scatter of the data plotted is larger than in Fig. 3, we see that the analytic formulae still reproduce the evaporation fraction .
4 Expansion and Cooling of the Shocked Gas
4.1 Equation of expansion
When the hot gas in the shocked region cools down to the temperatures lower than K, dust particles re-condense from the vapor produced by evaporation of the original dust. In this subsection, we consider hydrodynamics and cooling of the expanding gas cloud to characterize the environment for formation of the cosmic crystals. Let us assume cylindrical expansion with initial radius (see Fig. 1). Initial radius of the shocked region is on the same order of magnitude as planetesimal radius (Ciesla et al., 2004). Neglecting the expansion along the -axis, the expansion velocity is described by
| (7) |
where is the gas density and is the gas pressure. We use a one-zone approximation and approximate and as
| (8) |
where is radius of the gas cloud at time . We adopt a polytropic equation of state for the gas given by
| (9) |
where is initial gas density and is a parameter relating to the polytrope index. The conservation of mass during the expansion is expressed as
| (10) |
Using Eqs. (7) to (10), we obtain the equation of expansion of the gas given by
| (11) |
with and , where
| (12) |
is sound speed in the gas at . The dimensionless equations for expansion make it clear that the timescale of expansion of the shocked gas behind a planetesimal can be scaled by the sound-crossing time .
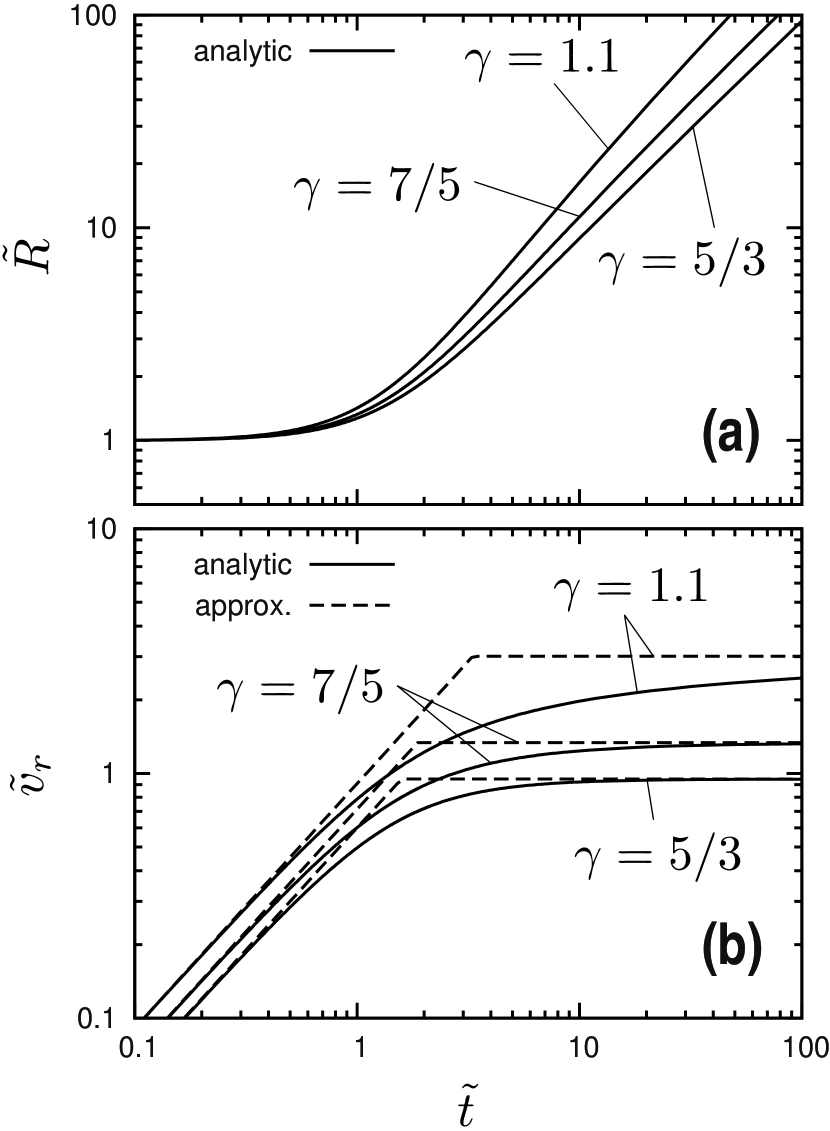
Figure 6 shows the solutions of Eq. (11) for the initial conditions of and (see Appendix C). It is clearly seen that the expansion is separated into two phases; the acceleration phase, in which increases with time but remains almost at the initial radius , and the expansion phase, in which the shocked region begins to expand and almost equals a constant terminal velocity. The dashed curves in panel (b) show approximations of in the two limiting cases of and (see Appendix C) given by
| (13) |
where .
4.2 Cooling rate of the shocked gas
Using the relation
| (14) |
given by Eqs. (9) and (10), and , we obtain the time variation of the gas temperature as
| (15) |
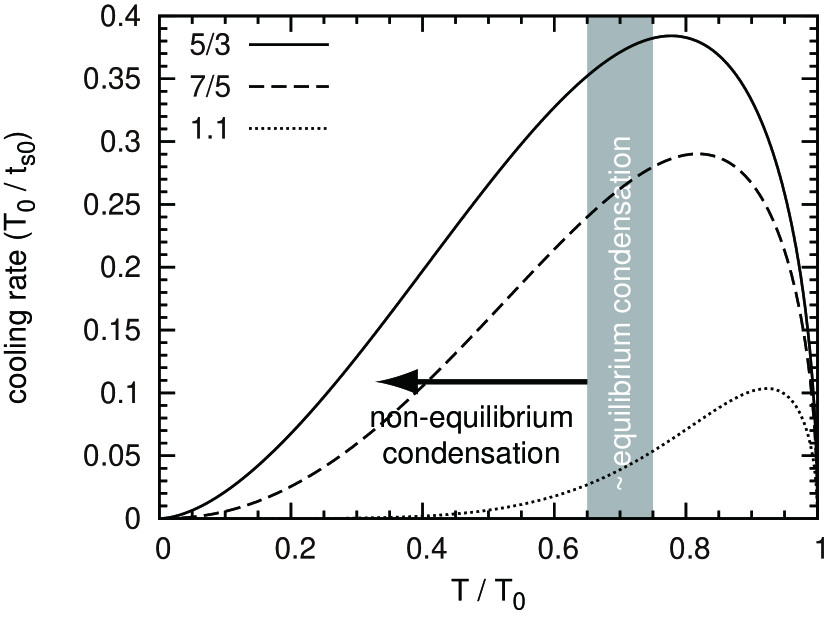
with the use of Eq. (C1) in Appendix C. One sees from Eq. (15) that the cooling rate as a function of increases with increasing at first, reaches a peak, and decreases in proportion to . Figure 7 shows the cooling rate as a function of which decreases monotonically with time.
To evaluate the cooling rate, we need to specify a value of the initial temperature . The gas temperature just behind the shock front could be higher than or more depending on the Mach number . However, even if the temperatures of the gas exceeds , it cools rapidly by dissociation of hydrogen molecules and is kept around owing to the energy balance between re-formation of hydrogen molecules by three-body reaction and their dissociation (Iida et al., 2001). We set to estimate the cooling rate around the condensation temperatures. To consider condensation through nucleation, on the other hand, we should refer to the cooling rate when the vapor becomes supersaturated. Taking the equilibrium condensation temperatures of for forsterite and for enstatite for the total pressure of (Grossman, 1972) as a measure of estimating the condensation temperature, we have and for and (see Fig. 7). We set to be planetesimal radius in what follows. In consequence, the cooling rate is estimated to be:
| (16) | |||||
It should be pointed out that cooling of the shocked gas given by Eq. (16) can be used so far as the pressure of the shocked gas is much larger than the ambient gas pressure . The shocked gas pressure before the expansion is for the shock velocity of an H2 gas of . The gas temperature at that time is as a result of the balance between H2 dissociation and its re-formation (Iida et al., 2001; Miura & Nakamoto, 2005). The pressure and temperature decrease by subsequent cylindrical expansion. When the temperature drops to the typical condensation temperature of , the radius of the cylinder is 2.4 times the initial one for adiabatic expansion, and the shocked gas pressure also decreases to of that before expansion. However, the gas pressure is still higher than by an order of magnitude. Therefore, Eq. (16) is applicable throughout the expansion phase of interest including the time of condensation.
We focus here the adiabatic expansion because the radiative losses are negligibly small for small shocks as is shown below. Main coolants of the nebula gas at are vibrational emissions of CO and H2O molecules. The cooling timescale due to these vibrational emissions was estimated to be , which does not significantly depend on the gas density (Miura & Nakamoto, 2005). On the other hand, the cooling timescale due to the adiabatic expansion behind a planetesimal is shorter than for planetesimal radius of (see Eq. (16)). Therefore, the shocked gas cools by the expansion before the vibrational emissions remove the thermal energy significantly. The radiative losses might work for large shocks () because the expansion takes longer time. However, a large optical depth for these emissions resulting from large shocks prevents the radiative losses from being efficient.
4.3 Possibility of chondrule formation
In the formation of chondrules, their cooling rate during solidification is one of the key physical quantities. According to the planetesimal bow shock model, the cooling rate was estimated to be for planetesimal radius , for , and for (Hood et al., 2005). On the other hand, the cooling rate of the shocked gas calculated from Eq. (16) is , , and for , , and , respectively. Although Eq. (16) is not a cooling rate of a chondrule itself but of the shocked gas strictly speaking, we note that both estimations of the cooling rates are comparable; this is because the cooling of chondrules is regulated by that of the shocked gas (Iida et al., 2001). Therefore, Eq. (16) measures the cooling rate of chondrules.
A widely accepted range of the cooling rate of chondrules at solidification is (Hewins et al., 2005, and references therein), which is much slower than that predicted by Eq. (16). However, we consider that this disagreement does not necessarily exclude planetesimal bow shocks as a chondrule formation site. In fact, some authors assert rapid cooling rates, which are in the range estimated from Eq. (16). Yurimoto & Wasson (2002) proposed that rapid cooling () was necessary to account for the observed Fe-Mg and O-isotopic exchange in a CO-chondrite type-II chondrule. Wasson & Rubin (2003) proposed that very thin overgrowths on some relict grains in chondrules must have been formed by the rapid cooling. The crystallization experiments of a melt droplet by a levitation method succeeded in reproducing chondrule-solidification textures in the experimental conditions of the rapid cooling (Tsukamoto et al., 1999; Nagashima et al., 2006). Although the rapid cooling scenario does not seem to have been accepted widely to the meteoritic community (Hewins et al., 2005), there has been no definite evidence that rejects the rapid cooling scenario completely. Therefore, we consider that the planetesimal bow shock is still one of the possible models to be studied for chondrule formation.
5 Formation of Cosmic Crystals
5.1 Cooling parameter for homogeneous nucleation
Cosmic crystals condense in the course of cooling of the vapor produced by a planetesimal bow shock. When almost all dust particles evaporate by the bow shock, there is no solid surface available on which the supersaturated vapor condenses. In this case, cosmic crystals are formed through homogeneous (spontaneous) nucleation. In homogeneous nucleation, condensation does not begin when the cooling vapor becomes saturated but begins effectively after the vapor becomes supersaturated to a certain degree.
Yamamoto & Hasegawa (1977) and Draine & Salpeter (1977) formulated a grain formation process though homogeneous nucleation in a vapor and derived analytical expressions of a typical size of grains and their actual condensation temperature in a supercooling state as functions of two dimensionless parameters. One is a cooling parameter defined by
| (17) |
where is collision frequency of vapor molecules in thermal motion, is cooling timescale of a vapor at with being equilibrium condensation temperature, and is latent heat of condensation divided by the gas constant and equivalent to that of evaporation (see Appendix A). Note that is a temperature at which a vapor and a bulk condensate co-exit in chemical equilibrium and approaches as gets so long that the equilibrium between the vapor and the condensate is realized. Grain size is mainly determined by and is roughly given by for , where is the radius of a vapor molecule (Yamamoto & Hasegawa, 1977). In Eq. (17), is calculated from the vapor density , and from the cooling rate of the vapor (see Appendix D). The other parameter is a dimensionless surface tension defined by
| (18) |
where is surface tension of a condensate and (i.e. equivalent radius of a sphere whose volume equals the volume of a unit cell of the condensate) with being molecular weight of a unit cell of a condensate, is atomic mass unit, and its bulk density. A degree of supercooling is mainly determined by the parameter and is approximately related to as (Yamamoto & Hasegawa, 1977).
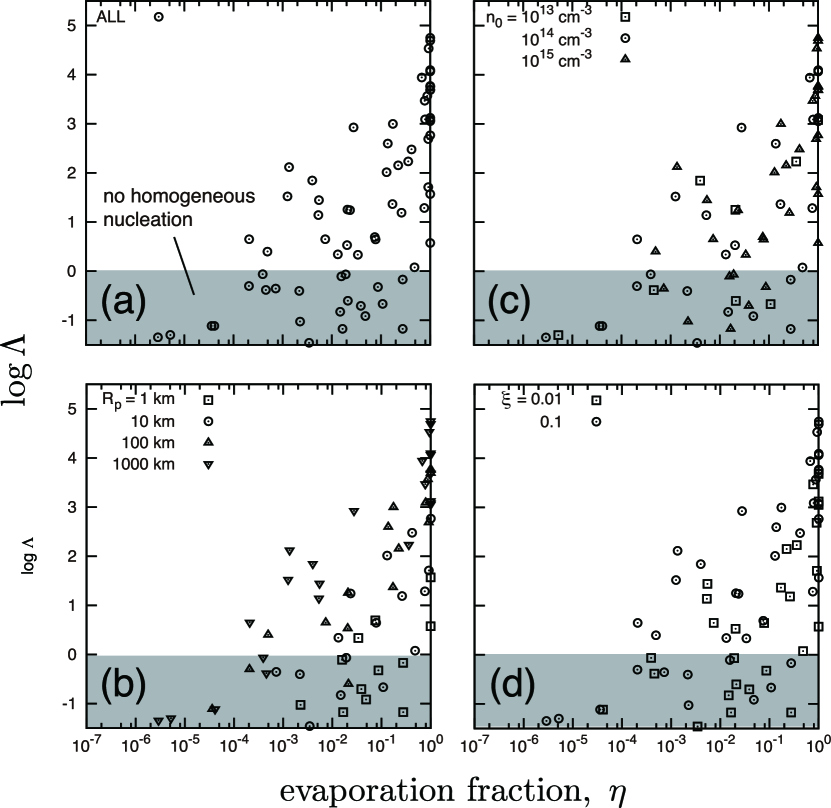
Figure 8 shows a relation between and the evaporation fraction . Each of the plots indicates calculated in §3 for a given set of values of the parameters, while is calculated from Eq. (D2). All panels indicate the trend that increases with . This is simply because the larger degree of evaporation of pre-existing dust is, the larger amount of the vapor is produced, which in consequence provides favorable conditions for homogeneous condensation of cosmic crystals. Note that homogeneous condensation is possible only if ; otherwise, the vapor is too tenuous for condensation to occur. Panel (a) shows the results of the calculations for all of the parameter sets, indicating that there appear many cases of for . Even the cases of as large as are realized for complete evaporation () of pre-existing dust. The contribution to the vapor production comes mainly from m-sized dust particles if their size distribution is steeper than . The presence of many cases of implies that condensation of cosmic crystals through homogeneous nucleation behind planetesimal bow shocks is possible for . We note that a variety in the -values suggests formation of various kinds of cosmic crystals. The panel (b) displays the dependence of and on the planetesimal radius . From panel (b), one sees that the homogeneous condensation occurs hardly except for for a bow shock produced by small planetesimals of but occurs almost always for a planetesimal of even if the evaporation is not so significant ().
5.2 Size and morphology of cosmic crystals
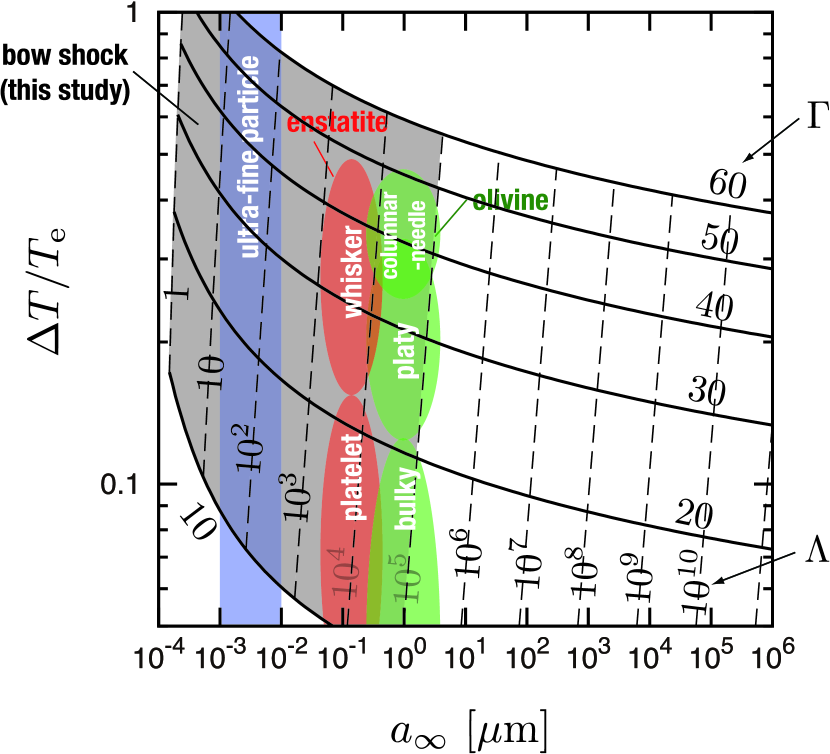
Figure 9 displays typical size of condensed particles and supercooling in terms of and . The supercooling in the vertical axis is normalized by the equilibrium condensation temperature . Each solid curve shows the relation between and for a constant value of , and dashed lines combine points for the same value in (Yamamoto & Hasegawa, 1977). The grayed region indicates a parameter range expected from the planetesimal bow shock. The possible range of was discussed in §5.1. The values of , on the other hand, have uncertainties because of short of the experimental data for the surface tension of forsterite and enstatite. For forsterite, is measured to be in vacuum for a {010} surface and larger values for other ones (de Leeuw et al., 2000), which corresponds to or more. For enstatite, there are no reliable data of surface tension. We assume the similar value as that of forsterite. In the calculations, we take for safety. It should be noted that the sizes and the supercoolings revealed from the analyses of a variety of cosmic crystals are included in the region realized by planetesimal bow shocks. Let us discuss in more detail the formation conditions of each of the cosmic crystals shown in Fig. 9.
5.2.1 Enstatite whisker and platelet
The experiment by Yamada (2009) showed that formation of enstatite whiskers elongated toward the -axis required the degree of supercooling of . They also reproduced platy-type enstatite crystals at . It is interesting to note that the whisker has larger than the platy-type, although precise values of their surface tension are unknown. Typical size of the enstatite crystals is - , which size is similar to that of natural samples found in IDPs (Bradley et al., 1983). A set of these conditions is shown by the red region in Fig. 9, indicating that enstatite whiskers and platelets can be formed by planetesimal bow shocks of . This range of is realized if the bow shocks are produced by planetesimals of intermediate size () and lead to almost complete evaporation of the original dust (). If the amount of the silicate vapor is small leaving a large amount of dust particles that survived evaporation (), on the other hand, the vapor will condense onto the dust surface. This case yields other types of thermally-processed particles observed in chondritic meteorites (see §6).
5.2.2 Olivine crystals with various morphologies
Kobatake et al. (2008) examined supercooling required for formation of olivine crystals by a laboratory experiment. They showed that bulky-type olivine crystals were reproduced at , the platy-type at , and the columnar-needle-type at . As was so for enstatite, the needle-type has larger than the platy-type; the bulky type has the smallest . Typical size of the condensates is m, which size is close to those of the natural samples found in the matrix of Allende meteorite (Nozawa et al., 2009). The green region shows the supercooling and the sizes for these fine olivine crystals, indicating that these particles can be formed by planetesimal bow shock of . This condition is realized by the bow shocks produced by relatively large planetesimals () associated with almost complete evaporation of the original dust particles.
5.2.3 Ultra-fine particles
Toriumi (1989) observed fine particles in the matrix of Allende meteorite using a SEM and a TEM and measured their sizes . The observed size distribution could be reproduced by a log-normal one for with its peak at and by a power law for . We display the size range of the ultra-fine particles by the blue region in Fig. 9. The size range suggests that is a plausible condition for formation of ultra-fine particles. This is in agreement with the conclusion of Toriumi (1989) that ultra-fine particles seem to have been formed by condensation from a vapor far from equilibrium in the early solar nebula. The present model implies that ultra-fine particles were formed by bow shocks produced by much smaller planetesimals () than those producing m-sized cosmic crystals, associated with almost complete evaporation. The formation condition of also realizes for large planetesimals () and small evaporation fraction (), however, in this case the ultra-fine particles generated from the vapor are very rare because of the tiny evaporation fraction.
5.3 Heterogeneous condensation for incomplete evaporation
We discussed formation of cosmic crystals through homogeneous nucleation in §5.1 and §5.2 assuming that almost all dust particles evaporate by a planetesimal bow shock. There is an opposite case that a substantial fraction of the dust particles survives against evaporation and acts as seed nuclei and that condensation occurs through nucleation on their surfaces (heterogeneous condensation). Which type of condensation actually occurs depends on the total surface area of dust particles available for heterogeneous nucleation. We shall show below that both types of condensations can occur depending on the radii of planetesimals generating bow shocks and on the evaporation fraction.
In homogeneous nucleation, condensation does not begin when the cooling vapor become saturated but begins effectively after the vapor becomes supersaturated to a certain degree. Namely, there arises some induction time after the vapor becomes saturated (Yamamoto & Hasegawa, 1977). The induction time is related to the cooling timescale as
| (19) |
where for situations we consider in this paper ( and as explained in §5.1 and §5.2). The time intervals required for nucleation and growth is about ten times shorter than the induction time (Yamamoto & Hasegawa, 1977). Therefore, represents a typical timescale for dust formation through homogeneous nucleation after the vapor becomes saturated.
In heterogeneous nucleation, on the other hand, we estimate its timescale by using the adhesion timescale, which provides an underestimate of the timescale of heterogeneous condensation because it ignores the induction time for heterogeneous nucleation. The adhesion timescale is the one during which most of the vapor molecules sticks onto the surface of dust particles. For silicate condensation, we regard SiO molecule as a key species that controls the rate of condensation (see also Appendix D). Denoting the radius of the dust particles by , the adhesion timescale is estimated to be:
| (20) |
where is density of dust particles surviving in the post-shock region against evaporation, is sticking probability of vapor molecules onto the dust surface, and is molecular weight of SiO. One should note that, in Eq. (20), the factor indicates total surface area of the dust particles per unit volume and is mean thermal velocity of SiO molecules.
Homogeneous nucleation takes place if . This condition is satisfied when the planetesimal radius is relatively small (), or there are few survived dust particles because of significant evaporation (). In this case, cosmic crystals condense directly from the vapor. In contrast, heterogeneous condensation becomes effective if the planetesimal radius is large () and a substantial fraction of dust particles survives against evaporation (). We shall discuss generic relations between cosmic crystals and chondrules in § 6 in detail.
6 Summary and Discussion
Chondritic meteorites are composed of materials that have been experienced thermal processing of various degrees in the early solar nebula. These materials include chondrules, fine-grained rims on chondrules and interchondrule matrix (Alexander, 1995), and cosmic crystals discussed in the previous section. In this section, we discuss how the planetesimal bow shock scenario explains the formations of these chondritic materials.
A planetesimal bow shock was originally proposed as a possible site for chondrule formation (Hood, 1998). Iida et al. (2001) showed that millimeter-sized dust aggregates (chondrule precursors) are heated and melt behind a shock front if the shock velocity and the pre-shock gas density are in an appropriate range. Complete evaporation hardly occurs for chondrule precursors because of their large size (see Eq. (3)). Their contribution to the vapor production is negligibly small compared with that of m-sized dust particles for the dust size distribution steeper than . Large molten chondrule precursor dust survives against evaporation, cools and solidifies to form chondrules. In contrast, m-sized particles evaporate significantly in the hot gas behind the planetesimal bow shock and produce silicate vapor. The silicate vapor cools rapidly behind the bow shock and becomes supersaturated, leading to condensation to produce various kinds of materials observed in chondritic meteorites and IDPs.
The condensed materials exhibit a wide variety in morphologies and sizes depending on their formation conditions such as the cooling rate and the evaporation fraction of m-sized dust particles. The cooling rate is inversely proportional to the size of a planetesimal that produces a bow shock (see Eq. (16)), thus decreases with time on average, namely, with growth of planetesimals. The evaporation fraction changes by many orders of magnitude in the range of the shock conditions realized in early solar nebula (Iida et al., 2001).
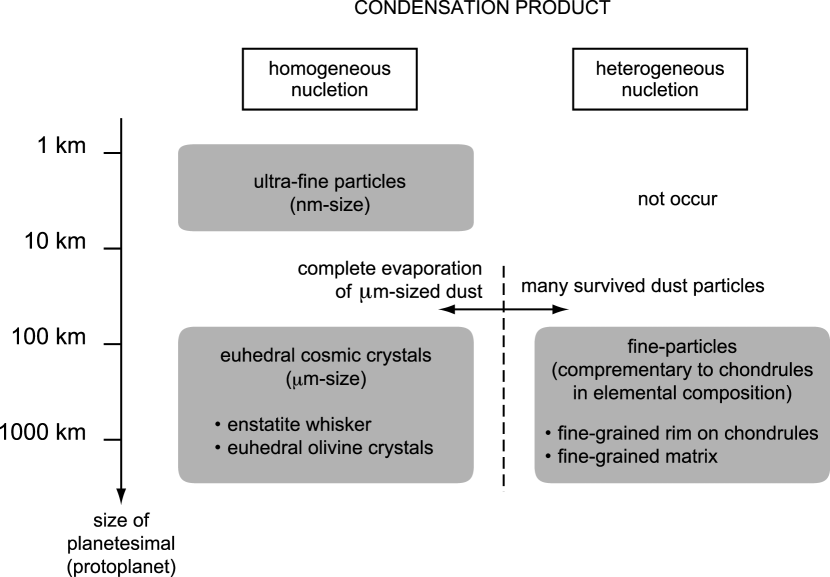
Figure 10 summarizes condensation products in the course of the planetesimal growth. At the early stage of km, the vapor produced by small planetesimals cools so rapidly that the cooling parameter is , which is realized for (see Fig. 8b). Condensation of the vapor through homogeneous nucleation for leads to formation of nm-sized ultra-fine particles as observed in the matrix (see from Fig. 9). Furthermore, the results of §5.3 indicate that the rapid cooling prevents heterogeneous condensation on survived dust particles because of rapid consumption of the vapor by homogeneous condensation to form ultra-fine particles. To summarize, most of the vapor condensed to the ultra-fine particles at the early stage of planetesimal growth. When planetesimals grow up to a several or more, condensation occurs through both homogeneous and heterogeneous nucleations. If almost all of the small dust particles evaporate () behind the bow shock, m-sized euhedral silicate crystals condense through homogeneous nucleation. The cooling parameter is for (see Fig. 8b) for planetesimals of km. This situation leads to condensation of enstatite whisker elongated to -axis as found in IDPs (Bradley et al., 1983) and polyhedral olivine crystals as found in the matrix of Allende meteorite (Nozawa et al., 2009) (see Fig. 9). Bare chondrules without fine-grained rims could also be formed in this case. On the other hand, if many of the dust particles survive against evaporation () and suffer partial evaporation, the vapor condenses heterogeneously onto the survived dust particles, resulting in the formation of other kinds of meteoritic materials. The vapor condensed heterogeneously on chondrules already solidified could form fine-grained rim on their surfaces. The survived m-sized dust particles would also be covered with materials condensed from vapor, and would accumulate as fine-grained interchondrule matrix in chondritic meteorites after that. It is worth noting that the partial evaporation of dust particles would lead to elemental fractionation. The fractionated vapor rich in volatile elements re-condensed within a short period of time (see Eq. (20)) on the survived dust particles. A fine-grained rim of a chondrule and a fine-grained interchondrule matrix thus produced would have elemental composition complementary to that of the chondrule. The composition of the whole particle should be the same as that of the original dust particles before evaporation according to the present model. This is consistent with the genetic relationship among chondrules, interchondrule matrix, and fine-grained rims that these components either formed from a common source material, are products of the same process, or have exchanged materials during formation (Huss et al., 2005).
In summary, the planetesimal bow shock model can provide a comprehensive scenario for the formation of various cosmic crystals and other materials observed in chondritic meteorites. Because the heating events happened in a localized region of the shocked gas within a short period of time, one may expect that a series of the thermal processing, heating, evaporation, and condensation completed in a closed-system. The scenario is in harmony with the genetic relationship suggested by the analyses of chondritic meteorites and IDPs that these are produced in the course of the processing from a common source material together with exchanges of the materials during their formation.
Appendix A Size Decrease of a Particle by Evaporation and the Evaporation Fraction
Let us consider evaporation of a spherical dust particle of initial radius . The evaporation fraction is given by
| (A1) |
where is decrease in radius due to evaporation. Equation (A1) indicates clearly that depends only on , the ratio of the size decrease to the initial size. Since the size decrease due to evaporation is independent of the particle radius except through a slight dependence of the dust temperature on , the increase in the particle radius simply causes the decrease in according to Eq. (A1). For example, even if m-sized dust particles evaporate almost completely (), chondrule-sized particles () evaporate by only a small fraction of . We carry out the calculations for , but one can evaluate for other by using Eq. (A1).
With the use of the evaporation rate , the size decrease by evaporation during cooling from temperature to is expressed by
| (A2) |
The evaporation rate as a function of temperature behaves as
| (A3) |
according to the Hertz-Knudsen equation (Nagahara et al., 1996; Miura et al., 2002, see), where is a constant. Here, is latent heat of evaporation in units of temperature, where is that in units and is the gas constant in units of . In the present case, we are concerned with evaporation of forsterite (Mg2SiO4), for which . This leads , where the factor of 6 results from the stoichiometric coefficients of the chemical reactions at evaporation (Miura et al., 2002, see Eq. (38)). According to the measurement of evaporation rate of forsterite, depends also on the partial pressure of ambient hydrogen molecule (Tsuchiyama et al., 1998), but we may take the pressure at in Eq. (A2) because is determined by the physical conditions at as will be seen below. Integration on the RHS of Eq. (A2) can be performed by noting that is a rapidly varying function compared to the remaining function in the integrand. Integrating by part and remaining the term of order , one obtains
| (A4) |
where the contribution from the upper limit of the integral is negligible. Here
| (A5) |
is cooling timescale of dust particles at , for which we take dust temperature in the second stage.
Appendix B Dust Temperature behind Shock Front
We give here an analytic expression that gives in good approximation of the dust temperature in the post-shock region after the relative velocity between the gas and dust particles is almost damped (the second stage). The dust temperature at this stage, , is determined by the energy balance between collisional heating by the ambient hot gas and the radiative cooling:
| (B1) |
where is post-shock gas temperature, is post-shock gas number density, is ambient radiation temperature, is mean molecular weight of the gas, and is the Stafan-Boltzmann constant. Here, we approximated the emission and absorption coefficients to be unity (Miyake & Nakagawa, 1993). Since in the second stage as seen from Fig. 2(c), one obtains
| (B2) |
from Eq. (B1) by using the approximation that , where .
In Eq. (B2), the post-shock gas number density is given from the Rankine-Hugoniot relation and the almost isobaric condition for the post-shock gas in the one-dimensional plane-parallel geometry (Susa et al., 1998; Miura et al., 2002) by
| (B3) |
where is the gas density in the pre-shock region and is the shock velocity.
The post-shock gas temperature in Eq. (B2) may be obtained by using the Rankine-Hugoniot relation. However, we have to pay attention that, at high temperatures of , the gas cools very rapidly due to the dissociation of hydrogen molecules (Iida et al., 2001). Therefore, we set as
| (B4) |
The radiation temperature at the shock front is given by taking the blanket effect into account (Miura & Nakamoto, 2006) as
| (B5) |
where is optical depth of the pre-shock region and is the fraction of the gas energy flux that returns upstream in the form of radiation. We set for simplicity. The optical depth is estimated to be
| (B6) |
where is dust-to-gas mass ratio in the pre-shock region and is dimension of the pre-shock region, in which the dust particles contribute to the blanket effect around the shock front111 corresponds to in Miura & Nakamoto (2006).. We set in this study (see §3.1).
Appendix C Solutions of the Equations of Expansion
Integrating Eq. (11) from to after multiplying on both sides, we obtain the expansion velocity to be:
| (C1) |
for the initial conditions of and . Equation (C1) is integrated further to yield the radius as a function of time as
| (C2) |
The right-hand side of Eq. (C2) may be expressed by the hypergeometric function but numerical integration is more practical to get the results, which are shown in Fig. 6(b) by solid curves.
In the limits of and , the velocity is approximated to be:
| (C3) |
Both approximations are shown in Fig. 6(b) by the dashed lines. The time at the intersection , at which the two limiting approximations cross each other, is given by
| (C4) |
At the intersection, the radius and expansion velocity are given by
| (C5) |
Appendix D Evaluation of cooling parameter for multi-component evaporation
In this paper, we are concerned with evaporation and condensation of forsterite (Mg2SiO4), in which Mg and SiO should be considered as vapor species (Nagahara et al., 1996). For dealing with nucleation of a multi-component system, we adopt the key species approximation that the rates of nucleation and grain growth are controlled by one chemical species (key species) that has the least collision frequency among the major vapor species that condense into the grain (Kozasa & Hasegawa, 1987). The conditions for the key-species approximation to hold were examined by Yamamoto et al. (2001) in formulating theory of nucleation involving chemical reactions.
In Eq. (17), the collision frequency of vapor molecules of mass and number density is given by , where is sticking probability, is mean molecular weight of the vapor molecules. Following Kozasa & Hasegawa (1987), we take SiO molecules as the key species of silicate condensation. This implies that and . Using Eqs. (16) and (12), we obtain
| (D1) |
where is mean molecular weight of the gas. The value of is estimated to be for K for forsterite; enstatite yields the similar value. The value of is given by . In consequence, is evaluated roughly to be:
| (D2) |
for .
References
- Alexander (1995) Alexander, C. M. O’D. 1995, Geochim. Cosmochim. Acta, 59, 3247
- Bradley et al. (1983) Bradley, J. P., Brownlee, D. E., & Veblen, D. R. 1983, Nature, 301, 473
- Ciesla et al. (2004) Ciesla, F. J., Hood, L. L., Weidenschilling, S. J. 2004, Meteorit. Planet. Sci., 39, 1809
- de Leeuw et al. (2000) de Leeuw, N. H., Parker, S. C., Catlow, C. R. A., & Price G. D. 2000, Phys. Chem. Minerals, 27, 332
- Draine & Salpeter (1977) Draine, B. T., & Salpeter, E. E. 1977, J. Chem. Phys., 67, 2230
- Grossman (1972) Grossman, L. 1972, Geochim. Cosmochim. Acta, 36, 597
- Hayashi et al. (1985) Hayashi, C. K., Nakazawa, K., & Nakagawa, Y. 1985, in Formation of the solar system, ed. D. C. Black & M. S. Matthews, M.S. (Univ. of Arizona Press, Tucson), 1100
- Hewins et al. (2005) Hewins, R. H., Connolly, Jr., H. C., Lofgren, G. E., & Libourel, G. 2005, in Chondrites and the Protoplanetary Disk, ed. A. N. Krot, E. R. D. Scott, & B. Reipurth (San Francisco: Astronomical Society of the Pacific), 286
- Hood (1998) Hood, L. L. 1998, Meteorit. Planet. Sci., 33, 97
- Hood et al. (2005) Hood, L. L., Ciesla, F. J., & Weidenschilling, S. J. 2005, in Chondrites and the Protoplanetary Disk, ed. A. N. Krot, E. R. D. Scott, & B. Reipurth (San Francisco: Astronomical Society of the Pacific), 873
- Hood et al. (2009) Hood, L. L., Ciesla, F. J., Artemieva, N. A., Marzari, F., & Weidenschilling, S. J. 2009, Meteorit. Planet. Sci., 44, 327
- Huss et al. (2005) Huss, G. R., Alexander, C. M. O’D., Palme, H., Bland, P. A., & Wasson, J. T. 2005, in Chondrites and Protoplanetary Disk, ed. A. N. Krot, E. R. D. Scott, & B. Reipurth (San Francisco: Astronomical Society of the Pacific), 701
- Iida et al. (2001) Iida, A., Nakamoto, T., Susa, H., & Nakagawa, Y. 2001, Icarus, 153, 430
- Kobatake et al. (2008) Kobatake, H., Tsukamoto, K., Nozawa, J., Nagashima, K., Satoh, H., & Dold, P. 2008, Icarus, 198, 208
- Kozasa & Hasegawa (1987) Kozasa, T., & Hasegawa, H. 1987, Prog. Theor. Phys., 77, 1402
- Miura et al. (2002) Miura, H., Nakamoto, T., & Susa, H. 2002, Icarus, 160, 258
- Miura & Nakamoto (2005) Miura, H., & Nakamoto, T. 2005, Icarus, 175, 289
- Miura & Nakamoto (2006) Miura, H., & Nakamoto, T. 2006, ApJ, 651, 1272
- Miyake & Nakagawa (1993) Miyake, K., & Nakagawa, Y. 1993, Icarus, 106, 20
- Mysen & Kushiro (1988) Mysen, B. O., & Kushiro, I. 1988, American Mineralogist, 73, 1
- Nagahara et al. (1996) Nagahara, H. & Ozawa, K. 1996, Geochim. Cosmochim. Acta., 60, 1445
- Nagasawa et al. (2005) Nagasawa, M., Lin, D. N. C., & Thommes, E. 2005, ApJ, 635, 578
- Nagashima et al. (2006) Nagashima, K., Tsukamoto, K., Satoh, H., Kobatake, H., & Dold, P. 2006, J. Crys. Growth, 293, 193
- Nozawa et al. (2009) Nozawa, J., Tsukamoto, K., Kobatake, H., Yamada, J., Satoh, H., Nagashima, K., Miura, H., & Kimura, Y. 2009, Icarus, 204, 681
- Susa et al. (1998) Susa, H., Uehara, H., Nishi, R., & Yamada, M. 1998, Prog. Theor. Phys., 100, 63
- Toriumi (1989) Toriumi, M. 1989, Earth Planet. Sci. Lett., 92, 265
- Tsuchiyama et al. (1988) Tsuchiyama, A., Kushiro, I., Mysen, B. O., & Morimoto, N. 1988, Proc. NIPR Symp. Antarct. Meteorites, 1, 185
- Tsuchiyama et al. (1998) Tsuchiyama, A., Takahashi, T., & Tachibana, S. 1998, Mineralogical Journal, 20, 113
- Tsukamoto et al. (1999) Tsukamoto, K., Satoh, H., Takamura, Y., & Kuribayashi, K. 1999, Antarct. Meteorites, 24, 179
- Wasson & Rubin (2003) Wasson, J. T. & Rubin, A. E. 2003, Geochim. Cosmochim. Acta, 67, 2239
- Weidenschilling et al. (1998) Weidenschilling, S. J., Marzari, F., & Hood, L. L. 1998, Science, 279, 681
- Yamada (2009) Yamada, J. 2009, Master’s Theses, Department of Earth and Planetary Science, Tohoku University
- Yamamoto & Hasegawa (1977) Yamamoto, T., & Hasegawa, H. 1977, Prog. Theor. Phys., 58, 816
- Yamamoto et al. (2001) Yamamoto, T., Chigai, T., Watanabe, S., & Kozasa, T. 2001, A&A, 380, 373
- Yurimoto & Wasson (2002) Yurimoto, H. & Wasson, J. T. 2002, Geochim. Cosmochim. Acta, 66, 4355