Radioactive Scandium in the Youngest Galactic Supernova Remnant G1.9+0.3
Abstract
We report the discovery of thermal X-ray emission from the youngest Galactic supernova remnant G1.9+0.3, from a 237-ks Chandra observation. We detect strong K lines of Si, S, Ar, Ca, and Fe. In addition, we detect a 4.1 keV line with 99.971% confidence which we attribute to 44Sc, produced by electron capture from 44Ti. Combining the data with our earlier Chandra observation allows us to detect the line in two regions independently. For a remnant age of 100 yr, our measured total line strength indicates synthesis of of 44Ti, in the range predicted for both Type Ia and core-collapse supernovae, but somewhat smaller than the reported for Cas A. The line spectrum indicates supersolar abundances. The Fe emission has a width of about 28,000 km s-1, consistent with an age of yr and with the inferred mean shock velocity of 14,000 km s-1 deduced assuming a distance of 8.5 kpc. Most thermal emission comes from regions of lower X-ray but higher radio surface brightness. Deeper observations should allow more detailed spatial mapping of 44Sc, with significant implications for models of nucleosynthesis in Type Ia supernovae.
Subject headings:
ISM: individual objects (G1.9+0.3) — ISM: supernova remnants — nuclear reactions, nucleosynthesis, abundances — X-rays: ISM1. Introduction
The supernova remnant (SNR) G1.9+0.3 has an age of order 100 years (Reynolds et al., 2008, Paper I; Green et al., 2008). Its integrated X-ray spectrum is well described by a model of synchrotron emission from a power-law distribution with an exponential cutoff (XSPEC model srcut), with rolloff frequency keV and a very high absorbing column density cm-2 (Reynolds et al., 2009, Paper II). The high column suggests a distance of order that to the Galactic Center; we adopt a nominal distance of 8.5 kpc, at which the mean expansion rate is km s-1 (Paper I). No thermal emission is apparent in the integrated spectrum based on short (50 ks in duration) Chandra observations in early 2007. Without the detection of thermal emission, basic, crucial information such as the supernova (SN) type, distance, and elemental abundances cannot be obtained. Its detection was one of the goals of a much longer Chandra observation.
2. Observations
We re-observed G1.9+0.3 for 237 ks with Chandra in four observations between July 13 and 26, 2009, using the ACIS-S CCD camera (S3 chip). We checked aspect correction and created new level–1 event files appropriate for VFAINT mode. No flares occurred during the observation. CTI correction was applied and calibration was performed using CALDB version 3.4.0. Finally, the datasets were merged and weighted response files created. We extracted spectra using the specextract script. We obtained about 40,000 source counts.
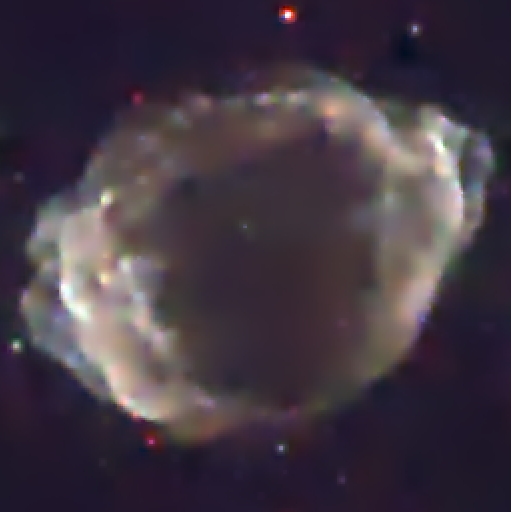
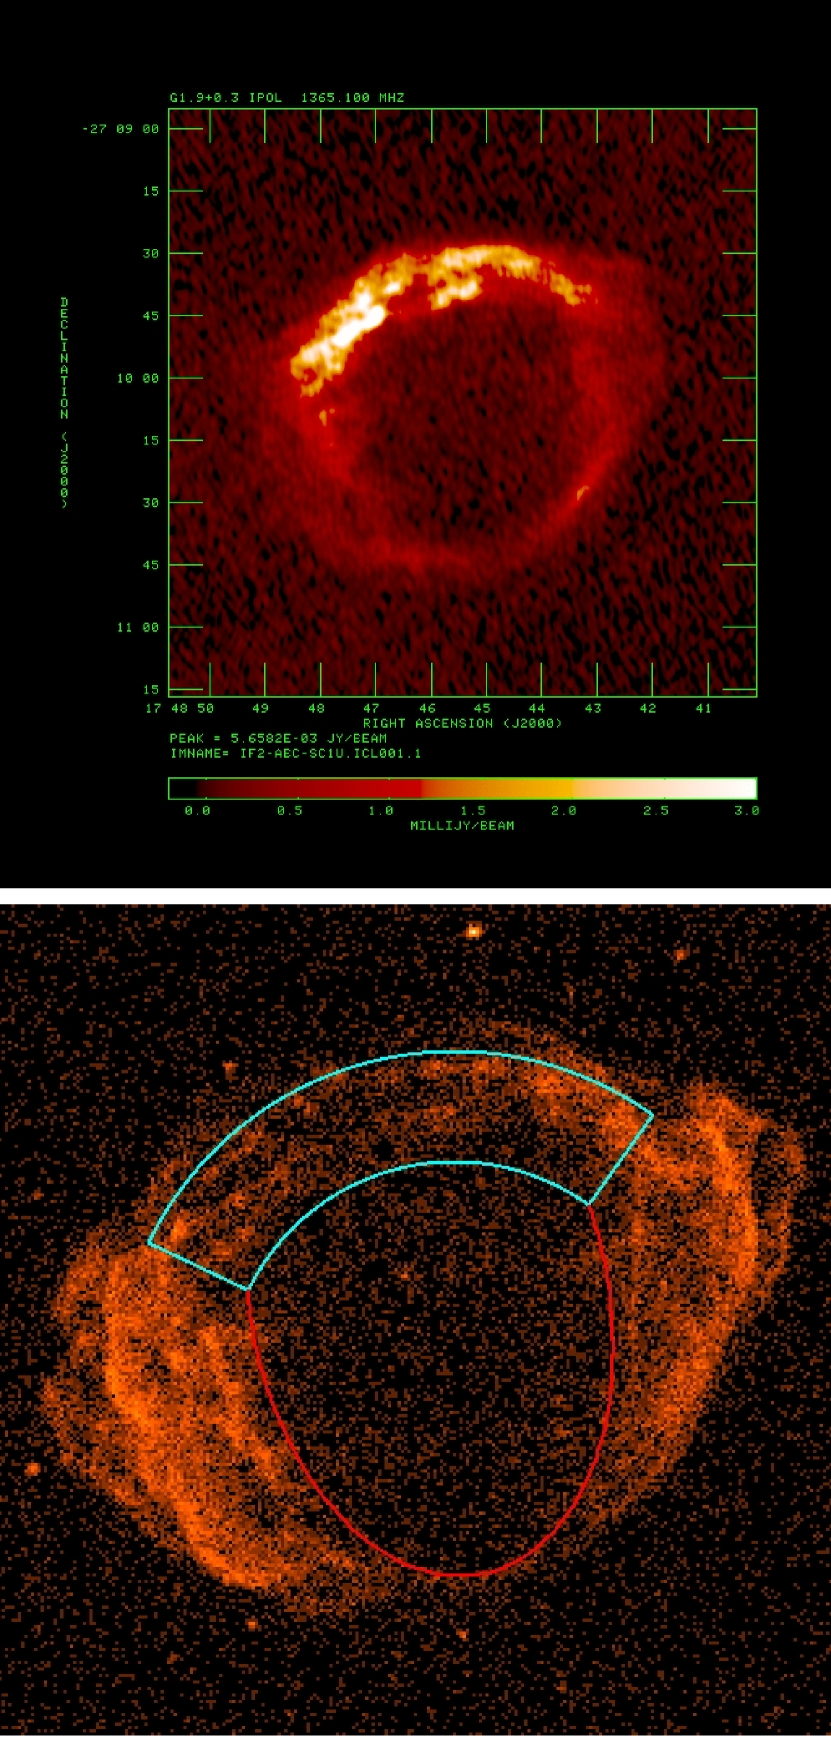
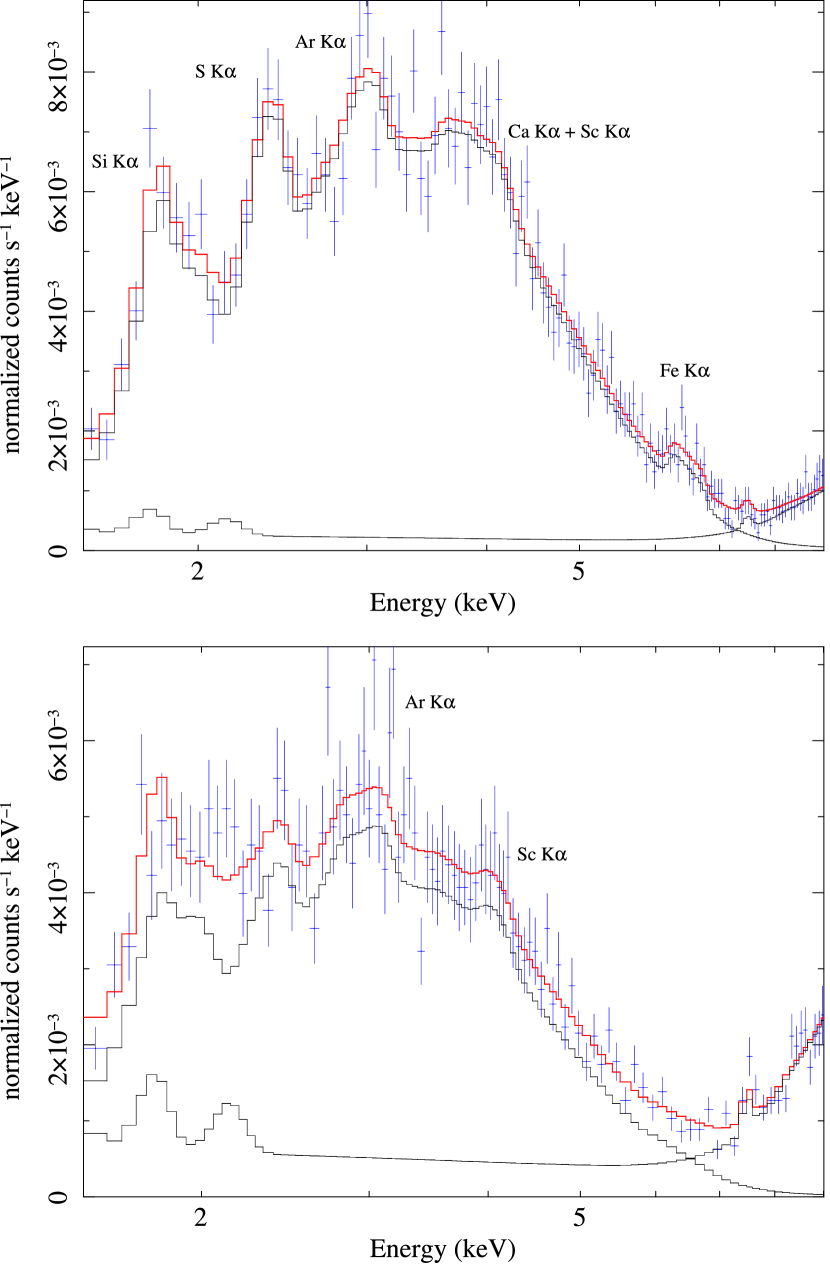
Figure 1 shows the 2009 image, smoothed with the spatio-spectral method of Krishnamurthy et al. (2010). Figure 2 compares the radio and X-ray morphologies. The marked and surprising difference between them, particularly strong radio but weak X-rays in the north, suggests that the radio image may hold a clue to the location of thermal emission. We extracted the spectrum from the radio-bright region shown on Figure 2; it is shown in Figure 3. Lines are apparent. We found lines as well in the central region shown in Figure 2, and analyzed the regions separately.
3. Spectral Analysis
We combined the 2007 and 2009 datasets for a total exposure of 286 ks. We modeled the background rather than subtracting it, and used Markov chain Monte Carlo (MCMC) methods as implemented in the PyMC software package (Patil et al., 2010) to determine best parameter values and error ranges (e.g., van Dyk et al., 2001). MCMC methods require the specification of priors on parameters to be determined (as described below).
The spectrum of the northern, radio-bright rim is shown in the upper panel of Figure 3. Spectral lines typical of strongly underionized plasma are apparent (such plasma is expected in G1.9+0.3 because of its youth and the low density of the ambient ISM). SN 1006 has a very similar X-ray spectrum; in the same spectral range of Figure 3, Yamaguchi et al. (2008) find prominent K lines of abundant elements such as Si, S, Ar, Ca, and Fe, with line centroids at 1.815 keV, 2.36 keV, 3.01 keV, 3.69 keV, and 6.43 keV. (As in SN 1006, O, Ne, and Mg lines might also be present at lower energies, but cannot be seen because of the high absorption.) In addition to these lines produced in hot shocked plasma, the radioactive decay of 44Ti to 44Sc and finally to the stable isotope 44Ca will result in the emission of X-ray and -ray lines in very young remnants (44Ti decays with a mean life of yr, Ahmad et al., 2006). This decay commences via an electron capture to 44Sc, leaving a K-shell vacancy followed rapidly either by Auger decay or by emission of a fluorescence photon of energy 4.09 keV (the yield is 0.172 photons per each 44Ti decay; Bé et al., 2004). Nuclear de-excitation Sc -ray lines at 78.4 and 67.9 keV are also emitted, followed by Ca gamma rays at 1.157 MeV (mean life of 44Sc is 5.4 hr). An inspection of the radio-bright rim spectrum (Figure 3) reveals the presence of Si, S, Ar, and Fe K lines, and a broad feature near 4 keV that may be a blend of Doppler-broadened Ca and Sc K lines. Lines are generally weaker in the low-surface brightness interior (lower panel of Figure 3), with Ar and Sc lines being the most prominent.
We modeled the spectra of the northern, radio-bright rim and the faint interior with an absorbed power law plus emission lines of Si, S, Ar, Ca, Sc, and Fe. This simple model does not account for dust scattering and does not separate the underlying continuum into thermal and nonthermal components, but it suffices for the determination of line strengths, centroids, and widths. We used a normal (Gaussian) prior for the absorbing column density , with mean (standard deviation) of cm-2, based on our multiregion spectral fit without dust scattering to the 2007 data (Paper II). (Solar abundances of the absorbing ISM are those of Grevesse & Sauval 1998; fits with dust scattering resulted in lower by 25%.) Noninformative, uniform and logarithmic priors were assumed for the power-law index and the (unabsorbed) 5–10 keV continuum flux , respectively.
We used normal priors for line energies, setting mean thermal line energies equal to the values measured by Yamaguchi et al. (2008) for SN 1006, and to 4.09 keV for the Sc line. In view of the 14,000 km s-1 blast wave speed, significant bulk Doppler shifts are possible, so we chose a large ( km s-1) width for these priors. (For numerical stability, these normal priors were truncated to include only a finite range in line energies; we verified that our results are not affected by this procedure.) Thermal lines in a young remnant arise in a fast-moving, shocked shell bounded by forward and reverse shocks. An optically and geometrically thin shell expanding with velocity produces flat-topped lines with Doppler widths of . We assumed flat-topped profiles with the same (but unknown) Doppler width for all thermal lines. (Thermal broadening is likely of only modest importance, , based on models of Dwarkadas & Chevalier (1998) with exponential ejecta density profiles. But it may still be appreciable in off-center locations such as the north rim, where bulk radial motions contribute less to the line broadening.) A truncated normal prior was assumed for , with mean of 14,000 km s-1 and 1 width of 5000 km s-1, extending from 0 to 50,000 km s-1. The Sc line was modeled by a Gaussian with width ; we assumed a half-normal111normal distribution with mean 0 limited to positive domain prior with keV for . These priors for line widths exclude very large ( 50,000 km s-1) widths, but otherwise provide weak constraints.
Some constraints on the Sc line strength are provided by IBIS/ISGRI onboard INTEGRAL. The 68 and 78 keV lines have been detected by IBIS/ISGRI in Cas A (Renaud et al., 2006) but not in G1.9+0.3 (Renaud et al., 2009). We use the Cas A detection to bound priors. We chose a weakly informative gamma prior for the Sc line strength, defined as the expected line counts in a 286 ks exposure with Chandra, with shape parameter and scale parameter (see van Dyk et al. (2001) for discussion of the use of gamma priors in modeling emission lines in X-ray spectra). Its mean of counts is comparable to the square root of the variance, equal to counts. This prior disfavors a strong Sc line that was searched for but not found in Cas A (Theiling & Leising, 2006), but otherwise provides rather weak constraints. We assumed the same weakly informative prior on line strength for thermal lines of Si, S, Ar, Ca, and Fe.
The sky background was determined by a fit to the background spectrum extracted from a large area on the S3 chip. The sky background was modeled by two absorbed power-laws, while the particle background model involved a combination of power-laws with exponential cutoffs and narrow fluorescent lines. We allowed for spatial variations in the particle background, with a logarithmic prior imposed on the particle normalization.
Table 1 contains results of spectral fits; models are plotted in Figure 3. Except for fluxes, values quoted in Table 1 are standard means of the MCMC draws. We used a geometric mean for , and mean line fluxes were evaluated as (according to recommendations by van Dyk et al., 2001). The 90% confidence intervals were computed using the 0.05 and 0.95 quantiles of the draws. The Sc line width is poorly constrained, so we provide only upper limits based on the 90% highest probability density interval for .
The Sc line and thermal lines of all abundant elements have appreciable strengths in the spectrum of the northern rim. Thermal lines are very broad, with a full width of 28,000 km s-1, consistent with the estimated shock velocity of 14,000 km s-1. The Fe K line provides the strongest constraints on line widths, but Doppler broadening is important for other lines as well. Photon statistics are insufficient to study variations in Doppler widths between different elements. This includes Sc, with a width that does not seem to be different from thermal line widths. But Sc forms a line blend with Ca, so errors are particularly large for these elements. In the interior, thermal lines are much weaker; an inspection of the confidence intervals in Table 1 suggests that only Ar may have been unambiguously detected. Notwithstanding this decline in the overall strength of thermal lines, the Sc line remains strong (it is only a factor of 2 weaker than in the northern rim). The prominence of Sc in the interior is consistent with an origin in the unshocked ejecta.
In both spectral regions independently, we examined the significance of the Sc line detection using a likelihood ratio test as described in Protassov et al. (2002). The null model consisted of an absorbed power law plus Si, S, Ar, Ca and Fe lines described by flat line profiles with equal (but unknown) Doppler widths, together with the same priors that we used for our spectral fits. The alternative model is obtained by adding an additional line at 4.09 keV to the null model. Large samples from the posterior distribution of the null model were obtained using MCMC simulations. From these samples we simulated synthetic datasets, fit each dataset with the null model and the alternative model, and computed the likelihood ratio statistic. The posterior predictive -values for the null model are 0.0098 and 0.030 for the northern rim and interior, respectively. The -value is equal to 0.00029 for the null model to be valid in both of these regions. We can therefore reject the null model, i.e., claim the detection of the 4.1 keV line, at 99.971% significance.
The total Sc line flux was derived by combining the spectra shown in Figure 3, and fitting the combined dataset separately with the same spectral model as before. We obtain a total Sc line flux of ph cm-2 s-1, with a 95% confidence interval of ph cm-2 s-1. The column density of cm-2 implies that X-rays of 4.1 keV are attenuated by about 33% due both to absorption and scattering. The Sc line fluxes have not been corrected for this, but the correction has been made for the 44Ti masses that are discussed next.
We expect 0.172 fluorescence photons per 44Sc atom. Thus the line flux, along with the source age and distance, gives directly the amount of 44Ti synthesized in the explosion. Including the branching ratio for the emission of the 1.157 MeV photon, we expect the flux of X-ray photons to be related to that in 1.157 MeV photons by . The gamma-ray flux is related to the mass of 44Ti by
with the mean life yr. (If the 44Ti is ionized beyond the He-like state, the effective lifetime is longer (Mochizuki et al., 1999), but the low ionization age of Fe implied by the line centroid reported in Table 1 means that this effect should be negligible.) We used these relations with an age of 100 yr to obtain the following 44Ti masses: in the north, in the interior, and for the total. (Errors are 90% confidence limits for the two subregions, but 95% limits for the total.) These masses have been corrected for absorption and scattering by being multiplied by a factor of . For an age of 140 yr (corresponding to no deceleration at all), the masses would be larger by an additional factor of 1.54.
We also modeled the spectrum of the northern, radio-bright rim with a plane shock non-equilibrium ionization (NEI) model (vpshock in XSPEC). We find cm-2; keV; and ionization timescale cm-3 s. This extremely low ionization age is very unusual for SNRs, but appropriate for an unprecedentedly young object. Abundances have substantial errors, but solar abundances are ruled out: compared to solar, Si (set equal to S) = 3.4 (2.0, 4.6), Ar = 17 (2.8, 37), and Fe = 4.1(2.4, 5.7). A blueshift of line centers is required, km s-1. We find a FWHM of km s-1. With cm-3, the estimated shocked ejecta mass is only , with comparable masses of intermediate-mass (Si, S, and Ar) elements and Fe. This is a quarter of the total shocked ambient gas mass of (for a preshock density of cm-3 and a blast wave radius of 2.2 pc; Paper I). Impact of the ejecta with a denser than average ambient medium in the north may explain the relatively high shocked ejecta mass and density, and the strong radio emission there.
4. Discussion
We summarize our results as follows:
-
1.
The radio-bright N rim region shows strong K lines of Si, S, Ar, Ca, and Fe (much weaker thermal emission is also present in the shell interior).
-
2.
The spectral lines are both broadened and shifted. Widths of thermal lines are km s-1 with blueshifts of about 4,000 km s-1.
-
3.
Global spectral fits with a plane-shock model imply strong overabundances of the elements we detect, consistent with their interpretation as ejecta dominated by intermediate-mass elements and Fe.
-
4.
We detect for the first time with high significance a line at 4.1 keV which we attribute to 44Sc. The line strength of about ph cm-2 s-1 implies a mass of 44Ti of , after correction for absorption and assuming an age of 100 yr and a distance of 8.5 kpc.
-
5.
We detect 44Sc separately in the northern shell and the interior, with greater strength in the shell.
We believe the discovery of 44Sc emission to be the most important new result. A feature at 4.1 keV identified with 44Sc has been reported previously in G266.2–1.2 (RX J0852.0-4622) by Tsunemi et al. (2000), Iyudin et al. (2005), and Bamba et al. (2005). However, Slane et al. (2001) and, more comprehensively, Hiraga et al. (2009) have failed to confirm these reports, at a level below the previous detection claims. It appears that G1.9+0.3 shows the first definite detection of this transition. Our line strength implies a flux in the 1.157 MeV line of about ph cm-2 s-1, well below the COMPTEL limit of about ph cm-2 s-1 (Dupraz et al., 1997). While our inferred 44Ti mass is nominally in conflict with the upper limit of reported by Renaud et al. (2009), the errors are large enough to accommodate it.
44Ti, a trace product of explosive nucleosynthesis, carries important information about the details of the explosion (Diehl & Timmes, 1998; The et al., 2006). It is primarily produced in “-rich freezeout” conditions, in which rapid cooling causes departures from nuclear statistical equilibrium and a high concentration of free particles. In core-collapse (CC) SNe, its production is sensitive to the location of the mass cut (within which material becomes the neutron star), and in most models its production is correlated with that of 56Ni, and therefore with the supernova luminosity. Predicted yields range from 3 to (see summary in The et al., 2006). Traditional SN Ia models undergo -rich freezeout under somewhat different conditions and do not produce large quantities of 44Ti. However, recent simulations of off-center delayed-detonation explosions have shown substantially increased yields: Maeda et al. (2010) quote a mass of 44Ti of , compared to for a centrally-ignited pure deflagration and for a central delayed detonation. (For comparison, the benchmark W7 Type Ia model [Nomoto et al. 1984] gives , while a series of more recent simulations by Iwamoto et al. (1999) gives a range from .)
Galactic constraints on the supernova rate can be obtained from the observed abundance of 44Ca, and the absence of obvious discrete sources of 1.157 MeV -ray emission, with the important exception of Cas A, the only firm detection to date (Iyudin et al., 1994, 1999). The accompanying hard X-ray lines have also been seen from Cas A (Vink et al., 2001; Renaud et al., 2006), with an inferred mass of 44Ti of about , more than expected from most CC models (; Timmes et al., 1996), though asymmetric models can do better (e.g., Nagataki et al., 1998).
Since the 4.1 keV inner-shell transition of 44Sc formed from electron capture in 44Ti does not require that the scandium be ionized, we are sensitive to both shocked and unshocked material. This is evident in the interior spectrum in Figure 3, in which the 44Sc line is as prominent as in the north rim, but the other lines are weaker. The greater abundance of 44Sc in the north, then, represents a true spatial distribution – surprising, considering that the 44Sc is expected to be produced in the neighborhood of the Fe-peak elements, that is, the innermost ejecta. These properties suggest that the explosion was substantially asymmetric, perhaps consistent with the greater production of 44Ti found in asymmetric explosion models such as Maeda et al. (2010). While He-shell denotations that trigger sub-Chandrasekhar thermonuclear explosions can also be invoked to explain the presence of asymmetrically-distributed 44Ti and Fe in the outermost ejecta layers, too much 44Ti is produced even in sub-Chandrasekhar explosion models with minimum He shell masses (Fink et al., 2010). A substantially longer observation should allow better spatial localization of the 44Sc emission, and an unprecedented view into supernova nucleosynthesis.
Our discovery of these spectral lines, and the 44Sc line in particular, remains consistent with the possibility that G1.9+0.3 resulted from a Type Ia event, a possibility we find increasingly likely. The bilaterally symmetric synchrotron–X-ray morphology, the extremely high shock velocities we both infer and measure from line broadening, and the prominent Fe K emission, all support a Type Ia origin. We have not yet ruled out a CC origin, however; while strong iron emission is unusual in CC remnants, Cas A is a counterexample, and it is possible that a CC origin can explain the other features as well. What is certainly clear is that G1.9+0.3 still has a great deal to teach us about the evolution of very young SNRs and about the supernovae that produced them.
References
- Ahmad et al. (2006) Ahmad, I., et al. 2006, Phys. Rev. C, 74, 065803
- Bamba et al. (2005) Bamba, A., Yamazaki, R., & Hiraga, J. S. 2005, ApJ, 632, 294
- Bé et al. (2004) Bé, M.-M., et al. 2004, Table of Radionuclides, Vol. 1, Monographie Bureau International des Poids et Mesures (BIMP-5), 51
- Diehl & Timmes (1998) Diehl, R., & Timmes, F. X. 1998, PASP, 110, 637
- Dupraz et al. (1997) Dupraz, C., et al. 1997, A&A, 324, 683
- Dwarkadas & Chevalier (1998) Dwarkadas, V. V., & Chevalier, R. A. 1998, ApJ, 497, 807
- Fink et al. (2010) Fink, M., et al. 2010, A&A, 514, A53
- Green et al. (2008) Green, D. A., et al. 2008, MNRAS, 387, L54
- Grevesse & Sauval (1998) Grevesse, N., & Sauval, A. J. 1998, Space Science Reviews, 85, 161
- Hiraga et al. (2009) Hiraga, J. S., et al. 2009, PASJ, 61, 275
- Iwamoto et al. (1999) Iwamoto, K., et al. 1999, ApJS, 125, 439
- Iyudin et al. (1994) Iyudin, A. F., et al. 1994, A&A, 284, L1
- Iyudin et al. (1999) Iyudin, A. F., et al. 1999, Astrophys. Lett. Comm., 38, 383
- Iyudin et al. (2005) Iyudin, A. F., et al. 2005, A&A, 429, 225
- Krishnamurthy et al. (2010) Krishnamurthy, K., Raginsky, M., & Willett, R. 2010, SIAM J. Imaging Sci., 3, 619
- Maeda et al. (2010) Maeda, K., et al. 2010, ApJ, 712, 624
- Mochizuki et al. (1999) Mochizuki, Y., et al. 1999, A&A, 346, 831
- Nagataki et al. (1998) Nagataki, S., et al. 1998, ApJ, 492, L45
- Nomoto, Thielemann, & Yokoi (1984) Nomoto, K., Thielemann, F.-K., & Yokoi, K. 1984, ApJ, 286, 644
- Patil et al. (2010) Patil, A., et al. 2010, J. of Statistical Software, 35, Issue 4
- Protassov et al. (2002) Protassov, R., et al. 2002, ApJ, 571, 545
- Renaud et al. (2006) Renaud, M., et al. 2006, ApJ, 647, L41
- Renaud et al. (2009) Renaud, M., et al. 2009, in Proceedings of the 2nd International Simbol-X Symposium, Simbol-X: Focusing on the Hard X-ray Universe. AIP Conf. Proc., 1126, 359
- Reynolds et al. (2008, Paper I) Reynolds, S. P., et al. 2008, ApJ, 680, L41 (Paper I)
- Reynolds et al. (2009) Reynolds, S. P., et al. 2009, ApJ, 695, L149 (Paper II)
- Slane et al. (2001) Slane, P. O., et al. 2001, ApJ, 548, 814
- The et al. (2006) The, L.-S., et al. 2006, A&A, 450, 1037
- Theiling & Leising (2006) Theiling, M. F., & Leising, M., D. 2006, New Astronomy Reviews, 50, 544
- Timmes et al. (1996) Timmes, F. X., et al. 1996, ApJ, 464, 332
- Tsunemi et al. (2000) Tsunemi, H., et al. 2000, PASJ, 52, 887
- van Dyk et al. (2001) van Dyk, D. A., et al. 2001, ApJ, 548, 224
- Vink et al. (2001) Vink, J., et al. 2001, ApJ, 560, L79
- Yamaguchi et al. (2008) Yamaguchi, H., et al. 2008, PASJ, 60, 141
| Region | Line energies (keV) and line strengths ( ph cm-2 s-1) | ||||||||||
|---|---|---|---|---|---|---|---|---|---|---|---|
| ( cm-2) | ( ergs cm-2 s-1) | ( km s-1) | Silicon | Sulfur | Argon | Calcium | Scandium | Iron | |||
| North rim | 6.88 | 2.40 | 3.00 | 1.4 | 1.1 | 1.83 | 2.35 | 2.99 | 3.72 | 4.08 | 6.49 |
| (6.72, 7.05) | (2.29, 2.51) | (2.80, 3.22) | (0.9, 1.9) | (1.78, 1.88) | (2.31, 2.40) | (2.92, 3.04) | (3.59, 3.87) | (4.00, 4.15) | (6.38, 6.61) | ||
| 4.4 | 10.4 | 7.7 | 5.2 | 10 | 18 | ||||||
| (2.1, 7.0) | (5.9, 15.6) | (3.1, 13) | (1.2, 11) | (4.0, 19) | (11, 27) | ||||||
| Interior | 6.89 | 2.71 | 1.35 | 2.1 | 0.9 | 1.83 | 2.32 | 2.96 | 3.74 | 4.09 | 6.4 |
| (6.72, 7.06) | (2.54, 2.86) | (1.22, 1.51) | (1.2, 3.0) | (1.72, 1.95) | (2.17, 2.46) | (2.87, 3.05) | (3.52, 3.94) | (4.02, 4.17) | (6.0, 6.8) | ||
| 1.2 | 3.1 | 5.9 | 1.9 | 4.6 | 3.0 | ||||||
| (0.1, 4.0) | (0.4, 8.3) | (1.5, 13) | (0.2, 6.0) | (1.3, 9.5) | (0.4, 8.4) | ||||||
Note. — Line energies (strengths) are in rows 1 and 5 (3 and 7), with 90% confidence limits listed in adjacent rows.