Discovery of ultra-fast outflows in a sample of Broad Line Radio Galaxies observed with Suzaku
Abstract
We present the results of a uniform and systematic search for blue-shifted Fe K absorption lines in the X-ray spectra of five bright Broad-Line Radio Galaxies (BLRGs) observed with Suzaku. We detect, for the first time at X-rays in radio-loud AGN, several absorption lines at energies greater than 7 keV in three out of five sources, namely 3C 111, 3C 120 and 3C 390.3. The lines are detected with high significance according to both the F-test and extensive Monte Carlo simulations. Their likely interpretation as blue-shifted Fe XXV and Fe XXVI K-shell resonance lines implies an origin from highly ionized gas outflowing with mildly relativistic velocities, in the range 0.04–0.15c. A fit with specific photo-ionization models gives ionization parameters in the range log4–5.6 erg s-1 cm and column densities of – cm-2. These characteristics are very similar to those of the Ultra-Fast Outflows (UFOs) previously observed in radio-quiet AGN. Their estimated location within 0.01–0.3pc from the central super-massive black hole suggests a likely origin related with accretion disk winds/outflows. Depending on the absorber covering fraction, the mass outflow rate of these UFOs can be comparable to the accretion rate and their kinetic power can correspond to a significant fraction of the bolometric luminosity and is comparable to their typical jet power. Therefore, these UFOs can play a significant role in the expected feedback from the AGN on the surrounding environment and can give us further clues on the relation between the accretion disk and the formation of winds/jets in both radio-quiet and radio-loud AGN.
1 Introduction
Absorption from layers of photo-ionized gas in the circumnuclear regions of AGN is commonly observed in more than half of radio-quiet objects, the so-called warm absorbers (e.g., Blustin et al. 2005; McKernan et al. 2007). These absorbers are usually detected in the X-ray spectra at energies below 2–3 keV. The typical characteristics of this material are an ionization parameter of log0–2 erg s-1 cm, a column density of – cm-2 and an outflow velocity of 100–1000 km/s. It has been suggested that the origin of this gas might be connected with the Optical-UV Broad Line Region or with torus winds (e.g., Blustin et al. 2005; McKernan et al. 2007).
In addition, there have been several papers in the literature recently reporting the detection of blue-shifted Fe K absorption lines at rest-frame energies of 7–10 keV in the X-ray spectra of radio-quiet AGN (e.g., Chartas et al. 2002; Chartas et al. 2003; Pounds et al. 2003; Dadina et al. 2005; Markowitz et al. 2006; Braito et al. 2007; Cappi et al. 2009; Reeves et al. 2009a). These lines are commonly interpreted as due to resonant absorption from Fe XXV and/or Fe XXVI associated with a zone of circumnuclear gas photo-ionized by the central X-ray source, with ionization parameter log3–5 erg s-1 cm and column density – cm-2. The energies of these absorption lines are systematically blue-shifted and the corresponding velocities can reach up to mildly relativistic values of 0.2–0.4c. In particular, a uniform and systematic search for blue-shifted Fe K absorption lines in a large sample of radio-quiet AGN observed with XMM-Newton has been performed by Tombesi et al. (2010). This allowed the authors to assess their global detection significance and to overcome any possible publication bias (e.g., Vaughan & Uttley 2008). The lines were detected in 40% of the objects, and are systematically blue-shifted implying large outflow velocities, even larger than 0.1c in 25% of the sources. These findings, corroborated by the observation of short time-scale variability (100 ks), indicate that the absorbing material is outflowing from the nuclear regions of AGN, at distances of the order of 100 (Schwarzschild radii, ) from the central super-massive black hole (e.g., Cappi et al. 2009 and references therein). Therefore, these findings suggest the presence of previously unknown Ultra-fast Outflows (UFOs) from the central regions of radio-quiet AGN, possibly connected with accretion disk winds/ejecta (e.g., King & Pounds 2003; Proga & Kallman 2004; Ohsuga et al. 2009; King 2010) or the base of a possible weak jet (see the “aborted jet” model by Ghisellini et al. 2004). The mass outflow rate of these UFOs can be comparable to the accretion rate and their kinetic energy can correspond to a significant fraction of the bolometric luminosity (e.g., Pounds et al. 2003; Dadina et al. 2005; Markowitz et al. 2006; Braito et al. 2007; Cappi et al. 2009; Reeves et al. 2009a). Therefore, they have the possibility to bring outward a significant amount of mass and energy, which can have an important influence on the surrounding environment (e.g., see review by Cappi 2006). In fact, feedback from the AGN is expected to have a significant role in the evolution of the host galaxy, such as the enrichment of the ISM or the reduction of star formation, and could also explain some fundamental relations (e.g., see review by Elvis 2006 and Fabian 2009). Moreover, the ejection of a substantial amount of mass from the central regions of AGN can also inhibit the growth of the super-massive black holes (SMBHs), potentially affecting their evolution. The study of UFOs can also give us further clues on the relation between the accretion disk and the formation of winds/jets.
Evidence for winds/outflows in radio-loud AGN in the X-rays has been missing so far. However, thanks to the superior sensitivity and energy resolution of current X-ray detectors, we are now beginning to find evidence for outflowing gas in radio-loud AGN as well. In fact, the recent detection of a warm absorber in the Broad-Line Radio Galaxy (BLRG) 3C 382 (Torresi et al. 2010; Reeves et al. 2009b) has been the starting point for a change to the classical picture of the radio-quiet vs. radio-loud dichotomy, at least in the X-ray domain. This gas has an ionization parameter of log2–3 erg s-1 cm, a column density of – cm-2 and is outflowing with a velocity of 800–1000 km/s. These parameters are somewhat similar to those of the typical warm absorbers of Seyfert 1 galaxies (e.g., Blustin et al. 2005; McKernan et al. 2007), which are the radio-quiet counterparts of BLRGs. This result indicates the presence of ionized outflowing gas in a radio-loud AGN at a distance of 100 pc from the central engine, suggesting its possible association with the Optical-UV Narrow Line Region (Torresi et al. 2010; Reeves et al. 2009b).
In this paper, we present the detection, for the first time, of ionized ultra-fast outflows in BLRGs on sub-pc scales from Suzaku observations. The sources in the sample – 3C 111, 3C 390.3, 3C 120, 3C 382, and 3C 445 – were observed with Suzaku by us as part of our ongoing systematic study of the X-ray properties of BLRGs (Sambruna et al. 2009), with the exception of 3C 120 which was observed during the Guaranteed Time Observer period (Kataoka et al. 2007). These five BLRGs represent the “classical” X-ray brightest radio-loud AGN, well studied at X-rays with previous observatories. Thanks to the high sensitivity of the XIS detectors and the long net exposures of these observations of 100 ks, we have been able to reach a high S/N in the Fe K band that allowed, for the first time, to obtain evidence for UFOs in these sources, in the form of blue-shifted Fe K absorption lines at energies greater than 7 keV. The presence of UFOs in radio-loud AGN provides a confirmation of models for jet-disk coupling and stresses the importance of this class of sources for AGN feedback mechanisms. Full accounts of the broad-band Suzaku spectra for each source will be given in forthcoming papers.
This paper is structured as follows. In § 2 and § 3 we describe the Suzaku data reduction and analysis, including statistical tests used to assess the reality of the Fe K absorption features (§ 3.3) and detailed photo-ionization models used for the fits (§ 3.4). The general results are given in § 4, while § 5 presents the Discussion with the Conclusions following in § 6. Appendix A contains the details of the spectral fits for each BLRG and Appendix B a consistency check of the results. Throughout this paper, a concordance cosmology with H km s-1 Mpc-1, =0.73, and =0.27 (Spergel et al. 2003) is adopted. The power-law spectral index, , is defined such that . The photon index is .
2 Suzaku observations and data reduction
The observational details for the five BLRGs observed with Suzaku (Mitsuda et al. 2007) are summarized in Table 1. The data were taken from the X-ray Imaging Spectrometer (XIS, Koyama et al. 2007) and processed using v2 of the Suzaku pipeline. The observations were taken with the XIS nominal (on-axis) pointing position, with the exception of the 3C 111 observation, which was taken with HXD nominal pointing. The Suzaku observation of 3C 120 is composed by four different exposures of 40 ks each, taken over a period of about one month (see Table 1). We looked at the individual spectra and found that while observation 2, 3 and 4 did not change significantly overall, observation 1 instead showed a stronger X-ray emission, especially in the soft X-ray part of the spectrum, in agreement with Kataoka et al. (2007). Therefore, we decided to add only observations 2, 3 and 4 (we will call this observation 3C 120b) and to analyze the spectrum of observation 1 separately (we will call this observation 3C 120a).
Data were excluded within 436 seconds of passage through the South Atlantic Anomaly (SAA) and within Earth elevation angles or Bright Earth angles of and , respectively. XIS data were selected in and edit-modes using grades 0, 2, 3, 4, 6, while hot and flickering pixels were removed using the sisclean script. Spectra were extracted from within circular regions of between 2.5′–3.0′ radius, while background spectra were extracted from circles offset from the source and avoiding the chip corners containing the calibration sources. The response matrix (rmf) and ancillary response (arf) files were created using the tasks xisrmfgen and xissimarfgen, respectively, the former accounting for the CCD charge injection and the latter for the hydrocarbon contamination on the optical blocking filter.
Spectra from the front illuminated XIS 0, XIS 2 (where available) and XIS 3 chips were combined to create a single source spectrum (hereafter XIS-FI). Given its superior sensitivity in the region of interest, 3.5–10.5 keV, we restricted our analysis to the XIS-FI data. The data from the back illuminated XIS 1 (hereafter XIS-BI) chip were analysed separately and checked for consistency with the XIS-FI results. In all cases, the power-law continuum and Fe K emission line parameters are completely consistent. Instead, the lower S/N of the XIS-BI in the 4–10 keV band (40% of the XIS-FI) allowed us to place only lower limits to the equivalent width of the blue-shifted absorption lines (see Appendix B and Table 5).
Furthermore, Appendix B gives more details on the various consistency checks we have performed in order to verify the reality of the absorption lines detected in the 7–10 keV band. In particular, we determined that the XIS background has a negligible effect on the detection of each of the individual absorption lines and we checked the consistency of the results among the individual XIS cameras (see Table 5). We also tested that the alternative modeling of the lines with ionized Ni K-shell transitions and ionized Fe K edges is not feasible. Finally, in §4.2 we verified the fit results from the broad-band (E0.5–50 keV) XISPIN spectra.
3 Spectral fits
We performed a uniform spectral analysis of the small sample of five BLRGs in the Fe K band (E3.5–10.5 keV). We used the heasoft v. 6.5.1 package and XSPEC v. 11.3.2. We extracted the source spectra for all the observations, subtracted the corresponding background and grouped the data to a minimum of 25 counts per energy bin to enable the use of the when performing spectral fitting. Fits were limited to the 3.5–10.5 keV energy band.
3.1 The baseline model
As plausible phenomenological representation of the continuum in 3.5–10.5 keV, we adopt a single power-law model. We did not find it necessary to include neutral absorption from our own Galaxy as the relatively low column densities involved (Dickey & Lockman 1990; Kalberla et al. 2005) have negligible effects in the considered energy band, see Table 1. The only exception is 3C 445, where the continuum is intrinsically absorbed by a column density of neutral/mildly-ionized gas as high as cm-2 (Sambruna, Reeves & Braito 2007); for this source we included also a neutral intrinsic absorption component with a column density of cm-2 (see Table 2). A more detailed discussion of absorption in this source using Chandra and Suzaku data is presented in Reeves et al. (2010, in prep.) and Braito et al. (2010, in prep.).
The ratios of the spectral data against the simple (absorbed for 3C 445) power-law continuum for the five BLRGs are shown in the upper panels of Fig. 1, Fig. 3 and Fig. 5. Some additional spectral complexity can be clearly seen, such as an ubiquitous, prominent neutral Fe K emission line at the rest frame energy of 6.4 keV, absorption structures at energies greater than 7 keV (3C 111, 3C 120, and 3C 390.3) and narrow emission features red-ward (3C 445) and blue-ward (3C 120 and 3C 382) to the neutral Fe K line. To model the emission lines we added Gaussian components to the power law model, including the Fe K emission line at E6.4 keV and ionized Fe K emission lines in the energy range E6.4–7 keV, depending on the ionization state of iron, which in this energy interval is expected to range from Fe II up to Fe XXVI.
We find that the baseline model composed by a power-law plus Gaussian Fe K emission lines provides an excellent phenomenological characterization of the 3.5–10.5 keV XIS data with the lowest number of free parameters. The results of the fits for the five BLRGs are reported in Table 2. Note that only those emission lines with detection confidence levels greater than 99% were retained in following fits. The weak red-shifted emission line present in 3C 445 was not included because this has negligible effect on the fit results; this line will be discussed by Braito et al. (2010 in prep.).
3.2 Fe K absorption lines search
As apparent from Figure 1, 3, and 5, several absorption dips are present in the residuals of the baseline model in various cases. To quantify their significance, we computed the deviations with respect to the baseline model (§ 3.1) over the whole 3.5–10.5 keV interval. The method is similar to the one used by the steppar command in XSPEC to visualize the error contours, but in this case the inner contours indicate higher significance than the outer ones (e.g., Miniutti & Fabian 2006; Miniutti et al. 2007; Cappi et al. 2009; Tombesi et al. 2010).
The analysis has been carried out for each source spectrum as follows: 1) we first fitted the 3.5–10.5 keV data with the baseline model and stored the resulting ; 2) a further narrow, unresolved (10 eV) Gaussian test line was then added to the model, with its normalization free to have positive or negative values. Its energy was stepped in the 4–10 keV band at intervals of 100 eV in order to properly sample the XIS energy resolution, each time making a fit and storing the resulting value. In this way we derived a grid of values and then plot the contours with the same with respect to the baseline model.
The contour plots for the different sources are reported in the lower panel of Figures 1, 3 and 5. The contours refer to levels of , and , which correspond to F-test confidence levels of 68% (red), 90% (green) and 99% (blue), respectively. The position of the neutral Fe K emission line at rest-frame energy E6.4 keV is marked by the dotted vertical line. The arrows indicate the position of the blue-shifted absorption lines detected at 99%. The black contours indicate the baseline model reference level ().
We then proceeded to directly fit the spectra, adding Gaussian absorption lines where indications for line-like absorption features with confidence levels greater than 99% were present. As already noted in §3.1, we checked that neglecting to include the weak red-shifted emission line apparent only in the spectrum of 3C 445 has no effect in the fit results. The detailed fitting and modeling of the Fe K absorption lines is reported in Table 3 and is discussed in the Appendix A for each source.
3.3 Line significance from Monte Carlo simulations
The contour plots in the lower panels of Fig. 1, Fig. 3 and Fig. 5 visualize the presence of spectral structures in the data and simultaneously give an idea of their energy, intensity and confidence levels using the standard F-test. However, they give only a semi-quantitative indication and the detection of each line must be confirmed by directly fitting the spectra. Moreover, it has been demonstrated that the F-test method can slightly overestimate the actual detection significance for a blind search of emission/absorption lines as it does not take into account the possible range of energies where a line might be expected to occur, nor does it take into account the number of bins (resolution elements) present over that energy range (e.g., Protassov et al. 2002). This problem requires an additional test on the red/blue-shifted lines significance and can be solved by determining the unknown underlying statistical distribution by performing extensive Monte Carlo (MC) simulations (e.g., Porquet et al. 2004; Yaqoob & Serlemitsos 2005; Miniutti & Fabian 2006; Markowitz et al. 2006; Cappi et al. 2009; Tombesi et al. 2010).
Therefore, we performed detailed MC simulations to estimate the actual significance of the absorption lines detected at energies greater than 7 keV. We essentially tested the null hypothesis that the spectra were adequately fitted by a model that did not include the absorption lines. The simulations have been carried out as follows: 1) we simulated a source spectrum using the fakeit command in XSPEC and assuming the baseline model listed in Table 2 without any absorption lines and with the same exposure as the real data. We subtracted the appropriate background and grouped the data to a minimum of 25 counts per energy bin; 2) we fitted the faked spectrum with the baseline model in the 3.5–10.5 keV band, stored the new parameters values and generated another simulated spectrum as in step 2 but using the refined model. This procedure accounts for the uncertainty in the null hypothesis model itself and is particularly relevant when the original data set is noisy; 3) the newly simulated spectrum was fitted again with the baseline model in the 3.5–10.5 keV and the resultant was stored; 4) then, a further Gaussian line (unresolved, 10 eV) was added to the model, with its normalization initially set to zero and let free to vary between positive and negative values. To account for the range of energies in which the line could be detected in a blind search, we stepped its centroid energy between 7 keV and 10 keV at intervals of 100 eV to sample the XIS energy resolution, fitting each time and storing only the maximum of the resultant values. The procedure was repeated times and consequently a distribution of simulated values was generated. The latter indicates the fraction of random generated emission/absorption features in the 7–10 keV band that are expected to have a greater than a threshold value. In particular, if of the simulated values are greater or equal to the real value, then the estimated detection confidence level from MC simulations is simply .
The MC detection probabilities for the absorption lines are given in Table 3. The values are in the range between 91% and 99.9%. As expected, these estimates are slightly lower than those derived from the F-test (99%) because they effectively take into account the random generated lines in the whole 7–10 keV energy interval.
3.4 Photo-ionization modeling
To model the absorbing material that is photo-ionized by the nuclear radiation, a grid with the Xstar code (Kallman & Bautista 2001) was generated. We modeled the nuclear X-ray ionizing continuum with a power-law with photon index , as usually assumed for Seyfert galaxies, which takes into account the possible steeper soft excess component (e.g., Bianchi et al. 2005). A different choice of the power-law slope in the range 1.5–2.5 has negligible effects (5%) on the parameter estimates in the considered Fe K band, E3.5–10.5 keV. Moreover, as already noted by McKernan et al. (2003a), the presence or absence of the possible UV-bump in the SED has a negligible effect on the parameters of the photo-ionized gas in the Fe K band because in this case the main driver is the ionizing continuum in the hard X-rays (E6 keV). Standard solar abundances are assumed throughout (Grevesse et al. 1996).
The velocity broadening of absorption lines from the photo-ionized absorbers in the central regions of Seyfert galaxies is dominated by the turbulence velocity component, commonly assumed to be in the range 100–1000 km/s (e.g., Bianchi et al. 2005; Risaliti et al. 2005; Cappi et al. 2009 and references therein). The energy resolution of the XIS instruments in the Fe K band is FWHM100–200 eV, implying that lines with velocity broadening lower than 2000–4000 km/s are unresolved. Therefore, given that we cannot estimate the velocity broadening of the lines directly from the spectral data, we generated an Xstar grid assuming the most likely value for the turbulent velocity of the gas of 500 km/s. We checked that for higher choices of this parameter, the resultant estimate of the ionization parameter was not affected, although the derived absorber column density was found to be slightly lower. This is due to the fact that the core of the line tends to saturate at higher , with increasing the velocity broadening (e.g., Bianchi et al. 2005). The opposite happens for lower choices of the turbulent velocity. However, the resulting difference of 5–10% in the derived values is completely negligible and well within the measurement errors.
Therefore, we apply this photo-ionization grid to model directly the different absorption lines detected in the Fe K band. The free parameters of the model are the absorber column density , the ionization parameter and the velocity shift . We let the code find the best-fit values and it turned out that the gas is systematically outflowing, with velocities consistent with those derived from the Gaussian absorption lines fits (see §3.2 and Appendix A for a detailed discussion of each source). The Xstar parameters are reported in Table 4 and the best-fit models are shown in Fig. 2 and Fig. 4. A consistency check of the results from a broad-band spectral analysis is reported in §4.2.
4 General results
4.1 Fe K band spectral analysis
In this Section we summarize the results of the spectral fits to the 3.5–10.5 keV XIS-FI spectra of the BLRGs of our sample with a model consisting of the baseline model plus absorption lines and a detailed photoionization grid (see above). Results for individual sources are discussed in Appendix A.
The results of the fits with the baseline model are listed in Table 2, while the residuals of this model are shown in Figures 1, 3, and 5 for the five BLRGs, together with the contours. As mentioned above, absorption dips are visible and to assess their statistical significance we used both the F-test and extensive Monte Carlo simulations. The results of these tests, reported in Table 3, establish that only in 3/5 sources we do detect reliably absorption features at energies 7.3–7.5 keV and 8.1–8.7 keV, namely in 3C 111, 3C 120b, and 3C 390.3. In these three sources, the absorption lines are detected with confidence levels higher than 99% with the F-test and higher than 91% with the Monte Carlo method (Table 3). We fitted the absorption features by adding narrow Gaussian components, or a blend of narrow components, to the baseline model. The Gaussian parameters are reported in Table 3.
Given the high cosmic abundance of Fe, the most intense spectral features expected from a highly ionized absorber in the 3.5–10.5 keV band are the K-shell resonances of Fe XXV and Fe XXVI (e.g., Kallman et al. 2004). However, the rest-frame energies of the detected absorption lines are in the range 7.3–7.5 keV and 8.1–8.8 keV, larger than the expected energies of the atomic transitions for Fe XXV and Fe XXVI. An interesting possibility is that the absorption lines detected in the BLRGs are due, similarly to those recently observed in Seyferts, to blueshifted resonant lines of highly ionized Fe, thus implying the presence of fast outflows in radio-loud AGN as well. If we hold this interpretation true, the derived outflow velocities are in the range 0.04–0.15c.
We also performed more physically consistent spectral fits using the Xstar photoionization grid described in § 3.4 (see Fig. 2 and Fig. 4). Good fits are obtained with this model, yielding ionization parameters log4–5.6 erg s-1 cm and column densities – cm-2. The derived blue-shifted velocities are consistent with those from the simple phenomenological fits, 0.04–0.15c (see Table 4). We note that, given the very high ionization level of this absorbing material, no other significant signatures are expected at lower energies as all the elements lighter than iron are almost completely ionized.
An important caveat is that the velocities and column densities derived by fitting the spectral data with the Xstar grid depend on the unknown inclination angle of the outflow with respect to the line of sight. In other words, they depend on whether we are actually looking directly down to the outflowing stream or intercepting only part of it (e.g., Elvis 2000). Therefore, the obtained values (see Table 4) are only conservative estimates and represent lower limits.
In conclusion, we detected for the first time in radio-loud AGN at X-rays, absorption lines in the energy range 7–10 keV in the Suzaku XIS spectra of 3/5 BLRGs – 3C 111, 3C 390.3, and 3C 120. If interpreted as blueshifted resonant absorption lines of highly ionized Fe, the features imply the presence of ultra-fast (v 0.04-0.15c) outflows in the central regions of BLRGs. In §5 we discuss more in depth this association and the inferred outflow physical properties.
4.2 Broad-band spectral analysis
As a consistency check of the Fe K band (E3.5–10.5 keV) based results, we exploited the broad-band capabilities of Suzaku combining the XIS and PIN spectra. The energy band covered in this way is very broad, from 0.5 keV up to 50 keV. We downloaded and reduced the PIN data of 3C 111, 3C 390.3 and 3C 120 and analyzed the combined XIS-FI and PIN spectra. For 3C 390.3 and 3C 120 we applied the broad-band models already published in the literature by Sambruna et al. (2009) and Kataoka et al. (2007). Instead, for 3C 111, we used the broad-band model that will be reported by us in Ballo et al. (2010, in prep.). This is essentially composed by a power-law continuum with Galactic absorption, plus cold reflection (1) and the Fe K emission line at E6.4 keV. The resultant power-law photon index of this fit is 1.6, which is slightly steeper than the estimate of 1.5 from the local continuum in the 3.5–10.5 keV band (see Table 2). We included the neutral Galactic absorption component in all broad-band fits (see Table 1). Then, we modeled the blue-shifted absorption lines with the Xstar photo-ionization grid already discussed in §3.4., letting the column density, the ionization parameter and the velocity shift vary as free parameters.
The best-fit estimates of the Fe K absorbers derived from these broad-band fits are completely consistent with those reported in Table 4. In particular, for 3C 111 we obtain an ionization parameter of log erg s-1 cm, a column density of cm-2 and an outflow velocity of c. For 3C 390.3, we estimate log erg s-1 cm, cm-2 and c. Finally, for 3C 120b, we derive log erg s-1 cm, cm-2 and c. This also assures that the addition of a weak reflection component with 1 (e.g., Sambruna et al. 2009; Kataoka et al. 2007; Ballo et al. 2010 in prep.) does not change at all the fit results.
Moreover, it is important to note here that we do not find any evidence for a lower ionization (log3 erg s-1 cm) warm absorber at E3 keV in these three sources. This rules out any possible systematic contamination from moderately ionized iron and strengthens the interpretation of the absorption lines at E7 keV as genuine blue-shifted Fe XXV and Fe XXVI K-shell transitions. As already introduced in §1, the only object with the detection of a soft X-ray warm absorber in its high energy resolution Chandra HETG (Reeves et al. 2009b) and XMM-Newton RGS (Torresi et al. 2010) spectra is 3C 382. On the other hand, a heavy soft X-ray absorption from neutral/mildly-ionized gas with cm-2 has been reported in the XMM-Newton spectrum of 3C 445 (Sambruna, Reeves & Braito 2007). This result is also confirmed by a Chandra LETG and a Suzaku broad-band spectral analysis presented in Reeves et al. (2010, in prep.) and Braito et al. (2010, in prep.), respectively. However, we did not find any significant narrow Fe K absorption line features in the 7–10 keV Suzaku XIS spectra of these two sources from this analysis.
5 Discussion
5.1 Evidence for Ultra-fast Outflows in BLRGs
The discovery of Ultra-Fast Outflows (UFOs) in radio-loud BLRGs parallels the detection of UFOs in the X-ray spectra of several Seyfert galaxies and radio-quiet quasars (e.g., Chartas et al. 2002; Chartas et al. 2003; Pounds et al. 2003; Dadina et al. 2005; Markowitz et al. 2006; Braito et al. 2007; Cappi et al. 2009; Reeves et al. 2009a). The presence of UFOs in radio-quiet sources was recently established through a systematic, uniform analysis of the XMM-Newton archive on a large number of sources (Tombesi et al. 2010), overcoming possible publication biases (e.g., Vaughan & Uttley 2008).
While a uniform analysis was also performed in this work, it should be noted that our small sample is not complete and the results might not be representative of the global population of BLRGs. Therefore, to obtain better constraints on the statistical incidence and parameters of UFOs in BLRGs, it is imperative to expand the sample of sources with high-quality X-ray observations in the next few years through Suzaku and XMM-Newton observations of additional sources.
However, it has been claimed that part (or even all) of the blue-shifted ionized absorption features detected in the X-ray spectra of bright AGN could be affected by contamination from local () absorption in our Galaxy or by the Warm/Hot Intergalactic Medium (WHIM) at intermediate red-shifts, due to the fact that some of them have blue-shifted velocities comparable to the sources cosmological red-shifts (e.g., McKernan et al. 2003b; McKernan et al. 2004; McKernan et al. 2005). We performed some tests to look into this scenario. We can use the velocity information and compare the absorber blue-shifted velocities with the cosmological red-shifts of the sources. The blue-shifted velocities of the absorbers detected in 3C 120 and 3C 390.3 (see Table 4) are much larger than the sources cosmological red-shifts (see Table 1). This conclusion is strong enough to rule out any contamination due to absorption from local or intermediate red-shift material in these two sources. However, the derived blue-shifted velocity of c for the highly ionized absorber in 3C 111 is instead somewhat similar to the source cosmological red-shift of and needs to be investigated in more detail. The difference between the two values is c, which could indicate absorption from highly ionized material either in our Galaxy and outflowing with that velocity (2000 km/s) along the line of sight or at rest and located at that intermediate red-shift ().
The galaxy 3C 111 is located at a relatively low latitude () with respect to the Galactic plane and therefore its X-ray spectrum could be, at some level, affected by local obscuration. However, the estimated column density of Galactic material along the line of sight of the source is cm-2 (Dickey & Lockman 1990; Kalberla et al. 2005), which is far too low to explain the value of cm-2 of the absorber from fits of the Suzaku spectrum (see Table 4). Nevertheless, the source is located near the direction of the Taurus molecular cloud, which is the nearest large star-forming region in our Galaxy.
A detailed optical and radio study of the cloud has been reported by Ungerer et al. (1985). From the analysis of the emission from the stars in that region and the molecular emission lines, the authors estimated several parameters of the cloud, such as the location at a distance of 400 pc (with a linear extent of 5 pc), a kinetic temperature of 10 K, a typical velocity dispersion of 1–3 km/s and a low number density of 300 cm-3. These parameters are completely inconsistent with the properties of the X-ray absorber. In fact, the extreme ionization level ( erg s-1 cm) needed to have sufficient Fe XXVI ions would completely destroy all the molecules and ionize all the lighter atoms. The temperature associated with such photo-ionized absorber ( K) is larger than estimated for the Taurus molecular cloud. Also the outflow velocity of 2000 km/s, expected if associated with such Galactic clouds, would be substantially higher than the velocity dispersion estimated by Ungerer et al. (1985). The authors also stated that the mapping of the visual extinction due to the molecular cloud clearly shows that the region of the cloud in front of 3C 111 is not the densest part (see Fig. 3 of Ungerer et al. 1985).
This result is also supported by a recent detailed X-ray study of this region that has been performed by the XMM-Newton Extended Survey of the Taurus Molecular Cloud project (Güdel et al. 2007). This work has been focused on the study of the stars and gas located in the most populated 5 square degrees region of the Taurus cloud. With a declination of , 3C 111 is located outside the edge of this complex region, where mainly only extended cold and low density molecular clouds are distributed (see Fig. 1 of Güdel et al. 2007). Therefore, the identification of the highly ionized absorber of 3C 111 with local Galactic absorption is not feasible.
We also find that association with absorption from the WHIM at intermediate red-shift () is very unlikely. In fact, this diffuse gas is expected to be collisionally ionized, instead of being photo-ionized by the AGN continuum. Therefore, the temperature required to have a substantial He/H-like iron population would be much higher (– K) than the expected – K. The huge column density of gas ( cm-2) required to reproduce the observed features is also too high compared to those expected for the WHIM ( cm-2). Moreover, the detection of highly ionized absorbers in 3C 120 and 3C 390.3 with blue-shifted velocities substantially larger than the relative cosmological red-shifts strongly supports the association of the absorber in 3C 111 with a UFO intrinsic to the source.
Similar conclusions were reached by Reeves et al. (2008) concerning the bright quasar PG 1211+143. The X-ray spectrum of this source showed a blue-shifted absorption line from highly ionized iron (Pounds et al. 2003; Pounds & Page 2006) with a blue-shifted velocity comparable to the cosmological red-shift of the source. This led some authors to suggest its possible association with absorption from intervening diffuse material at 0 (e.g., McKernan et al. 2004). However, the detection of line variability on a time-scale less than 4 yrs, suggesting a compact pc scale absorber, and the extreme parameters of the absorber, e.g., log3–4 erg s-1 cm and – cm-2, led Reeves et al. (2008) to exclude such interpretation. As pointed out by the authors, the evidence of several other radio-quiet AGN with Fe K absorption with associated blue-shifted velocities higher than the relative cosmological red-shift suggested that the case of PG 1211+143 was a mere coincidence (see also Tombesi et al. 2010).
We conclude that the evidence for UFOs in BLRGs from Suzaku data is indeed robust. In the next section we examine their physical properties in detail.
5.2 Physical properties of Ultra-fast Outflows
From the definition of the ionization parameter (Tarter, Tucker & Salpeter 1969), where is the average absorber number density and is the source X-ray ionizing luminosity integrated between 1 Ryd and 1000 Ryd (1 Ryd=13.6 eV), we can estimate the maximum distance of the absorber from the central source. The column density of the gas is a function of the density of the material and the shell thickness : . Making the reasonable assumption that the thickness is less than the distance from the source and combining with the expression for the ionization parameter, we obtain the upper limit . Using the absorption corrected luminosities erg s-1, erg s-1 and erg s-1 directly estimated from the Suzaku data and the ionization parameters and column densities listed in Table 4, we obtain the limits of cm (0.007 pc), cm (0.3 pc) and cm (0.01 pc) for 3C 111, 3C 120 and 3C 390.3, respectively. Using the black hole mass estimates of for 3C 111 (Marchesini et al. 2004), for 3C 120 (Peterson et al. 2004) and for 3C 390.3 (Marchesini et al. 2004; Peterson et al. 2004), the previous limits on correspond to a location for the absorber within a distance of 20 , 7 and 500 from the super-massive black hole, respectively. The expected variability time-scale of the absorbers from the light crossing time, , is 600–700 ks (7 days) for 3C 111, 1 yr for 3C 120 and 15–20 days for 3C 390.3, respectively.
A rough estimate of the escape velocity along the radial distance for a Keplerian disk can be derived from the equation , which can be re-written as . Therefore, for 3C 111 the escape velocity at the location of is c, which is larger than the measured outflow velocity of 0.041c (see Table 4). This implies that most likely the absorber is actually in the form of a blob of material which would eventually fall back down, possibly onto the accretion disk. For 3C 120, the measured outflow velocity 0.076c (see Table 4) is equal to the escape velocity at a distance of 200 from the black hole. Therefore, if the launching region is further away than this distance, the ejected blob is likely to escape the system. Concerning 3C 390.3, the measured velocity of 0.146c (see Table 4) is larger than the escape velocity at and equals that at a distance of 50–60. Therefore, if the blob of material has been ejected from a location between, say, and , it has likely enough energy to eventually leave the system.
We can get an idea of the effectiveness of the AGN in producing outflows by comparing their luminosity with the Eddington luminosity, erg s-1. Substituting the estimated black hole mass for each source, we have erg s-1 for 3C 111, erg s-1 for 3C 120 and erg s-1 for 3C 390.3, respectively. From the relation (e.g., McKernan et al. 2007), the bolometric luminosities of the different sources are: erg s-1 for 3C 111, erg s-1 for 3C 120 and erg s-1 for 3C 390.3, respectively. The ratio is almost negligible for 3C 111 but it is of the order of 0.1–0.4 for 3C 120 and 3C 390.3. These two sources are emitting closer to their Eddington limits and therefore are more capable of producing powerful outflows/ejecta that would eventually leave the system (e.g., King & Pounds 2003; King 2010). This supports the conclusions from the estimates on the location of the ejection regions and the comparison of the outflow velocities with respect to the escape velocities.
Moreover, assuming a constant velocity for the outflow and the conservation of the total mass, we can roughly estimate the mass loss rate associated to the fast outflows, (e.g., Blustin et al. 2005; McKernan et al. 2007), where is the outflow velocity, is the absorber number density, is the radial distance, is the proton mass and is the covering fraction, which in turn depends on the solid angle subtended by the absorber. From the definition of the ionization parameter , we obtain . Substituting the relative values, we derive estimates of Myr-1, M☉ yr-1 and M☉ yr-1 for 3C 111, 3C 120 and 3C 390.3, respectively.
The kinetic power carried by the outflows can be estimated as , which roughly corresponds to erg s-1, erg s-1 and erg s-1 for 3C 111, 3C 120 and 3C 390.3, respectively. Note that, depending on the estimated covering fraction, the kinetic power injected in these outflows can be substantial, possibly reaching significant fractions (0.01–0.5) of the bolometric luminosity and can be comparable to the typical jet power of these sources of – erg s-1, the latter being the power deposited in the radio lobes (Rawlings & Saunders 1991).
Therefore, it is important to compare the fraction of mass that goes into accretion of the system with respect to that which is lost through these outflows. Following McKernan et al. (2007), we can derive a simple relation for the ratio between the mass outflow rate and the mass accretion rate, i.e. , where is the outflow velocity in units of 0.1c, is the ionization parameter in units of 100 erg s-1 cm and is the accretion efficiency. Substituting the parameters with their relative values listed in Table 4, we obtain for 3C 111, for 3C 120 and for 3C 390.3, respectively.
These estimates depend on the unknown value of the covering fraction . A very rough estimate of the global covering fraction of these absorbers can be derived from the fraction of sources of our small sample: (e.g., Crenshaw et al. 1999). This suggests that the geometrical distribution of the absorbing material is not very collimated but large opening angles are favored. The rough estimate implies the possibility of reaching ratios of about unity or higher between the mass outflow and accretion rates. This means that these outflows can potentially generate significant mass and energy losses from the system. However, the covering fraction crude estimate of has been derived from a very small sample which is far from being complete and therefore could not be fully representative of the whole population of BLRGs.
The physical characteristics of UFOs here derived for the three BLRGs strongly point towards an association with winds/outflows from the inner regions of the putative accretion disk. In fact, simulations of accretion disks in AGN ubiquitously predict the generation of mass outflows. For instance, the location, geometry, column densities, ionization and velocities of our detected UFOs are in good agreement with the AGN accretion disk wind model of Proga & Kallman (2004). In this particular model the wind is driven by radiation pressure from the accretion disk and the opacity is essentially provided by UV lines. Depending on the angle with respect to the polar axis, three main wind components can be identified: a hot, low density and extremely ionized flow in the polar region; a dense, warm and fast equatorial outflow from the disk; and a transition zone in which the disk outflow is hot and struggles to escape the system. The ionization state of the wind decreases from polar to equatorial regions. Instead, the column densities increase from polar to equatorial, up to very Compton-thick values ( cm-2). The outflows can easily reach large velocities, even higher than km/s.
Lines of sight through the transition region of the simulated outflow, where the density is moderately high (– cm-3) and the column density can reach values up to cm-2, result in spectra that have considerable absorption features from ionized species imprinted in the X-ray spectrum, mostly with intermediate/high ionization parameters, log3–5 erg s-1 cm. This strongly suggests that the absorption material could be observed in the spectrum through Fe K-shell absorption lines from Fe XXV and Fe XXVI (e.g., Sim et al. 2008; Schurch et al. 2009; Sim et al. 2010), in complete agreement with our detection of UFOs. In particular, Sim et al. (2008) and Sim et al. (2010) used their accretion disk wind model to successfully reproduce the 2–10 keV spectra of two bright radio-quiet AGN in which strong blue-shifted Fe K absorption lines were detected in their XMM-Newton spectra, namely Mrk 766 (from Miller et al. 2007) and PG 1211+143 (from Pounds et al. 2003 ). Notably, the authors have been able to account for both emission and absorption features in a physically self-consistent way and demonstrated that accretion disk winds/outflows might well imprint also other spectral signatures in the X-ray spectra of AGN (e.g., Pounds & Reeves 2009 and references therein).
Hydrodynamic wind simulations are highly inhomogeneous in density, column and ionization and have strong rotational velocity components. Therefore the outflow, especially in its innermost regions, is rather unstable. In particular, the outflow properties through the transition region show considerable variability and this is expected to be reflected by the spectral features associated with this region, i.e. by the corresponding blue-shifted Fe XXV/XXVI K-shell absorption lines.
Proga & Kallman (2004) and Schurch et al. (2009) state that it is possible that some parts or blobs of the flow, especially in the innermost regions, do not have enough power to allow a “true” wind to be generated. In these cases, a considerable amount of material is driven to large-scale heights above the disk but the velocity of the material is insufficient for it to escape the system and it will eventually fall back onto the disk. Despite returning to the accretion disk at larger radii, while it is above the disk, this material can imprint features on the observed X-ray spectrum (e.g., Dadina et al. 2005 and references therein). This can indeed be the case for some of the UFOs discussed here (i.e., 3C 111).
This overall picture is also partially in agreement with what predicted by the “aborted jet” model by Ghisellini et al. (2004). This model was actually proposed to explain, at least in part, the high-energy emission in radio-quiet quasars and Seyfert galaxies. It postulates that outflows and jets are produced by every black hole accretion system. Blobs of material can then be ejected intermittently and can sometimes only travel for a short radial distance and eventually fall back, colliding with others approaching. Therefore, the flow can manifest itself as erratic high-velocity ejections of gas from the inner disk and it is expected that some outflows/blobs are not fast enough to escape the system and will eventually fall back onto the disk. An intriguing possibility could be that these outflows are generated by localized ejection of material from the outer regions of a bubbling corona, which emits the bulk of the X-ray radiation (Haardt & Maraschi 1991), in analogy with what observed in the solar corona during the Coronal Mass Ejection events (e.g., Low 1996). The velocity and frequency of these strong events should then be limited to some extent, in order not to cause the disruption or evaporation of the corona itself. Such extreme phenomena could then be the signatures of the turbulent environment close to the super-massive black hole.
The detection of UFOs in both radio-quiet and radio-loud galaxies suggests a similarity of their central engines and demonstrates that the presence of strong relativistic jets do not exclude the existence of winds/outflows from the putative accretion disk. Moreover, it has been demonstrated by Torresi et al. (2010) and Reeves et al. (2009) that a warm absorber is indeed present also in BLRGs (in particular 3C 382) and this indicates that jets and slower winds/outflows can coexist in the same source, even beyond the broad-line region.
However, BLRGs are radio-loud galaxies and they have powerful jets. Therefore, the fact that for BLRGs we are observing down to the outflowing stream at intermediate angles to the jet (15–30∘; e.g., Eracleous & Halpern 1998) suggests that the fast winds/outflows we observe are at greater inclination angles with respect to the jet axis, somewhat similar to what expected for accretion disk winds (e.g., Proga & Kallman 2004). These outflows would then not be able to undergo the processes which instead accelerate the jet particles to velocities close to the speed of light.
For instance, studies of Galactic stellar-mass black holes, or micro-quasars, showed that wind formation occurs in competition with jets, i.e. winds carry away matter halting their flow into jets (e.g., Neilsen & Lee 2009). Given the well-known analogy between micro-quasars and their super-massive relatives, one would naively expect a similar relationship for radio-loud AGN. The BLRGs 3C 111 and 3C 120 are regularly monitored in the radio and X-ray bands with the VLBA and RXTE as part of a project aimed at studying the disk-jet connection (e.g., Marscher et al 2002). We have detected UFOs in both of these sources (see Table 4), and indeed in both cases the 4–10 keV fluxes measured with Suzaku corresponded to historical low(est) states if compared to the RXTE long-term light curves. For instance, correlated spectroscopic observations of 3C 111, where the shortest variability timescales are predicted (t7 days), during low and high jet continuum states could provide, in a manner analogous to micro-quasars, valuable information on the synergy among disk, jet, and outflows, and go a long way towards elucidating the physics of accretion/ejection in radio-loud AGN.
However, whether it is possible to accelerate such ultra-fast outflows with velocities up to 0.15c only through UV line-driving is unclear. Moreover, the material needs to be shielded from the high X-ray ionizing flux in the inner regions of AGN, otherwise it would become over-ionized and the efficiency of this process would be drastically reduced. Other mechanisms as well are capable of accelerating winds from accretion disks, in particular radiation pressure through Thomson scattering and magnetic forces.
In fact, Ohsuga et al. (2009) proposed a unified model of inflow/outflow from accretion disks in AGN based on radiation-MHD simulations. Disk outflows with helical magnetic fields, which are driven either by radiation-pressure force or magnetic-pressure, are ubiquitous in their simulations. In particular, in their case A (see their Fig. 1) a geometrically thick, very luminous disk forms with a luminosity , which effectively drives a fast Compton-thick wind with velocities up to 0.2–0.3c. It is important to note that the models of Ohsuga et al. (2009) include both radiation and magnetic forces which, depending on the state of the system, can generate both relativistic jets and disk winds.
Moreover, King & Pounds (2003) and King (2010) showed that black holes accreting with modest Eddington rates are likely to produce fast Compton-thick winds. They considered only radiation-pressure and therefore fast winds can be effectively generated by low magnetized accretion disks as well. In particular, King (2010) derived that Eddington winds from AGN are likely to have velocities of 0.1c and to be highly ionized, showing the presence of helium- or hydrogen-like iron. These properties strongly point toward an association of our detected UFOs from the innermost regions of AGN with Eddington winds/outflows from the putative accretion disk.
Depending on the estimated covering fraction, the derived mass outflow rate of the UFOs can be comparable to the accretion rate and their kinetic power can correspond to a significant fraction of the bolometric luminosity and is comparable to the jet power. Therefore, the UFOs may have the possibility of bringing significant amount of mass and energy outward, potentially contributing to the expected feedback from the AGN. In particular, King (2010) demonstrated that fast outflows driven by black holes in AGN can explain important connections between the SMBH and the host galaxy, such as the observed – relation (e.g., Ferrarese & Merritt 2000). These UFOs can potentially provide an even more important contribution to the expected feedback between the AGN and the host galaxy than the jets in radio-loud sources. In fact, even if jets are highly energetic, they are also extremely collimated and carry a negligible mass. Fast winds/outflows from the accretion disks, instead, are found to be massive and extend over wide angles. Thus, we suggest that UFOs in radio-loud AGN are a new, important ingredient for feedback models involving these sources.
6 Summary and Conclusions
Using high signal-to-noise Suzaku observations, we detected several absorption lines in the 7–10 keV band of three out of five BLRGs with high statistical significance. If interpreted as blueshifted K-shell resonance absorption lines from Fe XXV and Fe XXVI, the lines imply the presence of outflowing gas from the central regions of BLRGs with mildly relativistic velocities, in the range 0.04–0.15c. The inferred ionization states and column densities of the absorbers are in the range log4–5.6 erg s-1 cm and – cm-2, respectively. This is the first time that evidence for Ultra-fast Outflows (UFOs) from the central regions of radio-loud AGN is obtained at X-rays.
The estimated location of these UFOs at distances within 0.01–0.3 pc from the central super-massive black hole suggests that the outflows might be connected with AGN accretion disk winds/ejecta (e.g., King & Pounds 2003; Proga & Kallman 2004; Ohsuga et al. 2009; King 2010). Depending on the covering fraction estimate (here, 0.6), their mass outflow rate can be comparable to the accretion rate and their kinetic power may correspond to a significant fraction of the bolometric luminosity and be comparable to the jet power. These UFOs would thus bring outward significant amounts of mass and energy, potentially contributing to the expected feedback from the AGN on the surrounding environment.
These results are in analogy with the recent findings of blue-shifted Fe K absorption lines at 7–10 keV in the X-ray spectra of several radio-quiet AGN, which demonstrated the presence of UFOs in the central regions of these sources (e.g., APM 082795255, Chartas et al. 2002; PG 1115080, Chartas et al. 2003; PG 1211+143, Pounds et al. 2003; IC4329A, Markowitz et al. 2006; MCG-5-23-16, Braito et al. 2007; Mrk 509, Cappi et al. 2009; PDS 456, Reeves et al. 2009a; see Tombesi et al. 2010 for a systematic study on a large sample of Seyfert galaxies). In particular, it is important to note that the physical parameters of UFOs in radio-loud AGN previously discussed are completely consistent with those reported in radio-quiet AGN. This strongly suggests that we could actually be witnessing the same physical phenomenon in the two classes of objects and this can help us improve the understanding of the relation between the disk and the formation of winds/jets in black hole accretion systems.
Several questions remain open. It is important to note that the estimate of the covering factor in § 5.2 might actually be only a lower limit. Fast outflows are expected to come from regions close to the central black hole and to be highly ionized. Thus, a slight increase in the ionization level of the absorbers would cause iron to be completely ionized and the gas to become invisible also in the Fe K band. Therefore, it is also quite possible that most, if not all, radio-loud AGN contain ultra-fast outflows which can not be seen at present simply because they are highly ionized.
The physical properties of UFOs in BLRGs are also of great interest to understand the dynamics of accretion/ejection and the disk-jet connection. In particular, by studying the source variability, which, in some sources, is expected to occur on timescales as short as a few days, we can investigate the gas densities and internal dynamics of the outflow, as well as better constrain its distance from the SMBH. This can help us understand in detail whether the UFOs in radio-loud AGN are similar to those in radio-quiet ones, or if major quantitative differences exist which affect jet formation and thus the radio-loud/radio-quiet AGN division.
Finally, a substantial improvement is expected from the higher effective area and supreme energy resolution (down to 2–5 eV) in the Fe K band offered by the calorimeters on board the future Astro-H and IXO missions. In particular, the lines will be resolved and also their profiles could be measured. The parameters of UFOs will be determined with unprecedented accuracy and their dynamics could, potentially, also be studied through time-resolved spectroscopy on short time-scales (e.g., Tombesi et al. 2009).
Appendix A Notes on single sources
A.1 3C 111
The 3.5–10.5 keV XIS-FI spectrum of 3C 111 is well described by a simple power-law continuum (with ) and a narrow neutral Fe K emission line at the rest-frame energy of 6.4 keV (see Table 2). A detailed broad-band spectral analysis of the Suzaku spectrum of this source will be reported in Ballo et al. (2010, in prep.). However, as it can be seen from the ratio of the spectrum against a simple power-law continuum reported in the upper panel of Fig. 1 (left), further complexities are present in the spectrum. In fact, besides the narrow emission line, two absorption features can be clearly seen at the observed energies of 7 keV and 8–9 keV. These absorption features are still present in the energy-intensity contour plot (see lower panel of Fig. 1, left), which suggest that their detection confidence levels should be higher than 99%.
Therefore, we directly fit the data, adding two further absorption lines to the baseline model. The detailed line parameters are reported in Table 3. The first absorption line is not resolved and is detected at a rest-frame energy of E keV, with an equivalent width of EW eV. Its detection confidence level is high: 99.9% from the standard F-test and 99% from extensive Monte Carlo simulations (see § 3.3). The most intense spectral features expected at energies 7 keV are the inner K-shell resonances from Fe XXVI (e.g., Kallman et al. 2004). These lines are those of the Lyman series, that is: the Ly (1s–2p) at E keV, the Ly (1s–3p) at E keV, the Ly (1s–4p) at E keV and the Ly (1s–5p) at E keV (all line parameters have been taken from the NIST111http://physics.nist.gov/PhysRefData/ASD/lines_form.html atomic database, unless otherwise stated). However, the observed line energy is not consistent with any of these known atomic transitions. If identified with Fe XXVI Ly resonant absorption, the centroid of the line indicates a substantial blue-shifted velocity of c.
The second absorption line is at a measured rest-frame energy of E keV. It is broader than the first one, with a resolved width of eV and an equivalent width of EW eV (see Table 3). The detection confidence level of the line is higher than 99.9% with both the F-test and Monte Carlo simulations (see §3.3). Also in this case the energy of the line is not consistent with any known atomic transition. If identified with Fe XXVI Ly, the centroid of the line indicates a blue-shifted velocity of 0.05c. This value is comparable with that of the former line. However, if this is the case, the ratio of the EWs of the Fe XXVI Ly and Ly would be 0.2. This is at odds with what expected from theory. In fact, the ratio between these lines must be instead equal to 5 (which is the ratio of their oscillator strengths: and , respectively) and it could decrease to a minimum of 1 when the lines are substantially saturated (e.g., Risaliti et al. 2005). This would suggest that the second broad absorption line could actually be a blend of different blue-shifted resonance lines, such as the Ly, Ly and Ly. This scenario is supported by the fact that the energy resolution of the XIS instruments degrades with increasing energy (at E8–9 keV it is of the order of FWHM200 eV) and therefore these lines could not be separated properly.
To test whether a line blend is consistent with the data, we performed a fit adding to the baseline model four additional narrow absorption lines with energies fixed to the expected values for the Fe XXVI Lyman series and leaving their common energy shift as a free parameter. These lines provide a very good modeling of both absorption features at E7 keV, with a global for five additional parameters. The probability of having these four absorption lines at these exact energies simply from random fluctuations is very low, about . Interestingly enough, their common blue-shifted velocity is c, consistent with the one calculated above for the first absorption line. The resultant EWs of the four Fe XXVI lines are: EW eV for the Ly, EW eV for the Ly, EW for the Ly and EW eV for the Ly. Their ratios are now consistent with the theoretical expectations and the fact that they are close to unity suggests possible saturation effects.
In order to have a more physically consistent modeling of these spectral features, we performed a fit using the Xstar photo-ionization grid discussed in § 3.4. The best fit parameters are reported in Table 4. We obtained a good fit with a highly ionized absorber (22 for three additional parameters, required at a level of 99.9%) with an ionization parameter of log erg s-1 cm and a column density of cm-2. The blue-shifted velocity is c, completely consistent with the value determined above fitting with four simple inverted Gaussian lines. Given the extremely high ionization level of this absorbing material, no other signatures are expected at lower energies as all the elements lighter than iron are fully ionized, as indeed observed.
We conclude that the detected absorption features are actually due to blue-shifted Fe XXVI Lyman series lines. In Fig. 2 (left) we plot the baseline model composed by a power-law continuum and a neutral Fe K emission line, and superimposed on it the model of the absorption features with two simple inverted Gaussian lines and the Xstar model. The plot shows that the two models are almost completely coincident up to the first absorption line (identified as Fe XXVI Ly at the observed energy of 7 keV) and clearly demonstrates that the apparent broadening of the second absorption feature is actually due to a blend of the three higher order Lyman series lines (i.e. Ly, Ly and Ly).
A consistency check of the Fe K absorber parameters from a broad-band XISPIN fit is reported in §4.2. Instead, the XIS-FI background analysis and the consistency check of the line parameters among the different XIS cameras (see Table 5), along with the discussion of possible alternative modelings of the lines, are reported in Appendix B.
A.2 3C 390.3
A power-law continuum (with ) plus a narrow neutral Fe K emission line at 6.4 keV provide a good modeling of the 3.5–10.5 keV XIS-FI spectrum of 3C 390.3 (see Table 2). The broad-band spectral analysis of this Suzaku data set has been reported by Sambruna et al. (2009). From the spectral ratios and the energy-intensity contour plots of Fig. 1 (right) there is indication of a possible narrow absorption feature at the observed energy of 7.7 keV, with a detection confidence level greater than 99%.
Therefore, we fit the spectrum adding a further narrow (unresolved) absorption line to the baseline model. The rest-frame energy of the line is E keV and its equivalent width is EW eV (see Table 3). The detection confidence level of the line is high: 99.9% from the standard F-test and 99.5% from extensive Monte Carlo simulations (see § 3.3). Also in this case the energy of the line is not consistent with any known atomic transition. However, the most intense lines expected from a highly ionized absorber at E7 keV are the Fe XXVI Lyman series (see § A.1.). If identified with Fe XXVI Ly resonant absorption, the centroid of the line indicates a substantial blue-shifted velocity of c. In order to derive a more physically consistent modeling of this absorption line we performed a fit using the Xstar photo-ionization grid discussed in §3.4. The best fit parameters are reported in Table 4. We obtained a good fit with a highly ionized absorber (14 for three more parameters, required at the 99.5% level) with an ionization parameter of log erg s-1 cm and a column density of cm-2. The blue-shifted velocity of the absorber is c, completely consistent with what was derived from fitting with a simple inverted Gaussian line. Given the very high ionization level of this absorbing material, no other significant signatures are expected at lower energies as all the elements lighter than iron are completely ionized.
The comparison of the best fit results for 3C 390.3 including the baseline model and superimposed the modeling of the blue-shifted absorption line (identified as Fe XXVI Ly) with a simple narrow inverted Gaussian or with the Xstar photo-ionization code is shown in Fig. 2 (right). The two models coincide completely, apart from a few weak higher order Lyman series resonances which cannot be detected with sufficient significance given the quality of the spectral data.
In §4.2 we report a consistency check of the results performing also a broad-band XISPIN spectral analysis. In Appendix B we discuss the XIS-FI background analysis, the consistency check of the blue-shifted Fe K absorption lines among the different XIS cameras (see Table 5) and also possible alternative modelings.
A.3 3C 120
The 3.5–10.5 keV XIS-FI spectrum of observation 3C 120a (see § 2) is well modeled by a power-law continuum () and a narrow neutral Fe K emission line at the rest-frame energy of 6.4 keV (see Table 2). As it can be seen from the ratio of the spectrum against a power-law continuum and the contour plots in the left part of Fig. 3 (upper and lower panels, respectively) there are no significant emission/absorption features in the Fe K band apart from the narrow Fe K emission line.
The 3.5–10.5 keV XIS-FI spectrum of observation 3C 120b (see § 2) is well described by a power-law continuum (with ) plus a narrow neutral Fe K emission line at E6.4 keV and a further narrow emission line at E6.9 keV (see Table 2). These overall results are in agreement with the spectral analysis of this data set previously reported by Kataoka et al. (2007). However, the spectral ratio and the energy-intensity contour plots in the right part of Fig. 3 (upper and lower panels, respectively), suggest that further complexities might be present in the Fe K band. In particular, there is evidence for absorption structures at the observed energies of 7–7.4 keV and 8–9 keV. The contours in the right part of Fig. 3 (lower panel) suggest that their detection confidence levels are higher than 99%.
A direct spectral fitting revealed that the absorption structures at 7–7.4 keV are actually composed of two narrow (unresolved, 10 eV) absorption lines. They are detected at rest-frame energies of E keV and E keV, respectively. Their equivalent widths are EW eV and EW eV, respectively. Their detection confidence level is 99% from the F-test, which slightly reduces to 91% and 92% from Monte Carlo simulations (see §3.3). The detailed line parameters are listed in Table 3. Their energies are not consistent with any known atomic transition. However, their location in the spectrum and their energy spacing suggest a possible identification with blue-shifted resonance absorption lines from Fe XXV He (1s2–1s2p) at E6.697 keV and Fe XXVI Ly (1s–2p) at E6.966 keV. Their corresponding blue-shifted velocities are substantial and consistent one with each other, i.e. c and c, respectively.
The second absorption structure that is observed at the energy of E8–9 keV is broad. If modeled with a simple inverted Gaussian, the resultant rest-frame energy is E keV, with a broadening of eV and equivalent width of EW eV. Its detection confidence level is 99.9% from the F-test and slightly reduces to 99.8% with Monte Carlo simulations (see Table 3). Also in this case the energy of the line is not consistent with any known atomic transition. However, from the identification of two previous absorption lines, we can infer the possible presence of other resonance features from the same ionic species. In fact, the lower energy resolution of the instrument at those energies (FWHM200 eV) and the spacing with respect to the first two lines suggest this broad absorption structure could actually be a blend of at least two further narrow resonance lines, namely Fe XXV He (1s2–1s3p) at E7.88 keV and Fe XXVI Ly (1s–3p) at E8.25 keV.
To test the consistency of this global line identification, we performed a fit adding to the baseline model four narrow absorption lines with energies fixed to the expected values for these Fe XXV and Fe XXVI resonances and leaving their common energy shift as a free parameter. This provided a very good modeling of all the absorption structures at E7 keV, with a improvement of 25 (for five additional parameters). The global probability to have these four absorption lines at these exact energies simply from random fluctuations is low, about . Interestingly, their common blue-shifted velocity is , completely consistent with what derived fitting each line separately. The resultant EWs of these lines are: EW eV for the Fe XXV He, EW eV for the Fe XXV He, EW eV for the Fe XXVI Ly and EW eV for the Fe XXVI Ly. Their relative ratios are of the order of unity, which would suggest possible saturation effects.
Finally, we performed a fit using the Xstar photo-ionization grid discussed in §3.2 in order to have a more physically consistent modeling of these spectral features. The best fit parameters are reported in Table 4. We obtained a good fit with a highly ionized absorber (12 for three more parameters, required at a level of 99%) with an ionization parameter of log erg s-1 cm and a total column density of cm-2. This model simultaneously takes into account all the four absorption features we discussed previously. The resultant blue-shifted velocity is c, completely consistent with the value estimated by fitting the lines with simple inverted Gaussians. Given the high ionization level of this absorbing material, no other significant signatures are expected at lower energies as all the elements lighter than iron are almost completely ionized.
The conclusion that the detected absorption features are actually due to Fe XXV and Fe XXVI resonant lines is well represented in Fig. 4. Here we can see the best fit baseline model composed of a power-law continuum and a neutral Fe K emission line and the superimposed modeling of the absorption structures with two narrow and one broad inverted Gaussians or with the physically self-consistent Xstar photo-ionization code. The plot shows that the two models are completely coincident up to the first two narrow absorption lines (identified as blue-shifted Fe XXV He and Fe XXVI Ly) and clearly demonstrates that the broad absorption structure at the higher energy is actually composed by several narrow resonant lines from the same ionic species (i.e. mainly Fe XXV He and Fe XXVI Ly) which appear to be blended together due to the lower instrumental resolution and signal-to-noise in this energy band (this is similar to the conclusion drawn for 3C 111 in § A.1).
We also checked for variability of the blue-shifted Fe K absorption lines between observations 3C 120a and 3C 120b. We added three absorption lines to the base line model of observation 3C 120a, with energies and widths fixed to those of observation 3C 120b, and calculated the 90% lower limits on the equivalent widths. The values are reported in Table 3. Unfortunately, the lower S/N in observation 3C 120a alone does not allow us to affirm that the lack of absorption lines in this observation was due to temporal variability.
The consistency of the results from a broad-band XISPIN spectral analysis is presented in §4.2. Instead, in Appendix B we discuss the XIS-FI instrumental background, the consistency of the blue-shifted absorption lines parameters among the different XIS cameras (see Table 5) and their possible alternative identifications.
A.4 3C 382
The 3.5–10.5 keV XIS-FI spectrum of 3C 382 is well represented by a power-law continuum (with ) plus a narrow neutral Fe K emission line at E6.4 keV and a further weak narrow emission line at E6.9 keV (see Table 2). A broad-band spectral analysis of this Suzaku data set will be reported in Ballo et al. (2010, in prep.). From the spectral ratio and the energy-intensity contour plots of Fig. 5 (left panel) it can be seen that an additional narrow weak emission line at the rest-frame energy of 7 keV is observable (we refer the reader to Ballo et al. 2010, in prep.). However, there are no significant absorption structures at energies 7 keV. We estimated the lower limit for the presence of a narrow blue-shifted absorption line at the indicative energy of 8 keV to be EW eV (see Table 3).
A.5 3C 445
The 3.5–10.5 keV XIS-FI spectrum of 3C 445 is affected by substantial absorption by neutral/mildly-ionized material intrinsic to the AGN. The baseline model is composed by a power-law continuum (with ) absorbed by neutral material ( cm-2) and a narrow neutral Fe K emission line at 6.4 keV (see Table 2). The broad-band spectral analysis of this Suzaku data set will be reported in Braito et al. (2010, in prep.). From the spectral ratios and the energy-intensity contour plots of Fig. 5 (right panel) there is indication for a possible narrow weak emission feature red-ward to the Fe K line (we refer the reader to Braito et al. 2010, in prep.). We estimated the lower limit for the presence of a narrow blue-shifted absorption line at the indicative energy of 8 keV to be EW eV (see Table 3).
Appendix B XIS-FI background and consistency checks
The background level for these bright sources in the 7–10 keV band is negligible, always less than 10% of the source counts (see Table 1). However, it is important to note that the XIS cameras have a few instrumental background emission lines at energies greater than 7 keV, the most intense of which is the Ni K at E7.47 keV (Yamaguchi et al. 2006). These lines originate from the interaction of the cosmic rays with the sensor housing and electronics and this also causes their intensity to be slightly dependent on the location on the detector. Therefore, the selection of the background on a region of the CCD where the intensity of the lines is slightly higher/lower than that of those actually on the source extraction region can possibly induce spurious absorption/emission lines in the background subtracted spectrum. We performed some tests to check this possibility.
First, since the XIS background emission lines are present at specific energies (see Table 1 of Yamaguchi et al. 2006), we checked that the observed energies of the absorption lines are indeed not consistent with those values (see Table 3). If the background is not subtracted from the source spectrum, these lines would show up as weak emission lines. Secondly, we then checked that the intensity of the emission lines in the background and in the source spectrum without background subtraction are indeed consistent. Thirdly, and finally, we inspected that the values of the energy and equivalent width of the absorption lines at E7 keV in the source spectrum (see Table 3) are consistent (within the 1 errors) with or without background subtraction. These tests assure that our results on the absorption lines detected in the 7–10 keV band are indeed not affected by any contamination from the XIS instrumental background.
In Table 5 we report a consistency check of the absorption lines detected in 3C 111, 3C 390.3 and 3C 120b among the different XIS instruments. The values have been derived by independently fitting the XIS 0, XIS 2 (when available), XIS 3 and XIS-BI spectra. The lower S/N of the separate XIS spectra does not allow to clearly detect the absorption lines in each spectrum. However, the parameters are always consistent with those reported in Table 3. Moreover, it is worth mentioning that in 3C 111 the blue-shifted Fe K absorption lines are detected independently in both of the XIS-FI CCDs (i.e. XIS 0 and 3), as shown in Table 5. This demonstrates that the line parameters derived from the different instruments are indeed consistent one with each other and assures the absence of any systematics induced by the combination of the XIS-FI spectra.
The search for narrow absorption lines in the 7–10 keV energy band could be complicated by the presence of ionized Fe K edges at energies in the range from E7.1 keV to E9.3 keV, depending on the ionization state of iron (from neutral to H-like). Hence, one could object that some of the spectral structures we identified as blue-shifted absorption lines could actually be interpreted equally as well by ionized Fe K edges. As a sanity check, we tested that the alternative modelling of the Gaussian absorption lines with simple sharp absorption edges (zedge in XSPEC) did not significantly improve the spectral fits, as expected from the narrowness of the observed spectral features. Moreover, it is important to note that the commonly held view of sharp Fe K edges is an oversimplification of the real process and could lead to misleading results. In fact, it has been demonstrated that if the adequate treatment of the decay pathways of resonances converging to the K threshold is properly taken into account, the resulting edges are not sharp but smeared and broadened (e.g., Palmeri et al. 2002; Kallman et al. 2004). This effect can be negligible for neutral or extremely ionized iron (He/H-like) but is quite relevant for intermediate states (with energies in the range E7.2–9 keV). Intense Fe K resonance absorption lines from different ionization states would be expected to accompany the edges. Moreover, a proper characterization of the possible Fe K edges has already been taken into account when modeling the absorption features with the photo-ionization code Xstar.
Finally, it is worth noting that even if the cosmic abundance of nickel is negligible with respect to that of iron (5%, from Grevesse et al. 1996), the K-shell transitions of this element are distributed at energies greater than 7 keV and could, in principle, complicate our line identification. However, contamination by mildly ionized Ni K lines is very unlikely, as it would require extremely high column densities (– cm-2) for these lines to be intense enough to be observable, which would consequently generate strong absorption lines and edges from all the other lighter elements as well.
The only possible contamination could be due to He/H-like Ni, whose 1s–2p transitions are at rest-frame energies of E7.8 keV and E8.1 keV, respectively. Also in this case the column densities required to have lines with measurable intensities would be extremely high (– cm-2). However, the very high ionization level required to have significant columns of these ions are so extreme (log6 erg s-1 cm) that all the lighter elements would be completely ionized, with iron being the only possible exception, and therefore they will not contribute with other absorption features. We found that only the absorption line detected in 3C 390.3 at the energy of E8.11 keV could be associated with rest-frame absorption from H-like Ni (see Table 3). If this unlikely identification is correct, it would indicate the presence of an extremely Compton-thick, extremely ionized and static absorber in the central regions of this BLRG. However, we state that the consistency of the line energy with H-like Ni is most probably only a mere coincidence. This is strengthened by the fact that none of the other lines detected at E7 keV have energies consistent with those from highly ionized nickel. The same conclusion has been reached also by Tombesi et al. (2010) who performed a systematic search for blue-shifted Fe K absorption lines in a large sample of radio-quiet AGN observed with XMM-Newton.
References
- Bianchi et al. (2005) Bianchi, S., Matt, G., Nicastro, F., Porquet, D., & Dubau, J. 2005, MNRAS, 357, 599
- blustin (2005) Blustin, A. J., Page, M. J., Fuerst, S. V., Branduardi-Raymont, G., & Ashton, C. E. 2005, A&A, 431, 111
- Braito (2007) Braito, V., et al. 2007, ApJ, 670, 978
- Cappi (2006) Cappi, M. 2006, Astronomische Nachrichten, 327, 1012
- cappi (2009) Cappi, M., et al. 2009, A&A, 504, 401
- Chartas et al. (2002) Chartas, G., Brandt, W. N., Gallagher, S. C., & Garmire, G. P. 2002, ApJ, 579, 169
- Chartas et al. (2003) Chartas, G., Brandt, W. N., & Gallagher, S. C. 2003, ApJ, 595, 85
- crenshaw (1999) Crenshaw, D. M., Kraemer, S. B., Boggess, A., Maran, S. P., Mushotzky, R. F., & Wu, C.-C. 1999, ApJ, 516, 750
- dadina (2005) Dadina, M., Cappi, M., Malaguti, G., Ponti, G., & de Rosa, A. 2005, A&A, 442, 461
- Dickey & Lockman (1990) Dickey, J. M., & Lockman, F. J. 1990, ARA&A, 28, 215
- Elvis (2000) Elvis, M. 2000, ApJ, 545, 63
- Elvis (2006) Elvis, M. 2006, Memorie della Societa Astronomica Italiana, 77, 573
- Eracleous & Halpern (1998) Eracleous, M., & Halpern, J. P. 1998, ApJ, 505, 577
- Fabian (2009) Fabian, A. C. 2009, arXiv:0912.0880
- ferrarese (2000) Ferrarese, L., & Merritt, D. 2000, ApJ, 539, L9
- Ghisellini et al. (2004) Ghisellini, G., Haardt, F., & Matt, G. 2004, A&A, 413, 535
- Grevesse et al. (1996) Grevesse, N., Noels, A., & Sauval, A. J. 1996, Cosmic Abundances, 99, 117
- Güdel et al. (2007) Güdel, M., et al. 2007, A&A, 468, 353
- Haardt & Maraschi (1991) Haardt, F., & Maraschi, L. 1991, ApJ, 380, L51
- Kalberla et al. (2005) Kalberla, P. M. W., Burton, W. B., Hartmann, D., Arnal, E. M., Bajaja, E., Morras, R., Pöppel, W. G. L. 2005, A&A, 440, 775
- kallman (2001) Kallman, T., & Bautista, M. 2001, ApJS, 133, 221
- Kallman et al. (2004) Kallman, T. R., Palmeri, P., Bautista, M. A., Mendoza, C., & Krolik, J. H. 2004, ApJS, 155, 675
- Kataoka et al. (2007) Kataoka, J., et al. 2007, PASJ, 59, 279
- king (2003) King, A. R., & Pounds, K. A. 2003, MNRAS, 345, 657
- King (2010) King, A. R. 2010, MNRAS, 402, 1516
- Koyama et al. (2007) Koyama, K., et al., 2007, PASJ, 59, 23
- Low (1996) Low, B. C. 1996, Sol. Phys., 167, 217
- Marchesini et al. (2004) Marchesini, D., Celotti, A., & Ferrarese, L. 2004, MNRAS, 351, 733
- markowitz (2006) Markowitz, A., Reeves, J. N., & Braito, V. 2006, ApJ, 646, 783
- Marscher et al. (2002) Marscher, A. P., Jorstad, S. G., Gómez, J.-L., Aller, M. F., Teräsranta, H., Lister, M. L., & Stirling, A. M. 2002, Nature, 417, 625
- (31) McKernan, B., Yaqoob, T., George, I. M., & Turner, T. J. 2003, ApJ, 593, 142 (McKernan et al. 2003a)
- McKernan et al. (2003) McKernan, B., Yaqoob, T., Mushotzky, R., George, I. M., & Turner, T. J. 2003, ApJ, 598, L83 (McKernan et al. 2003b)
- mckernan (2004) McKernan, B., Yaqoob, T., & Reynolds, C. S. 2004, ApJ, 617, 232
- mckernan (2005) McKernan, B., Yaqoob, T., & Reynolds, C. S. 2005, MNRAS, 361, 1337
- mckernan (2007) McKernan, B., Yaqoob, T., & Reynolds, C. S. 2007, MNRAS, 379, 1359
- Miller et al. (2007) Miller, L., Turner, T. J., Reeves, J. N., George, I. M., Kraemer, S. B., & Wingert, B. 2007, A&A, 463, 131
- miniutti (2006) Miniutti, G., & Fabian, A. C. 2006, MNRAS, 366, 115
- miniutti (2007) Miniutti, G., Ponti, G., Dadina, M., Cappi, M., & Malaguti, G. 2007, MNRAS, 375, 227
- Mitsuda et al. (2007) Mitsuda, K., et al., 2007, PASJ, 59, 1
- Neilsen & Lee (2009) Neilsen, J., & Lee, J. C. 2009, Nature, 458, 481
- ohsuga (2009) Ohsuga, K., Mineshige, S., Mori, M., & Kato, Y. 2009, PASJ, 61, L7
- palmeri (2002) Palmeri, P., Mendoza, C., Kallman, T. R., & Bautista, M. A. 2002, ApJ, 577, L119
- Peterson et al. (2004) Peterson, B. M., et al. 2004, ApJ, 613, 682
- porquet (2004) Porquet, D., Reeves, J. N., Uttley, P., & Turner, T. J. 2004, A&A, 427, 101
- pounds (2003) Pounds, K. A., Reeves, J. N., King, A. R., Page, K. L., O’Brien, P. T., & Turner, M. J. L. 2003, MNRAS, 345, 705
- pounds (2006) Pounds, K. A., & Page, K. L. 2006, MNRAS, 372, 1275
- Pounds & Reeves (2009) Pounds, K. A., & Reeves, J. N. 2009, MNRAS, 397, 249
- Proga & Kallman (2004) Proga, D., & Kallman, T. R. 2004, ApJ, 616, 688
- protassov (2002) Protassov, R., van Dyk, D. A., Connors, A., Kashyap, V. L., & Siemiginowska, A. 2002, ApJ, 571, 545
- Rawlings & Saunders (1991) Rawlings, S., & Saunders, R. 1991, Nature, 349, 138
- reeves (2008) Reeves, J., Done, C., Pounds, K., Terashima, Y., Hayashida, K., Anabuki, N., Uchino, M., & Turner, M. 2008, MNRAS, 385, L108
- Reeves et al. (2009a) Reeves, J. N., et al. 2009, ApJ, 701, 493 (Reeves et al. 2009a)
- Reeves et al. (2009b) Reeves, J. N., Sambruna, R. M., Braito, V., & Eracleous, M. 2009, ApJ, 702, L187 (Reeves et al. 2009b)
- Risaliti et al. (2005) Risaliti, G., Bianchi, S., Matt, G., Baldi, A., Elvis, M., Fabbiano, G., & Zezas, A. 2005, ApJ, 630, L129
- Sambruna et al. (1999) Sambruna, R. M., Eracleous, M., & Mushotzky, R. F. 1999, ApJ, 526, 60
- Sambruna et al. (2007) Sambruna, R. M., Reeves, J. N., & Braito, V. 2007, ApJ, 665, 1030
- Sambruna et al. (2009) Sambruna, R. M., et al. 2009, ApJ, 700, 1473
- schurch (2009) Schurch, N. J., Done, C., & Proga, D. 2009, ApJ, 694, 1
- Sim et al. (2008) Sim, S. A., Long, K. S., Miller, L., & Turner, T. J. 2008, MNRAS, 388, 611
- Sim et al. (2010) Sim, S. A., Miller, L., Long, K. S., Turner, T. J., & Reeves, J. N. 2010, MNRAS, 354
- Spergel et al. (2003) Spergel, D. N., et al. 2003, ApJS, 148, 175
- Tarter et al. (1969) Tarter, C. B., Tucker, W. H., & Salpeter, E. E. 1969, ApJ, 156, 943
- tombesi (2009) Tombesi, F., Cappi, M., Yaqoob, T., Reeves, J., & Palumbo, G. G. C. 2009, arXiv:0910.0654
- Tombesi et al. (2010) Tombesi, F., Cappi, M., Reeves, J. N., Palumbo, G. G. C., Yaqoob, T., Braito, V., & Dadina, M. 2010, arXiv:1006.2858
- Torresi et al. (2009) Torresi, E., Grandi, P., Longinotti, A. L., Guainazzi, M., Palumbo, G. G. C., Tombesi, F., & Nucita, A. 2009, MNRAS, L348
- Ungerer et al. (1985) Ungerer, V., Nguyen-Quang-Rieu, Mauron, N., & Brillet, J. 1985, A&A, 146, 123
- vaughan (2008) Vaughan, S., & Uttley, P. 2008, MNRAS, 390, 421
- Yamaguchi et al. (2006) Yamaguchi, H., et al. 2006, Proc. SPIE, 6266
- yaqoob (2005) Yaqoob, T., & Serlemitsos, P. 2005, ApJ, 623, 112
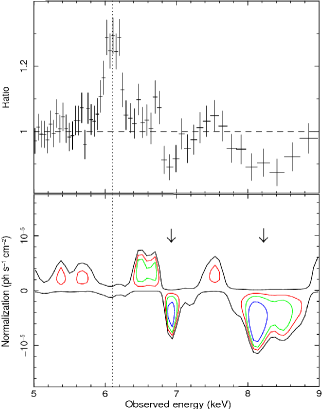
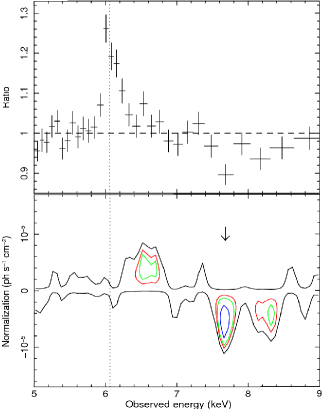


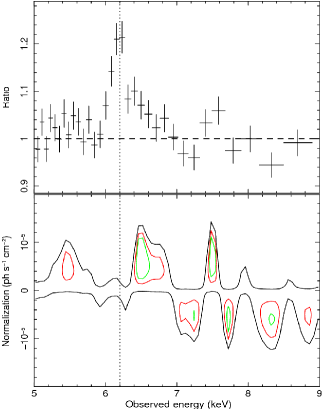
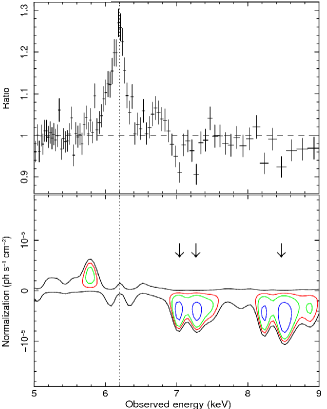

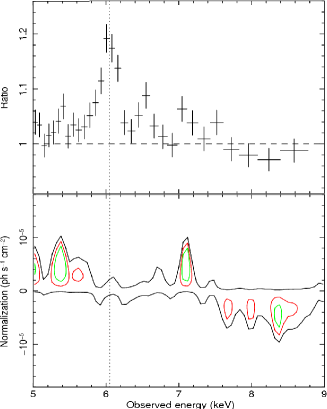
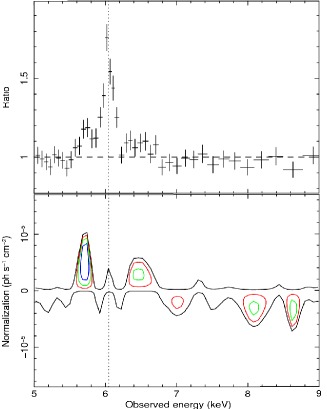
| Source | OBSID | Date | Net Expo | Flux | Source/Bkgd | ||
|---|---|---|---|---|---|---|---|
| ( cm-2) | (ks) | ( erg s-1 cm-2) | ( cts) | ||||
| 3C 111 | 0.0485 | 30.0 | 703034010aaFor the XIS 0 and XIS 3 cameras combined. | 2008-08-22 | 109 | 1.3 | 9.2/0.6 |
| 3C 390.3 | 0.0561 | 3.8 | 702125010aaFor the XIS 0 and XIS 3 cameras combined. | 2007-04-27 | 85 | 2.0 | 13.3/0.5 |
| 3C 120a | 0.0330 | 11.0 | 700001010bbFor the XIS 0, XIS 2 and XIS 3 cameras combined. | 2006-02-09 | 42 | 2.9 | 13.8/0.3 |
| 3C 120bccThese observations have been added together in 3C 120b. | 0.0330 | 11.0 | 700001020bbFor the XIS 0, XIS 2 and XIS 3 cameras combined. | 2006-02-16 | 42 | 2.6 | 12.5/0.3 |
| 3C 120bccThese observations have been added together in 3C 120b. | 0.0330 | 11.0 | 700001030bbFor the XIS 0, XIS 2 and XIS 3 cameras combined. | 2006-02-23 | 41 | 2.6 | 12.2/0.3 |
| 3C 120bccThese observations have been added together in 3C 120b. | 0.0330 | 11.0 | 702125010bbFor the XIS 0, XIS 2 and XIS 3 cameras combined. | 2006-03-02 | 41 | 2.5 | 11.7/0.3 |
| 3C 382 | 0.0579 | 7.4 | 701060010aaFor the XIS 0 and XIS 3 cameras combined. | 2006-12-14 | 116 | 2.5 | 21.2/0.5 |
| 3C 445 | 0.0562 | 4.8 | 702056010aaFor the XIS 0 and XIS 3 cameras combined. | 2007-05-25 | 108 | 0.7 | 13.8/0.3 |
Note. — Column 1: source name. Column 2: cosmological red-shift. Column 3: neutral Galactic absorption column density. Column 4: observation ID. Column 5: starting date of the observation (in year-month-day). Column 6: net exposure for each XIS. Column 7: flux in the 4–10 keV band. Column 8: total source/background counts in the 7–10 keV band.
| Source | E | EW | ||||
|---|---|---|---|---|---|---|
| ( cm-2) | (keV) | (eV) | (eV) | |||
| 3C 111 | 412/427 | |||||
| 3C 390.3 | 466/450 | |||||
| 3C 120a | 1386/1393 | |||||
| 3C 120b | 1743/1707 | |||||
| 3C 382 | 1490/1516 | |||||
| 10aaParameter held fix during the fit. | ||||||
| 3C 445 | 416/391 |
Note. — Column 1: source name. Column 2: power-law photon index. Column 3: equivalent Hydrogen column density due to neutral absorption intrinsic to the source, if present. Column 4: rest-frame energy of the Gaussian emission line. Column 5: line width. Column 6: equivalent width. Column 7: ratio between best fit and degrees of freedom. Errors are at the 1 level.
| Source | ID | E | EW | F-test | MC | |||
|---|---|---|---|---|---|---|---|---|
| (keV) | (eV) | (eV) | ||||||
| 3C 111 | Ly | 10aaParameter held fix during the fit. | 13/2 | 359/422 | 99.9% | 99% | ||
| Ly-Ly-Ly | 40/3 | 99.9% | 99.9% | |||||
| 3C 390.3 | Ly | 10aaParameter held fix during the fit. | 14.6/2 | 451/448 | 99.9% | 99.5% | ||
| 3C 120a | 7.25aaParameter held fix during the fit. | 10aaParameter held fix during the fit. | bbEquivalent width lower limit at the 90% level. | |||||
| 7.54aaParameter held fix during the fit. | 10aaParameter held fix during the fit. | bbEquivalent width lower limit at the 90% level. | ||||||
| 8.76aaParameter held fix during the fit. | 360aaParameter held fix during the fit. | bbEquivalent width lower limit at the 90% level. | ||||||
| 3C 120b | He | 10aaParameter held fix during the fit. | 9.4/2 | 1705/1700 | 99% | 91% | ||
| Ly | 10aaParameter held fix during the fit. | 10/2 | 99.3% | 92% | ||||
| He-Ly | 18/3 | 99.9% | 99.8% | |||||
| 3C 382 | 8aaParameter held fix during the fit. | 10aaParameter held fix during the fit. | bbEquivalent width lower limit at the 90% level. | |||||
| 3C 445 | 8aaParameter held fix during the fit. | 10aaParameter held fix during the fit. | bbEquivalent width lower limit at the 90% level. |
Note. — Column 1: source name. Column 2: absorption line identification, He/He refer to K-shell transitions from Fe XXV, Ly/Ly/Ly/Ly refer to the Fe XXVI Lyman series and the “-” indicates a possible line blending (see text for more details). Column 3: absorption line rest-frame (observer frame) energy. Column 4: line width. Column 5: line equivalent width. Column 6: improvement adding the absorption line to the baseline model reported in Table 2 and relative number of new parameters. Column 7: ratio between the best fit and degrees of freedom after the inclusion of the Gaussian absorption lines. Column 8: detection confidence level from the F-test. Column 9: detection confidence level from extensive Monte Carlo simulations. Errors are at the 1 level.
| Source | log | |||
|---|---|---|---|---|
| (erg s-1 cm) | ( cm-2) | (c) | ||
| 3C 111 | aaLower limit at the 90% level. | 390/424 | ||
| 3C 390.3 | aaLower limit at the 90% level. | 452/447 | ||
| 3C 120b | 1731/1704 |
Note. — Column 1: source name. Column 2: ionization parameter. Column 3: equivalent Hydrogen column density of the ionized absorber. Column 4: blue-shifted (outflow) velocity. Column 5: ratio between the best fit and degrees of freedom after the inclusion of the Xstar model. Errors are at the 1 level.
| Source | Inst | E | EW | |
|---|---|---|---|---|
| (keV) | (eV) | (eV) | ||
| 3C 111 | XIS 0 | 10 | ||
| XIS 3 | 10 | |||
| XIS-BI | 7.26aaParameter held fix during the fit. | 10 | bbEquivalent width lower limit at the 90% level. | |
| 8.69aaParameter held fix during the fit. | 390aaParameter held fix during the fit. | bbEquivalent width lower limit at the 90% level. | ||
| 3C 390.3 | XIS 0 | 10 | bbEquivalent width lower limit at the 90% level. | |
| XIS 3 | 10 | |||
| XIS-BI | 8.11aaParameter held fix during the fit. | 10 | bbEquivalent width lower limit at the 90% level. | |
| 3C 120b | XIS 0 | 10 | bbEquivalent width lower limit at the 90% level. | |
| 10 | bbEquivalent width lower limit at the 90% level. | |||
| XIS 2 | 10 | bbEquivalent width lower limit at the 90% level. | ||
| 10 | bbEquivalent width lower limit at the 90% level. | |||
| XIS 3 | 10 | bbEquivalent width lower limit at the 90% level. | ||
| 10 | bbEquivalent width lower limit at the 90% level. | |||
| 8.76aaParameter held fix during the fit. | 360aaParameter held fix during the fit. | bbEquivalent width lower limit at the 90% level. | ||
| XIS-BI | 7.25aaParameter held fix during the fit. | 10 | bbEquivalent width lower limit at the 90% level. | |
| 7.54aaParameter held fix during the fit. | 10 | bbEquivalent width lower limit at the 90% level. | ||
| 8.76aaParameter held fix during the fit. | 360aaParameter held fix during the fit. | bbEquivalent width lower limit at the 90% level. |
Note. — Column 1: source name. Column 2: Suzaku instrument; broad stands for broad band fit, using both XIS-FI and PI. Column 3: Absorption line rest-frame energy. Column 4: line width. Column 5: line equivalent width. Errors are at the 1 level.