The Pulsation of AGB Stars in the Magellanic Cloud Clusters NGC 1978 and NGC 419
Abstract
The intermediate-age Magellanic Cloud clusters NGC 1978 and NGC 419 are each found to contain substantial numbers of pulsating AGB stars, both oxygen-rich and carbon-rich. Each cluster also contains two pulsating asymptotic giant branch (AGB) stars which are infrared sources with a large mass loss rate. Pulsation masses have been derived for the AGB variables, from the lowest luminosity O-rich variables to the most evolved infrared sources. It is found that the stars in NGC 1978 have a mass of 1.55 early on the AGB while the NGC 419 stars have a mass of 1.87 early on the AGB. These masses are in good agreement with those expected from the cluster ages determined by main-sequence turnoff fitting. Nonlinear pulsation models fitted to the highly evolved AGB stars show that a substantial amount of mass loss has occurred during the AGB evolution of these stars. An examination of the observed mass loss on the AGB, and the AGB tip luminosities, shows that in both clusters the mass loss rates computed from the formula of Vassiliadis & Wood (1993) reproduce the observations reasonably well. The mass loss rates computed from the formula of Blöcker (1995) terminate the AGB in both clusters at a luminosity which is much too low.
keywords:
stars: AGB and post-AGB – stars: mass loss – stars: variables: general – galaxies: Magellanic clouds – galaxies: star clusters : NGC 1978, NGC 419.1 Introduction
Star clusters are ideal sites to test the theories of stellar evolution, mass loss and pulsation. They contain a rather homogeneous sample of stars with well constrained parameters such as mass, metallicity, age, distance and luminosity. Furthermore, the star clusters associated with the Magellanic Clouds span a wide range of age, which enables us to study the evolution of stars with various masses. Owing to the relatively large numbers of stars in many of the star clusters in the Magellanic Clouds they are suitable for studying the short-lived later stages of stellar evolution. In this paper we target two intermediate age clusters, the Large Magellanic Cloud (LMC) cluster NGC 1978 and the Small Magellanic Cluster (SMC) cluster NGC 419. These two clusters are the only ones in the Magellanic Clouds which are known to have AGB stars with extremely high mass loss rates. Each cluster has one star that was first detected by the ISOCAM survey as a mid-IR source (Tanabé et al. 1998) as well as one slightly less extreme star found first in the near-IR (Tanabé et al. 1997). The clusters also have many other less extreme, but pulsating, AGB stars.
Our aim here is to use the pulsation properties of the AGB stars in these clusters to derive accurate mass estimates for the cluster AGB stars and to thereby study mass loss along the AGB. This mass loss along the AGB can then be compared with that expected from mass loss laws commonly used in stellar evolution calculations.
The cluster NGC 1978 is a massive ( , Westerlund 1997) and luminous red globular cluster in the LMC. It has a rather high ellipticity (, Fischer et al. 1992; Mucciarelli et al. 2007) suggesting it may be the result of the merger of two clusters. The cluster is found to contain oxygen-rich (M-type) stars with C/O 1 in the stellar atmosphere and carbon-rich (C-type) stars with C/O 1 (e.g. Frogel et al. 1990). Ferraro et al. (2006) derived a cluster metal abundance [Fe/H] = -0.38 dex and noted that there was no evidence for a significant dispersion in abundance between stars ( dex). Olszewski et al. (1991) derived [Fe/H] = -0.420.04 dex. However, Hill et al. (2000) derived a significantly lower abundance ([Fe/H] = -0.960.15) dex. This value has not been reproduced by any other group (we will assume [Fe/H] = -0.4, corresponding to Z 0.008, in our pulsation models). In a recent work, Mucciarelli et al. (2007) used Hubble Space Telescope (HST) observations, along with a distance modulus to the LMC of 18.50 and reddening of E(B-V) = 0.09, to determine the age of this cluster to be Gyr when using isochrones from Pisa Evolutionary Library (Castellani et al. 2003) with , consistent with the determinations of the cluster metallicity. Bomans, Vallenari & de Boer (1995) derived an age of 2.2 Gyr for NGC 1978, and found no evidence for age variation within the cluster (they assumed a distance modulus of 18.50, E(B-V) = 0.08 and a metallicity of [Fe/H] = -0.4). The homogeneous nature of the isochrone of NGC 1978 is confirmed by the HST study of Milone et al. (2009). The age determined for NGC 1978 (1.9 to 2.2 Gyr) corresponds to an initial mass for stars at the beginning of the thermally pulsing AGB (TPAGB) of 1.54 to 1.62 according to the isochrones of Girardi et al. (2000) with metallicity . These isochrones were derived from stellar evolution models that included a scaled Reimers mass loss law. The mass estimated at the beginning of the TPAGB for stars of age 1.9 to 2.2 Gyr is 1.44 to 1.53 .
The cluster NGC 419 is one of the brightest intermediate age globular clusters in the SMC. Recent deep HR-diagrams obtained with the HST show that NGC 419 has a broad main-sequence turnoff which is interpreted as the result of multiple star formation events or extended star formation (Glatt et al. 2008; Girardi et al. 2009; Rubele et al. 2009). The metallicity of NGC 419 was determined from calcium triplet of observations by Kayser et al. (2009) to be close to [Fe/H] = -0.7, corresponding to a metallicity of . Fits to the HR-diagrams yield ages of 1.2–1.6 Gyr (Glatt et al. 2008), 1.3–1.5 Gyr (Girardi et al. 2009) or 1.2–1.8 Gyr (Rubele et al. 2009). If we adopt ages of 1.40.2 Gyr, then the isochrones of Girardi et al. (2000) with a metallicity of yield an initial mass for stars at the beginning of the TPAGB of 1.820.15 and a current mass (as a result of mass loss via a scaled Reimers law) of 1.790.15 . The two red giant clumps observed in NGC 419 were shown by Girardi et al. (2009) to be the result of the mass range of red giant stars in the cluster spanning the critical mass (1.9 ) which separates those stars that do, or do not, develop electron-degenerate cores on entering the red giant branch. The distance moduli derived by Glatt et al. (2008) and Rubele et al. (2009) are 18.83 and 18.84, respectively, and both estimated the reddening as E(B-V) = 0.11.
2 Observational Data
| Ident | MACHO | RA (J2000) DEC | SpT | |||||||
|---|---|---|---|---|---|---|---|---|---|---|
| LE3 | 64.7844.15 | 5 28 44.4 | -66 14 04 | 16.40 | 14.21 | 11.08 | 10.34 | 9.70 | 8.99 | C |
| LE6 | 64.7844.16 | 5 28 46.2 | -66 13 56 | 15.80 | 14.33 | 12.21 | 11.17 | 10.81 | 10.37 | C |
| LE4 | 64.7844.18 | 5 28 43.7 | -66 14 04 | 15.93 | 14.54 | 12.49 | 11.58 | 11.34 | 11.21 | M |
| B | 64.7844.20 | 5 28 43.6 | -66 14 09 | 16.24 | 14.74 | 12.38 | 11.45 | 11.17 | 10.89 | C |
| LE5 | 64.7844.23 | 5 28 43.5 | -66 13 53 | 16.19 | 14.92 | 12.57 | 11.67 | 11.47 | 11.31 | M |
| IR1 | 64.7844.416 | 5 28 40.2 | -66 13 54 | 0.00 | 17.47 | 14.93 | 13.03 | 11.16 | 9.01 | C |
| A | 64.7845.14 | 5 28 46.1 | -66 13 25 | 15.54 | 14.13 | 12.25 | 11.34 | 11.14 | 10.97 | M |
| LE11 | 64.7845.20 | 5 28 43.6 | -66 14 09 | 16.44 | 14.83 | 12.84 | 11.95 | 11.56 | 11.09 | C |
| LE1 | 64.7965.15 | 5 28 48.4 | -66 15 00 | 16.62 | 14.75 | 12.13 | 10.97 | 10.35 | 0.00 | C |
| LE8 | 64.7965.16 | 5 28 48.4 | -66 14 39 | 16.12 | 14.82 | 13.02 | 12.15 | 11.95 | 11.73 | M |
| LE7 | 64.7965.22 | 5 28 47.8 | -66 14 44 | 16.55 | 14.83 | 12.54 | 11.50 | 11.16 | 10.67 | C |
| LE2 | 64.7965.26 | 5 28 48.5 | -66 15 18 | 17.12 | 15.11 | 12.87 | 11.69 | 11.20 | 0.00 | C |
| MIR1 | 5 28 47.1 | -66 14 14 | 0.00 | 0.00 | 15.96 | 14.63 | 12.67 | 9.77 | C | |
In order to look for periodic variations of the AGB variables in the two clusters NGC 1978 and NGC 419, the light curves of stars within 1.5 arcminutes of cluster centers were analysed. For the LMC cluster NGC 1978, data were extracted from the Massive Compact Halo Object (MACHO) survey (B, R bands) (Alcock et al. 1997) and twelve AGB variables were found. This does not include the mid-IR source NGC 1978 MIR1 which was not detected by the MACHO observations. Nineteen AGB variables were found in the SMC cluster NGC 419 using light curve data from the Optical Gravitational Lensing Experiment OGLE II (V, I bands) database (Żebruń et al. 2001), supplemented with some OGLE III data. The mid-IR source NGC 419 MIR1 was not detected by the OGLE observations.
Figures 1 and 3 show the MACHO and OGLE light curves of the variables in NGC 1978 and NGC 419, respectively, while Table 1 and Table 2 provide parameters of the variables. In these tables, the candidates with LE numbers were identified with the AGB stars found by Lloyd Evans (1980). The near-IR (IR1) and the mid-IR (MIR1) variables in both the clusters are the two very red stars with an IR excess. The two stars A and B in NGC 1978 follow the naming from Lederer et al (2009). The star ADQR1 in NGC 419 comes from Azzopardi et al. (1986).
In order to determine periods for the two MIR sources, as well as to obtain accurate mean near-IR magnitudes for all the variables, the two clusters were monitored relatively sparsely in time over approximately 3000 days with the 2.3m telescope of the Australian National University at Siding Spring Observatory. The observations were taken using the near-IR imaging system Cryogenic Array Spectrometer/Imager (CASPIR) (McGregor et al. 1994). The observations were carried out using the filters (1.28m), (1.68m), (2.22m), and (3.59m). Mean flux-averaged photometric magnitudes in the MACHO, OGLE and near-IR bandpasses are tabulated in Table 1 and Table 2 for the AGB variables in NGC 1978 and NGC 419, respectively. The and light curves of the near-IR and mid-IR sources are shown in Figures 2 and 4.
In order to obtain the complete spectral energy distribution, the Spitzer Space Telescope (SST) Surveys, SAGE of the LMC (Meixner et al. 2006) and S3MC of the SMC (Bolatto et al. 2007) were also used to obtain photometric data covering the IRAC (3.6, 4.5, 5.8 and, 8 m) bands. Some of the stars in these two clusters were observed by Groenewegen et al. (2007) with the SST infrared spectrograph (IRS) from 5–37 m. For these stars the IRS spectra were used instead of the IRAC data in the mid-IR.
Spectral types for some of the AGB variables in our study were taken from Frogel et al. (1990). For the AGB variables without a known spectral type, spectra were obtained with the Dual Beam Spectrograph on the 2.3m telescope of the Australian National University at Siding Spring Observatory. The spectral types for the AGB variables in the clusters NGC 1978 and NGC 419 are listed in Table 1 and Table 2 respectively. The two mid-IR sources NGC 1978 MIR1 and NGC 419 MIR1 are assumed to be of spectral type C since their mid-IR spectra show features of SiC (Groenewegen et al. 2007).
| Ident | OGLE | SpT | |||||||
|---|---|---|---|---|---|---|---|---|---|
| LE16 | OGLE 010801.10-725317.1 | 0.00 | 19.50 | 15.58 | 13.96 | 12.53 | 11.08 | 0.00 | C |
| ADQR1 | OGLE 010810.31-725307.6 | 0.00 | 17.57 | 15.20 | 13.87 | 12.88 | 12.56 | 12.14 | C |
| LE20 | OGLE 010811.55-725314.7 | 0.00 | 17.15 | 14.25 | 12.56 | 11.50 | 11.00 | 10.45 | C |
| LE21 | OGLE 010812.36-725315.5 | 0.00 | 17.27 | 14.34 | 12.67 | 11.56 | 10.90 | 10.38 | C |
| IR1 | OGLE 010812.92-725243.7 | 0.00 | 0.00 | 16.13 | 13.56 | 11.74 | 10.80 | 9.21 | C |
| 5-3 | OGLE 010814.58-725356.7 | 17.89 | 16.19 | 14.21 | 12.91 | 12.14 | 11.95 | 0.00 | M |
| LE25 | OGLE 010815.63-725251.6 | 0.00 | 0.00 | 14.03 | 12.59 | 11.58 | 11.11 | 10.76 | C |
| LE24 | OGLE 010815.73-725254.3 | 0.00 | 16.26 | 14.28 | 13.15 | 12.20 | 12.02 | 11.97 | – |
| LE35 | OGLE 010817.45-725301.1 | 0.00 | 17.30 | 14.34 | 12.52 | 11.49 | 10.86 | 10.30 | C |
| LE37 | OGLE 010819.40-725312.0 | 0.00 | 16.40 | 14.27 | 12.77 | 11.85 | 11.56 | 11.33 | C |
| LE36 | OGLE 010819.80-725259.0 | 0.00 | 17.47 | 14.33 | 12.55 | 11.17 | 10.71 | 10.28 | C |
| LE27 | OGLE 010820.61-725251.7 | 19.11 | 17.17 | 14.30 | 12.52 | 11.44 | 10.89 | 10.46 | C |
| LE28 | OGLE 010821.50-725216.0 | 19.28 | 17.29 | 14.89 | 13.23 | 12.02 | 11.53 | 10.85 | C |
| LE23 | OGLE 010821.67-725302.7 | 0.00 | 16.87 | 14.29 | 12.83 | 11.72 | 11.23 | 10.82 | C |
| LE22 | OGLE 010822.23-725302.3 | 0.00 | 17.48 | 14.52 | 12.78 | 11.69 | 11.06 | 10.64 | C |
| LE29 | OGLE 010822.28-725233.5 | 19.57 | 16.91 | 14.30 | 12.74 | 11.66 | 11.24 | 10.75 | C |
| LE19 | OGLE 010823.43-725318.2 | 18.00 | 16.34 | 14.55 | 13.38 | 12.52 | 12.34 | 12.14 | M |
| 5-15 | OGLE 010823.80-725309.4 | 18.10 | 16.35 | 14.54 | 13.39 | 12.53 | 12.33 | 11.94 | M |
| LE18 | OGLE 010824.89-725256.7 | 0.00 | 18.17 | 14.70 | 12.82 | 11.60 | 10.93 | 10.21 | C |
| MIR1 | MIR 010817.47-725309.5 | 0.00 | 0.00 | 0.00 | 0.00 | 0.00 | 14.64 | 10.75 | C |
3 Light Curves and Pulsation Periods


The pulsation periods for most of the target stars in the two clusters NGC 1978 and NGC 419 were determined by analysing their MACHO and OGLE light curves. The exceptions were the near-IR and mid-IR sources in each cluster, for which the near-IR photometric observations ( and bands) were used to determine the pulsation period.
A glance at the light curves in Figures 1 and 3 shows that all the stars show semi-regular light variations with a characteristic period, and most of the stars are multi-periodic. Most of the variables have small amplitudes (0.5 magnitudes). The mid-IR and near-IR sources in each cluster have fairly large amplitudes as well as long periods (the mid-IR sources have only the and light curves shown in Figures 2 and 4).
In order to determine the periods, the light curve for each of the candidates was first visually inspected to arrive at an approximate period or periods. Once a rough estimate of the period was made, two more quantitative period estimates were made for each star. First, the light curve was analysed using the Phase Dispersion Minimization (PDM) task in IRAF and a period or periods were determined. Then the Period04111www.univie.ac.at/tops/Period04/ software, an extended version of Period98 by Sperl (1998), was used for period determination. Period04 makes multi-period Fourier fits to the light curve - a maximum of three periods was allowed in our fitting. In many cases, it is far from clear that the fit periods are real. The stellar oscillations in our stars have short coherence times and the periods often seem to vary, possibly due to changes in the envelope structure associated with convection in the stellar envelope. We have only retained periods that appear in both the Period04 and PDM analyses, as well as being stable and apparent to the eye.
For the large amplitude MIR1 and IR1 variables in each cluster, the periods were determined from Fourier fits to the and light curves (see Figures 2 and 4). Nishida et al. (2000) also derived the periods of the IR1 variables in the two clusters from K light-curves. However, owing to the relatively short interval of their data (500 days in NGC 1978 and 800 days in NGC 419), the periods measured by Nishida et al. (2000) (P = 491 days for NGC 1978 IR1 and P = 526 days for NGC 419 IR1) are rather approximate.
We also note that Nishida et al. found a mean K magnitude for NGC 1978 IR1 of 10.51, 0.62 magnitudes brighter than our mean K (11.13), while their mean K magnitude for NGC 419 IR1 is 11.10 which is 0.34 magnitudes fainter than our value (10.76). The variability of the mean K magnitude is also apparent in our long ( 3300 day) light curves. These long term trends appear to be cyclic (for example, see the light curves of LE16, LE20 and IR1 in Figure 3) and they are common features in the light curves of dust enshrouded AGB stars (e.g. Whitelock et al. 2003; Groenewegen et al. 2007). It is unclear whether these long cyclic variations are the same as those seen in less extreme AGB stars which show long secondary periods on sequence-D in the period-luminosity diagrams of variable red giants (e.g. Wood et al. 1999).
Table 3 and Table 4 give the periods determined for each of the variables. Periods that are considered uncertain are followed by a colon. A few stars, LE4 in NGC 1978 and LE16 and LE29 in NGC 419, show a dominant long secondary period, a well known feature of AGB variables. For LE23 in NGC 419, variability was detected but no period could be determined. We note that Tanabé et al. (2004) determined periods for most of the NGC 419 variables from much shorter segments of OGLE light curves (up to JD = 2452000). For stars that occur in both our study and that of Tanabé et al. (2004), the periods we determined were also found by Tanabé et al. (2004) in only 9 out of 21 cases (with period agreement to 10% or better).


4 Bolometric Magnitudes and Luminosities
| Ident | (-)0 | / | \centering\centering()⊙ = 4.72 | C/O\centering\centeringFrom Lederer et al. (2009) | MIR\centering\centeringSource of MIR data: g for Groenewegen et al. (2007) and s for the SAGE survey, Meixner et al. (2006) | ||||
| LE3 | 474 | 11.01 | 9.67 | 1.34 | 11111 | -5.394 | 3.503 | 1.50 | g |
| LE6 | 136 | 12.14 | 10.78 | 1.36 | 6688 | -4.843 | 3.499 | 1.300.10 | s |
| LE4 | 77 | 12.42 | 11.31 | 1.11 | 4613 | -4.440 | 3.551 | 0.180.03 | s |
| 654333Long Secondary Period | |||||||||
| B | 100 | 12.31 | 11.14 | 1.17 | 5019 | -4.532 | 3.538 | 1.350.10 | s |
| LE5 | 47 | 12.50 | 11.44 | 1.06 | 4024 | -4.292 | 3.562 | 0.180.05 | s |
| IR1 | 458 | 14.86 | 11.13 | — | 6988 | -4.891 | — | g | |
| A | 48 | 12.18 | 11.11 | 1.07 | 5870 | -4.702 | 3.559 | 0.230.05 | s |
| LE11 | 110 | 12.77 | 11.53 | 1.24 | 3576 | -4.164 | 3.523 | s | |
| LE1 | 196 | 12.06 | 10.32 | 1.74 | 8153 | -5.058 | 3.431 | 1.50 | s |
| LE8 | 32 | 12.95 | 11.92 | 1.03 | 2907 | -3.939 | 3.568 | s | |
| LE7 | 178 | 12.47 | 11.13 | 1.34 | 4754 | -4.473 | 3.503 | s | |
| 108: | |||||||||
| LE2 | 121 | 12.80 | 11.17 | 1.63 | 4035 | -4.295 | 3.450 | s | |
| MIR1 | 376 | 15.89 | 12.64 | — | 5488 | -4.628 | — | g |
Absolute bolometric magnitudes were obtained by assuming an LMC distance modulus of 18.54 and a SMC distance modulus of 18.93 (Keller & Wood 2006). Keller & Wood also derived a mean reddening - for the LMC and - for the SMC and we use these values. For all the AGB variables the photometry was corrected for foreground extinction using the extinction law of Cardelli et al. (1989). The bolometric luminosity was then obtained by integrating under the spectral energy distribution defined by the photometry in Table 1 and Table 2 together with SST mid-IR data from either IRAC or the IRS as noted in Tables 3 and 4. The IR1 and MIR1 stars in each cluster are of large amplitude so a correction needs to be made for the fact that they were observed only once in the mid-IR. For these stars, was computed at the time of the SST observation using the mid-IR observations and the near-simultaneous observations listed in Groenewegen et al. (2007). It was then assumed that the and the magnitude have the same amplitude of variation and the computed values of at the time of the SST observation was then corrected to the flux-mean value by using the difference between at the time of the SST observation and the mean . This correction was particularly large for NGC 419 MIR1 which was observed near minimum and needed a correction of 0.72 magnitudes. The reddening corrected photometry along with the luminosities and the bolometric magnitudes for the target stars in NGC 1978 and NGC 419 are listed in Table 3 and Table 4, respectively.
Effective temperatures were also estimated for the variable stars. For the O-rich stars in each cluster (-)0 was converted to using the transforms in Houdashelt et al. (2000a,b). For the C-rich stars, (-)0 was converted to , using the (-)0, relation from Bessell et al. (1983). These values are given in Tables 3 and 4.
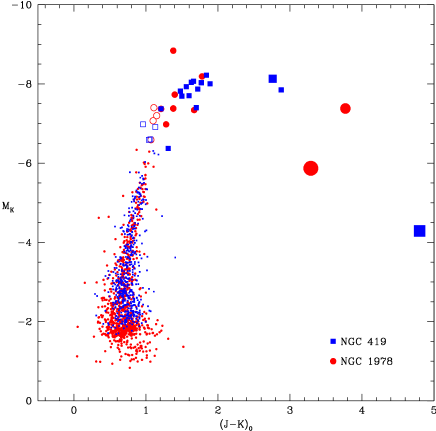
Figure 5 shows the , (-)0 diagram for variable and non-variable red giants in NGC 1978 and NGC 419. All the variables lie at the tip of the red giant branch. As expected, the C stars are redder and more luminous than the M stars in each of the two clusters. For both clusters, a distinct M to C transition can be observed at a (-). The very red, high mass loss rate stars have fainter magnitudes because most of their energy is emitted in the mid-IR, at wavelengths longer than the band.
| Ident | (-)0 | / | 000()⊙ = 4.72 | MIR000Source of MIR data: g for Groenewegen et al. (2007) and s for the S3MC survey, Bolatto et al. (2007) | ||||
| LE16 | 207 | 13.85 | 11.04 | — | 5172 | -4.564 | — | g |
| 1803000Long Secondary Period | ||||||||
| 420: | ||||||||
| ADQR1 | 62: | 13.76 | 12.52 | 1.24 | 2155 | -3.613 | 3.523 | s |
| LE20 | 151 | 12.45 | 10.96 | 1.49 | 7327 | -4.942 | 3.475 | s |
| LE21 | 163 | 12.56 | 10.86 | 1.70 | 7235 | -4.929 | 3.438 | s |
| 317 | ||||||||
| IR1 | 488 | 13.45 | 10.76 | — | 8841 | -5.146 | — | g |
| 5-3 | 40 | 12.80 | 11.91 | 0.89 | 4634 | -4.445 | 3.601 | s |
| LE25 | 133 | 12.48 | 11.07 | 1.41 | 6978 | -4.889 | 3.490 | s |
| 238: | ||||||||
| LE24 | 38 | 13.04 | 11.98 | 1.06 | 4124 | -4.318 | 3.562 | s |
| LE35 | 175 | 12.41 | 10.82 | 1.59 | 5494 | -4.630 | 3.457 | g |
| LE37 | 85 | 12.66 | 11.52 | 1.14 | 5435 | -4.618 | 3.544 | s |
| LE36 | 185 | 12.44 | 10.67 | 1.77 | 8682 | -5.127 | 3.426 | s |
| LE27 | 166: | 12.41 | 10.85 | 1.56 | 4713 | -4.463 | 3.462 | g |
| LE28 | 136: | 13.12 | 11.49 | 1.63 | 4504 | -4.414 | 3.450 | s |
| LE23 | – | 12.72 | 11.19 | 1.53 | 6188 | -4.759 | 3.467 | s |
| LE22 | 160 | 12.67 | 11.02 | 1.65 | 6223 | -4.765 | 3.446 | s |
| LE29 | 126 | 12.63 | 11.20 | 1.43 | 6369 | -4.790 | 3.486 | s |
| 658††footnotemark: | ||||||||
| LE19 | 31 | 13.27 | 12.30 | 0.97 | 3290 | -4.073 | 3.582 | s |
| 5-15 | 31 | 13.28 | 12.29 | 0.99 | 3313 | -4.080 | 3.578 | s |
| LE18 | 181 | 12.71 | 10.89 | 1.82 | 4993 | -4.526 | 3.418 | g |
| MIR1 | 738 | 0.00 | 14.60 | — | 10481 | -5.331 | — | g |
5 Linear pulsation models
For the small amplitude variables in NGC 1978 and NGC 419 we constructed static stellar models and linear non-adiabatic pulsation models which are based on the pulsation codes described in Fox & Wood (1982) and updated by Keller & Wood (2006). The core mass was obtained from the , relation of Wood & Zarro (1981). In a further update on these codes, we have used the Rosseland mean opacities computed using AESOPUS (Marigo & Aringer 2009) at temperatures below . This allowed us to construct models with different C/O ratios. We used a (solar-scaled) metallicity for the LMC cluster NGC 1978 and for the SMC cluster NGC 419.
To get the parameters for the static stellar models in each of the two clusters, we first constructed a fiducial giant branch for the non-variable AGB stars in the , diagram. Our starting point was the ,(-)0 diagram shown in Figure 5. In each cluster, the non-variable stars are all O-rich and and (-)0 were converted to (/ ) and using the transforms in Houdashelt et al. (2000a,b). By adjusting the mixing length in the convection theory, the static models were made to match the observed non-variable AGB in each cluster i.e. the observed of the O-rich stars on the AGB was reproduced. The mixing length was then kept constant for higher luminosity models, both O- and C-rich models, and linear and nonlinear.
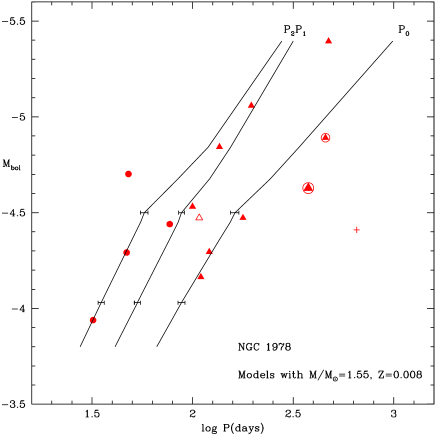
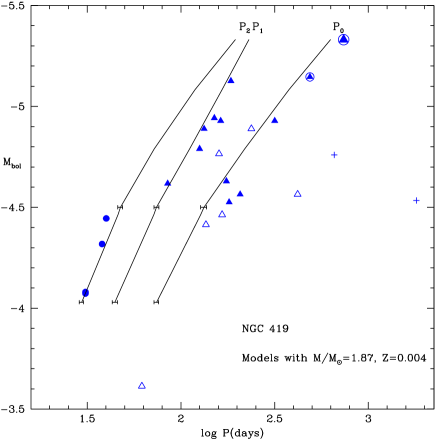
A significant uncertainty in our models is the C/O ratio to be used. We started with a C/O 0.30 low on the AGB for the two clusters (the original solar-scaled C and N abundances were modified to allow for CN cycle conversion of C to N to achieve this ratio). This ratio is close to that found in standard stellar evolution calculations for low mass stars (e.g. Girardi et al. 2000). However, we note that this ratio is higher than the typical value C/O 0.18 found by Lederer et al. (2009) for O-rich AGB stars in NGC 1978 (see Table 3). Fortunately, O-rich models are insensitive to this uncertainly in the C/O ratio. In both clusters, the M to C star transition takes place near = -4.5. This can be seen in Figures 6 and 7 respectively, where we plot bolometric luminosities of AGB variables versus . We therefore assume C/O = 1.00 at this luminosity. We made a synthetic AGB calculation similar to that in Marigo et al. (1999) to estimate the C/O ratio increase with up to 1.0 at = -4.5. The change in C/O with in our models is given in Tables 5 and 6.
For the carbon stars brighter than = -4.5, estimating the C/O ratio is difficult. In NGC 1978, Lederer et al. (2009) found C/O 1.3 for two C stars and they also found two other C stars with lower limits C/O 1.5. In a broad sense, C/O ratios of planetary nebulae in the LMC put upper limits on the C/O ratio that would be appropriate for the most luminous C stars in the final heavy mass loss stage immediately preceding the planetary nebula (PN) stage (like the mid-IR sources in NGC 1978 and NGC 419). In the LMC, Stanghellini et al. (2005) found that a C/O of 2 is typical for non-bipolar PN in the LMC. We take this as the upper limit to C/O for our models for NGC 1978. In NGC 419, we have no observational constraints on C/O in the cluster C stars. We adopt the same upper limit C/O = 2 in NGC 419 as in NGC 1978 although we note that in the SMC, Stanghellini et al. (2009) found that a C/O of 4 is typical for non-bipolar SMC PN. We assume that from = -4.5, where C/O = 1, the C/O ratio increases to 2.0 at the luminosity of the most luminous star in each cluster. The luminosities and C/O ratios of the linear models are given in Tables 5 and 6.
In order to derive the pulsation mass, the mass used in the linear pulsation models was adjusted so that the models reproduced the period of the lowest luminosity () O-rich star in each cluster. These stars should have undergone the least mass loss, and their observed periods are well defined. Changes to the mass of the model require a refinement in the value of the mixing-length parameter so that simultaneous fitting of both for the fiducial giant branch and the period of the lowest luminosity pulsator is an iterative process. Once the mass was determined, it was kept constant for the more luminous models (the mixing-length was also kept constant). Under this assumption, the periods of the three lowest order modes were computed and their values are given in Tables 5 and 6 while the lines in Figures 6 and 7 show the variation of the periods with luminosity. To get an estimate of variation of the model periods with the fitted mass, masses 0.1 M⊙ different from the optimum value were also used with the above procedure (i.e. the mixing-length was adjusted to give the fiducial ) and their model periods were computed. The resulting change in the periods are shown as error bars in Figures 6 and 7.
In both clusters, the lowest luminosity O-rich stars pulsate in the second overtone mode. The C stars pulsate in a mixture of fundamental and first overtone modes. This agrees with the finding of previous studies that stars start pulsating on the AGB in higher overtones and they move to lower order modes, ultimately the fundamental mode, as luminosity increases (Lebzelter & Wood 2005; 2007).
The best pulsation mass low on the AGB for NGC 1978 is 1.55 M⊙ in good agreement with the mass of 1.44 to 1.53 M⊙ for early AGB stars predicted by isochrones (see Section 1). Similarly, the best pulsation mass low on the AGB for NGC 419 is 1.87 M⊙ in very good agreement with the mass of 1.64 to 1.94 M⊙ predicted by isochrones.
| / | / | /Hp | C/O | ||||||
|---|---|---|---|---|---|---|---|---|---|
| -3.80 | 1.55 | 0.538 | 2.255 | 3.5731 | 0.33 | 66.3 | 41.2 | 27.6 | 21.2 |
| -4.35 | 1.55 | 0.567 | 2.255 | 3.5455 | 0.50 | 134.8 | 76.2 | 49.7 | 42.6 |
| -4.45 | 1.55 | 0.574 | 2.255 | 3.5407 | 0.80 | 154.1 | 84.8 | 55.2 | 48.3 |
| -4.50 | 1.55 | 0.577 | 2.255 | 3.5408 | 0.10 | 162.3 | 88.1 | 57.5 | 50.9 |
| -4.68 | 1.55 | 0.591 | 2.255 | 3.5115 | 1.20 | 243.3 | 121.6 | 84.6 | 74.3 |
| -4.84 | 1.55 | 0.608 | 2.255 | 3.4913 | 1.50 | 337.5 | 154.5 | 119.4 | 96.2 |
| -5.39 | 1.55 | 0.683 | 2.255 | 3.4328 | 2.00 | 987.5 | 316.5 | 277.5 | 221.8 |
| / | / | /Hp | C/O | ||||||
|---|---|---|---|---|---|---|---|---|---|
| -4.03 | 1.87 | 0.548 | 1.845 | 3.5717 | 0.31 | 74.2 | 44.5 | 29.6 | 22.6 |
| -4.43 | 1.87 | 0.572 | 1.845 | 3.5529 | 0.50 | 122.5 | 69.2 | 44.7 | 36.0 |
| -4.46 | 1.87 | 0.575 | 1.845 | 3.5517 | 0.80 | 127.9 | 71.8 | 46.3 | 37.5 |
| -4.50 | 1.87 | 0.577 | 1.845 | 3.5513 | 1.00 | 132.7 | 74.0 | 47.6 | 38.5 |
| -4.79 | 1.87 | 0.602 | 1.845 | 3.5238 | 1.20 | 218.7 | 111.3 | 72.0 | 64.6 |
| -5.08 | 1.87 | 0.636 | 1.845 | 3.4944 | 1.50 | 378.0 | 166.1 | 119.2 | 100.6 |
| -5.33 | 1.87 | 0.671 | 1.845 | 3.4678 | 2.00 | 629.4 | 230.8 | 195.4 | 150.5 |
6 Nonlinear pulsation models and mass loss
The near-IR and mid-IR sources in the two clusters are very red and clearly have large mass loss rates. This is confirmed by the mass loss rates derived for these stars by Groenewegen et al. (2007). They should therefore have lost considerable amounts of mass during their AGB evolution. By determining their current masses using pulsation models, we can estimate how much mass has been lost, and we can compare this to what we expect would have been lost according to commonly-used mass loss formulae such as those of Vassiliadis & Wood (1993) and Blöcker (1995). Since these stars are large amplitude pulsators, we need to model them with nonlinear pulsation models because the linear and nonlinear pulsation periods for AGB stars can be very different (e.g. Lebzelter & Wood 2005). We now discuss the nonlinear pulsation models in each of the clusters.
6.1 NGC 1978
As seen in Figure 6, the sources IR1 and MIR1 in NGC 1978 are neither the most luminous nor the longest-period AGB stars in this cluster even though they are the reddest by a long margin (see Figure 5). This is a strange situation as the reddest stars with the largest mass loss rates should be the most luminous and the most evolved stars in the cluster. The most luminous star in NGC 1978 is LE3 but it is not particularly red. One possibility is that this object is a superposition on the sky of two bright AGB stars but we can find no evidence for this: the star appears single in an archive HST image of the cluster and Lederer et al. (2009) did not notice any multiple velocity components in their high resolution infrared spectra. We therefore assume that LE3 is indeed a single star. There are, however, several pieces of evidence that LE3 is not a normal cluster member: (1) it appears anomalously bright in the ,(-)0 diagram (Figure 5) compared to the locus formed by the other stars in both NGC 1978 and NGC 419, (2) it is more luminous than any star in NGC 419 even though the low luminosity AGB stars in NGC 419 have masses of 1.87 M⊙ compared to the smaller value of 1.55 M⊙ in NGC 1978, and (3) the period of LE3 lies midway between the fundamental and first overtone relations in Figure 6, suggesting that its mass is not normal for the cluster. We suggest that LE3 is a field star with a higher mass than that of the AGB stars in NGC 1978 or that it is an evolved blue straggler belonging to the cluster (and hence of higher mass than the other AGB stars).
If we ignore LE3, the most luminous cluster star becomes LE1 with , still slightly more luminous than IR1 and significantly more luminous that MIR1. In order to explain the luminosity and period of MIR1 relative to LE1, we have to assume that MIR1 has recently undergone a helium shell flash and that it is currently in the post-flash luminosity dip (0.43 magnitudes below the interflash luminosity maximum). We note that AGB stars spend about a third of their time during the interpulse period 0.43 magnitudes or more below the maximum H-burning luminosity (see the light curves in Vassiliadis & Wood 1993), so our assumption is reasonable. IR1 would be slightly (0.16 magnitudes) below the interflash luminosity maximum. In that case, the core masses for IR1 and MIR1 would be given by the luminosity-core mass relation for a star with the luminosity of LE1 at the tip of the AGB. Hence, for our nonlinear pulsation models we assume the luminosity of LE1 when we derive the core masses from the luminosity-core mass relation. We note that stars thought to be in a post-flash luminosity dip have also been found in the intermediate age LMC cluster NGC 1846 (Lebzelter & Wood 2007).
As with the linear models, a major uncertainity is the C/O ratio used in the opacity tables. We assume C/O = 1.5 for IR1 and C/O = 2.0 for MIR1. For the mixing-length, we used the same value as in the linear models.
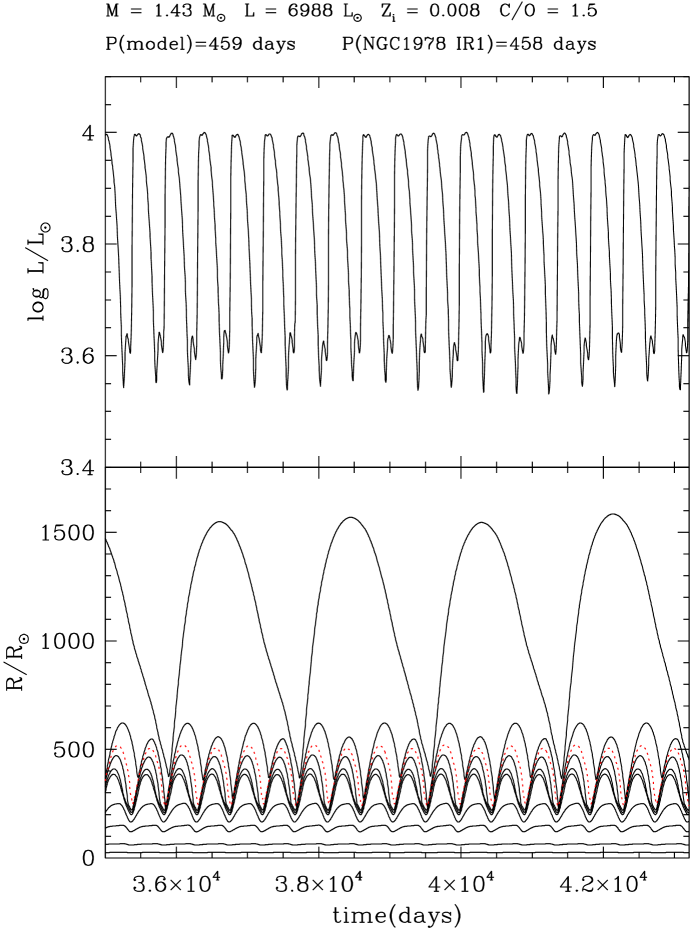
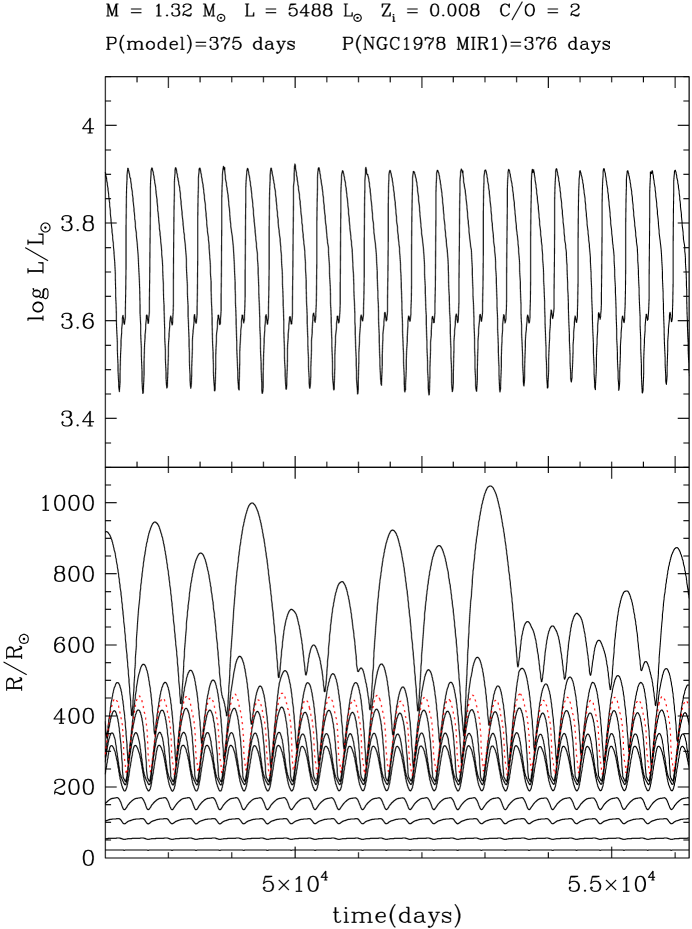
Given the luminosities for IR1 and MIR1 in Table 3, a series of static models with different masses was created for each of them and these models were then allowed to reach a full-amplitude limit cycle in the nonlinear pulsation code. A turbulent viscosity parameter (see Keller & Wood 2006) of 0.2 was used for IR1 and 0.1 was used for MIR1 as these values gave limiting light curve amplitudes similar to the observed amplitude. We note that the large amplitude pulsators go through a readjustment of their interior structure while transitioning from a static model to a large amplitude pulsator and that the nonlinear pulsation period can be quite different from the linear period of the static model. The models for IR1 and MIR1 had linear periods of 427 and 333 days and nonlinear periods of 459 and 375 days, respectively.
It was found that masses of 1.43 M⊙ and 1.32 M⊙ reproduced the observed periods (458 and 376 days) of IR1 and MIR1, respectively. The light curves and radius variations of the two models are shown in Figures 8 and 9. Given that the mass of stars low on the AGB of NGC 1978 is close to 1.55 M⊙, it appears that IR1 has lost 0.12 M⊙ on the AGB while MIR1 has lost 0.23 M⊙.
In order to compare the observed mass loss on the AGB on NGC 1978 with the mass loss predicted by the commonly-used mass loss formulae of Vassiliadis & Wood (1993, hereinafter VW) and Blöcker (1995), we have made simple synthetic AGB evolutionary calculations including mass loss. Averaged over helium shell flashes, AGB stars evolve at a constant rate in per unit time (e.g. Wood & Cahn 1977) and we use their rate
This rate is multiplied by a factor (1-) in the presence of third dredge-up, where is the fraction of the mass burnt through during the previous shell flash cycle that is dredged up. We used as found for LMC stars by Marigo et al. (1999). In order to calculate the mass loss rate according to VW, we need the fundamental mode pulsation period. Here, we use the fundamental mode , relation shown in Figure 6 to obtain : the relation is
In order to use the Blöcker (1995) formula, we need the radius. This was obtained from the fit
to the AGB position in the theoretical HR-diagram as defined by the and values in Table 3.
We assumed that each AGB star currently in the cluster arrived at with mass 1.55 M⊙. The star was then evolved in time using the above equations until the envelope was dissipated. It was immediately obvious that the Blöcker (1995) formula terminates the AGB at far too low a luminosity, . This is less than the luminosity of nearly all the variable AGB stars in NGC 1978. On the other hand, the VW mass loss rate caused the AGB to terminate at , in very good agreement with the luminosity of the most luminous star LE1 at . In the evolutionary models, the AGB mass reduced to the values appropriate for IR1 and MIR1 at and -5.03, respectively. This shows that mass loss is very concentrated near the tip of the AGB. Thus, each of the stars LE1, IR1 and MIR1 is close to the end of its AGB lifetime which should end within the next 2105 years according to the evolutionary model.
6.2 NGC 419
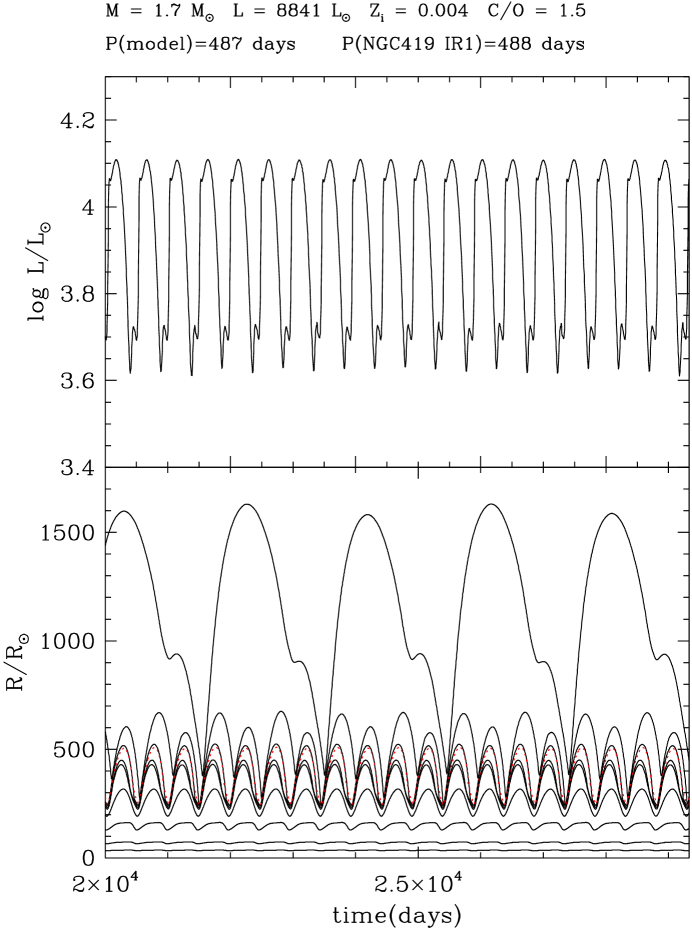
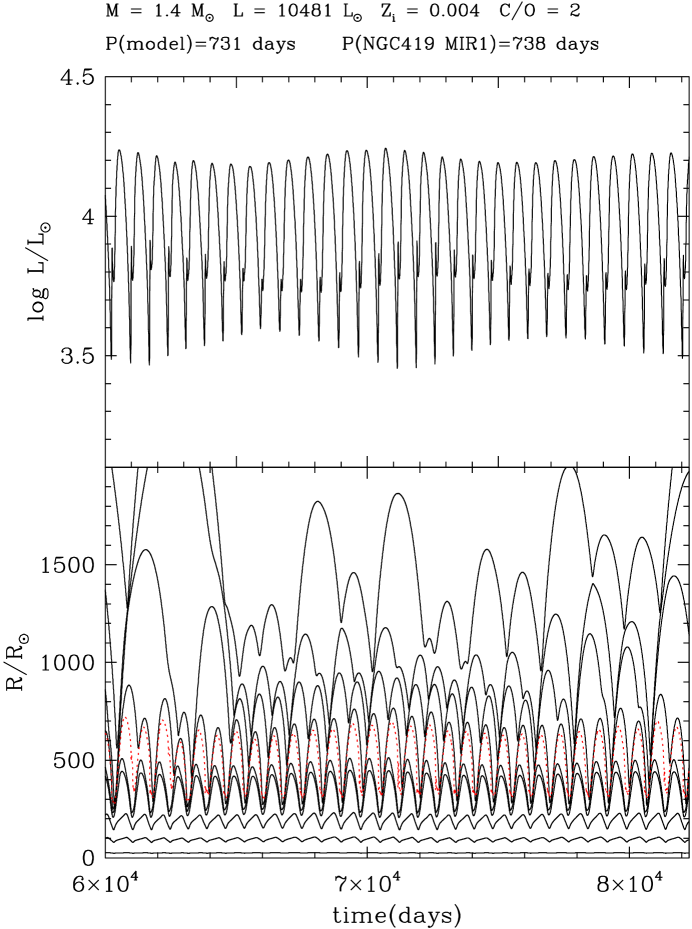
The IR1 and MIR1 sources in NGC 419 occur at the red, high luminosity tip of the AGB as expected (see Figures 7 and 5). Nonlinear pulsation models were created for these two stars using the same procedures as for NGC 1978. Here, the core mass was calculated from the luminosity-core mass relation using the luminosity of the object itself (from Table 4). As with NGC 1978, we assume C/O = 1.5 for IR1 and C/O = 2.0 for MIR1.
The light curves and radius variations of the two nonlinear pulsation models are shown in Figures 10 and 11. The observed periods of IR1 and MIR1 in NGC 419 are 488 and 738 days, respectively. The periods of the nonlinear pulsation models are 487 and 731 days, respectively (the corresponding linear periods of the static parent models were 509 and 1150 days). Masses of 1.70 M⊙ and 1.40 M⊙ were required to reproduced the observed periods of IR1 and MIR1. Given that the mass of stars low on the AGB of NGC 419 is close to 1.87 M⊙, it appears that IR1 has lost 0.17 M⊙ on the AGB while MIR1 has lost 0.47 M⊙ on the AGB.
As with NGC 1978, we have made simple synthetic AGB calculations including mass loss according to the formulae in Vassiliadis & Wood (1993) and Blöcker (1995). The methods used were the same as in NGC 1978 except that we used (the SMC value found by Marigo et al. 1999) and the , relation we used was a fit to the observed fundamental mode relation given by
In NGC 419, as in NGC 1978, the Blöcker (1995) formula terminates the AGB at far too low a luminosity, , less than the luminosity of nearly all the variable AGB stars. The VW mass loss rate caused the AGB to terminate at . This is more luminous than all stars in the cluster except MIR1 which has . This suggests that the VW mass loss rate is slightly too large for the stars in NGC 419. (However, we note that the mean luminosity of NGC 419 MIR1 may be more uncertain than that of most stars since the luminosity estimated from the near-IR and SST observations needed a particularly large increase of 0.72 magnitudes in order to get to the mean value - see Section 4).
The effect of the slightly low AGB termination luminosity on the initial-final mass relation is very small since the change in core mass between and -5.33 is only 0.028 M⊙. More significant is the effect on nucleosynthetic yields. The average time taken to increase from -5.14 to -5.33 on the AGB is 6.6105 years (if ), which corresponds to 10 shell flashes and associated third dredge-ups. The yields of carbon and s-process elements returned to the interstellar medium will thus be underestimated when using the VW mass loss rate. Full AGB evolution calculations are required to properly quantify these effects.
7 Summary and conclusions
Pulsation periods have been determined for most of the bright AGB stars in the LMC cluster NGC 1978 and the SMC cluster NGC 419. It is shown that the AGB stars start pulsating at low luminosities on the AGB in the second overtone mode of radial pulsation. They switch to lower order modes at higher luminosities and the carbon stars are first overtone or fundamental mode pulsators.
Pulsation masses have been determined for the O-rich pulsators low on the AGB. In NGC 1978, the early-AGB mass is 1.55 M⊙ while it is 1.87 M⊙ in NGC 419. These masses are in very good agreement with the masses predicted by isochones which are consistent with the ages of the clusters determined from main-sequence fitting.
Reasons are given that the brightest star in NGC 1978, LE3, is not a cluster member, or perhaps it is an evolved blue straggler. Neither of the two very dusty AGB stars in NGC 1978, IR1 and MIR1, is the brightest star on the AGB. It is suggested that MIR1 is in post-helium shell flash luminosity dip and that it is about 0.43 magnitudes below the interflash hydrogen-burning luminosity peak. IR1 is about 0.16 magnitudes below the interflash peak. In NGC 419, the two very dusty AGB stars, IR1 and MIR1, are the most luminous stars in the cluster.
Pulsation masses have been derived for the dusty stars in each cluster from nonlinear pulsation models. The pulsation masses show that these stars have lost a few tenth of a solar mass due to stellar winds near the AGB tip. The AGB tip luminosities are compared to simple synthetic AGB evolutionary models which include mass loss. These models use the derived stellar mass on the early AGB as their starting point. The evolutionary models which use the Vassiliadis & Wood (1993) mass loss rate reproduce the observed tip luminosities quite well while models using the Blöcker (1995) mass loss rate predict AGB tip luminosities that are far too faint.
The evolutionary models just described are very approximate. Full evolutionary models which include helium shell flashes are required to properly model the final evolution on the AGB. The study here shows that reliable pulsation masses can be determined for AGB stars. Given the considerable number of intermediate age clusters in the LMC and SMC this leads to the possibility of determining the amount of mass lost in clusters covering a range of AGB tip luminosity, stellar mass and metallicity. Comparing these results with evolutionary models should allow a determination of the mass loss rate as a function of mass, luminosity and metallicity.
Acknowledgements
TL acknowledges funding by Austrian Science Fund FWF through project number P20046-N16.
References
- [\citeauthoryear Alcock et al.1997] Alcock C., Allsman R.A., Alves D., Axelrod T.S., Becker A.C., Bennett D.P., Cook K.H., Freeman K.C., Griest K., Guern J., Lehner M.J., Marshall S.L., Minniti D., Peterson B.A., Pratt M.R., Quinn P.J., Rodgers A.W., Sutherland W., Welch D.L., 1997, ApJ, 482, 89
- [\citeauthoryearAzzopardi et al.1986] Azzopardi M., Dumoulin B., Quebatte J., Rebeitot E., 1986, The Messenger, 43, 12
- [\citeauthoryearBessell et al.1983] Bessell M.S., Wood P.R., Evans T.L., 1983, MNRAS, 202, 59
- [\citeauthoryearBlöcker1995] Blöcker T., 1995, A&A, 297, 727
- [\citeauthoryearBolatto et al.2007] Bolatto A.D., Simon J.D., Stanimirović S., van Loon J.T., Shah R.Y., Venn K., Leroy A.K., Sandstrom K., Jackson J.M., Israel F.P., Li A., Staveley-Smith L., Bot C., Boulanger F., Rubio M., 2007, ApJ, 655, 212
- [\citeauthoryearBomans, Vallenari & de Boer1995] Bomans D. J., Vallenari A., de Boer K.S., 1995, A&A, 298, 427
- [\citeauthoryearCardelli et al.1989] Cardelli J.A., Clayton G.C., Mathis J.S., 1989, ApJ, 345, 245
- [\citeauthoryearCarpenter2001] Carpenter J.M., 2001, AJ, 121, 2851
- [\citeauthoryearCastellani et al.2003] Castellani V., Degl’Innocenti S., Marconi M., Prada Moroni P.G., Sestito P., 2003, A&A, 404, 645
- [\citeauthoryearFerraro et al.2006] Ferraro F.R., Mucciarelli A., Carretta E., Origlia L., 2006, ApJ, 645, L33
- [\citeauthoryearFischer et al.1992] Fischer P., Welch D.L., Mateo M., 1992, AJ, 104, 1086
- [\citeauthoryearFox & Wood1982] Fox M.W., Wood P.R., 1982, ApJ, 259, 198
- [\citeauthoryearFrogel et al.1990] Frogel J.A., Mould J., Blanco V.M., 1990, ApJ, 352, 96
- [\citeauthoryearGirardi et al.2000] Girardi L., Bressan A., Bertelli G., Chiosi C., 2000, A&AS, 141, 371
- [\citeauthoryearGirardi et al.2009] Girardi L., Rubele S., Kerber L., 2009, MNRAS, 394, L74
- [\citeauthoryearGlatt et al.2008] Glatt K., Grebel E.K., Sabbi E., Gallagher J.S., Nota A., Sirianni M., Clementini G., Tosi M., Harbeck D., Koch A., Kayser A., Da Costa G., 2008, AJ, 136, 1703
- [\citeauthoryearGroenewegen et al.2007] Groenewegen M.A.T., Wood P.R., Sloan G.C., Blommaert J.A.D.L., Cioni M.R.L., Feast M.W., Hony S., Matsuura M., Menzies J.W., Olivier E.A., Vanhollebeke E., van Loon J.T., Whitelock P.A., Zijlstra A.A., Habing H.J., Lagadec E., 2007, MNRAS, 376, 313
- [\citeauthoryearHill et al.2000] Hill V., François P., Spite M., Primas F., Spite F., 2000, A&A, 364, L19
- [\citeauthoryearHoudashelt et al.2000a] Houdashelt M.L., Bell R.A., Sweigart A.V., Wing R.F., 2000a, AJ, 119, 1424
- [\citeauthoryearHoudashelt et al.2000b] Houdashelt M.L., Bell R.A., Sweigart A.V., 2000b, AJ, 119, 1448
- [\citeauthoryearKayser et al.2009] Kayser A., Grebel E.K., Harbeck D.R., Cole A.A., Koch A., Gallagher J.S., da Costa G.S., 2009, Globular Clusters - Guides to Galaxies, 157
- [\citeauthoryearKeller & Wood2006] Keller S.C., Wood P.R., 2006, ApJ, 642, 834
- [\citeauthoryearLebzelter & Wood2005] Lebzelter T., Wood P.R., 2005, A&A, 441, 1117
- [\citeauthoryearLebzelter & Wood2007] Lebzelter T., Wood P.R., 2007, A&A, 475, 643
- [\citeauthoryearLederer et al.2009] Lederer M.T., Lebzelter T., Cristallo S., Straniero O., Hinkle K.H., Aringer B., 2009, A&A, 502, 913
- [\citeauthoryearLloyd Evans1980] Lloyd Evans T., 1980, MNRAS, 193, 87
- [\citeauthoryearMarigo et al.1999] Marigo P. Girardi L., Bressan A., 1999, A&A, 344, 123
- [\citeauthoryearMarigo & Aringer2009] Marigo P., Aringer B., 2009, A&A, 508, 1539
- [\citeauthoryearMcGregor et al.1994] McGregor P., Hart J., Downing M., Hoadley D., Bloxham G., 1994, Experimental Astronomy, 3, 139
- [\citeauthoryearMilone et al.2009] Milone A.P., Bedin L.R., Piotto G., Anderson J., 2009, A&A, 497, 755
- [\citeauthoryearMeixner et al.2006] Meixner M., Gordon K.D., Indebetouw R., Hora J.L., Whitney B., Blum R., Reach W., Bernard J.P., Meade M., Babler B., Engelbracht C.W., For B.Q., Misselt K., Vijh U., Leitherer C., Cohen M., Churchwell E.B., Boulanger F., Frogel J.A., Fukui Y., Gallagher J., Gorjian V., Harris J., Kelly D., Kawamura A., Kim S., Latter W.B., Madden S., Markwick-Kemper C., Mizuno A., Mizuno N., Mould J., Nota A., Oey M.S., Olsen K., Onishi T., Paladini R., Panagia N., Perez-Gonzalez P., Shibai H., Sato S., Smith L., Staveley-Smith L., Tielens A.G.G.M., Ueta T., van Dyk S., Volk K., Werner M., Zaritsky D., 2006, AJ, 132, 2268
- [\citeauthoryearMucciarelli et al.2007] Mucciarelli A., Ferraro F.R., Origlia L., Fusi Pecci F., 2007, AJ, 133, 2053
- [\citeauthoryearNishida et al.2000] Nishida, S., Tanabé, T., Nakada, Y., Matsumoto, S., Sekiguchi, K., & Glass, I. S., 2000, MNRAS, 313, 136
- [\citeauthoryearOlszewski et al.1991] Olszewski E.W., Schommer R.A., Suntzeff N.B., Harris H.C., 1991, AJ, 101, 515
- [\citeauthoryearRubele et al.2010] Rubele S., Kerber L., Girardi L., 2010, MNRAS, 403, 1156
- [\citeauthoryearSperl1998] Sperl M., 1998, Communications in Asteroseismology, 111, 1
- [\citeauthoryearStanghellini et al.2005] Stanghellini L., Shaw R.A., Gilmore D., 2005, ApJ, 622, 294
- [\citeauthoryearStanghellini et al.2009] Stanghellini L., Lee T-H., Shaw R.A., Balick B., Villaver E., 2009, ApJ, 702, 733
- [\citeauthoryearTanabé et al.1997] Tanabé T., Nishida S., Matsumoto S., Onaka T., Nakada Y., Soyano T., Ono T., Sekiguchi K., Glass I.S., 1997, Nature, 385, 509
- [\citeauthoryearTanabé et al.1998] Tanabé T., Nishida S., Nakada Y., Onaka T., Glass I.S., Sauvage M., 1998, Ap&SS, 255, 407
- [\citeauthoryearTanabé et al.2004] Tanabé T., Ita Y., Matsunaga N., Nakada Y., 2004, ASPC, 310, 295
- [\citeauthoryearWesterlund1997] Westerlund B.E., 1997, The Observatory, 117, 317
- [\citeauthoryearWhitelock et al.2003] Whitelock, P.A., Feast, M.W., van Loon, J.T., Zijlstra, A.A., 2003, MNRAS, 342, 86
- [\citeauthoryearVassiliadis & Wood1993] Vassiliadis E., Wood P.R., 1993, ApJ 413, 641
- [\citeauthoryearWood & Cahn1977] Wood P.R., Cahn J.H., 1977, ApJ, 211, 499
- [\citeauthoryearWood & Zarro1981] Wood P.R., Zarro D.M., 1981, ApJ, 247, 247
- [\citeauthoryearWood et al.19991999] Wood, P.R., Alcock, C., Allsman, R.A., Alves, D., Axelrod, T.S., Becker, A.C., Bennett, D.P., Cook, K.H., Drake, A.J., Freeman, K.C., Griest, K., King, L.J., Lehner, M.J., Marshall, S.L., Minniti, D., Peterson, B.A., Pratt, M.R., Quinn, P.J., Stubbs, C.W., Sutherland, W., Tomaney, A., Vandehei, T., Welch, D.L., 1999, IAUS, Asymptotic Giant Branch Stars, 191, 151
- [\citeauthoryearŻebruń et al.2001] Zebruń.K., Soszynski I., Wozniak P.R., Udalski A., Kubiak M., Szymanski M., Pietrzynski G., Szewczyk O., Wyrzykowski L., 2001, Acta Astronomica, 51, 317