Constraints on the gamma-ray emitting region in blazars from multi-frequency VLBI measurements
Abstract
Single-zone synchrotron self-Compton and external Compton models are widely used to explain broad-band Spectral Energy Distributions (SEDs) of blazars from infrared to gamma-rays. These models bear obvious similarities to the homogeneous synchrotron cloud model which is often applied to explain radio emission from individual components of parsec-scale radio jets. The parsec-scale core, typically the brightest and most compact feature of blazar radio jet, could be the source of high-energy emission. We report on ongoing work to test this hypothesis by deriving the physical properties of parsec-scale radio emitting regions of twenty bright Fermi blazars using dedicated – GHz VLBA observations and comparing these parameters to results of SED modeling.
1 Introduction
Blazar jets are known to radiate across the entire electromagnetic spectrum (e.g. [Marscher 2006, 2010]). Their radio to UV (sometimes – X-ray) emission is believed to be dominated by synchrotron radiation of relativistic electrons while radiation at higher energies could be due to the inverse Compton scattering of synchrotron photons emitted by the electrons themselves (the synchrotron self-Compton process, SSC, [Jones et al. 1974, Ghisellini & Maraschi 1989]) and photons from external sources (External Compton, EC, [Sikora et al. 1994, Dermer & Schlickeiser 2002]). The sources of the external seed photons for the EC process include the accretion disc, broad line region (BLR) clouds, warm dust and the cosmic microwave background (CMB), with their relative contribution vary for different blazars.
|
||||||||||||||||||||||||||||||||||||||||||||||||||||||||||||||||||||||||||||||||||||||||||||||||||||||||||||||||||||||||||||||||||||||||||||||||||||||||||||||||||||||||||||||||||||||||||||||||||||||||||||||||||||||||||||||||||||||||
Despite the wide acceptance of the picture outlined above, the exact location, geometry and physical properties of the regions responsible for blazar emission at different bands remain largely unknown. Considerable success was achieved by single-zone models (assuming a single spherical relativistically moving blob of magnetized plasma which emits synchrotron radiation and interacts with an ambient photon field) in explaining blazar emission from IR to -ray energies (among the many recent examples: [Abdo et al. 2010, Finke & Dermer 2010] and the references in Table 1). A significant fraction of blazar radio emission is known to originate at the extended parsec-scale jet and cannot be accounted for in the framework of a single-zone model. However, emission from individual jet components resolved with the Very Long Baseline Interferometry (VLBI) can usually be well described by a single uniform synchrotron source model ([Pacholczyk 1970]). It is tempting to identify one of the jet components resolved by VLBI with the zone responsible for the emission at higher frequencies.
In this contribution we describe a program of coordinated multi-frequency (– GHz) Very Long Baseline Array (VLBA), Swift and Fermi observations of selected -ray bright blazars with the aim to identify the possible source of high-energy radiation within the parsec-scale jet and put constraints on physical properties based on radio spectra.
2 Observations and analysis
We have used the VLBA ([Napier 1994]) to observe twenty blazars that were expected to be bright -ray emitters, prior to the launch of Fermi-GST. The observations were conducted simultaneously at seven frequencies (– GHz) utilizing the array’s unique capability of fast frequency switching between individual VLBI scans. After the initial calibration in AIPS ([Greisen 1990]), the sources were self-calibrated and imaged independently at each frequency using Difmap ([Shepherd 1994]). This software was also used to model the source structure in the -plane and derive constraints on the core size at GHz (Table 1).
A special procedure was developed to improve amplitude calibration of the correlated flux density resulting in a % accuracy in - GHz range and a % accuracy at and GHz. Images at different frequencies were aligned with each other using optically thin regions of the jet to compensate for phase center shifts and possible frequency-dependent core position (“core shift”, [Lobanov 1998, Kovalev et al. 2008]). We applied a spectrum extraction technique described by [Sokolovsky et al. (2010)] which relies on the positions and flux densities of individual CLEAN components as opposed to the use of restored VLBI images in order to suppress spectral artifacts arising from the convolution with a Gaussian beam.
The sources were observed with Swift in X-ray and optical-UV bands typically within two days after the VLBA observation. The Swift data were analyzed using standard tools provided in the HEAsoft111http://heasarc.nasa.gov/lheasoft/ package. Whenever feasible, standard stars within the UVOT field of view were utilized to improve photometry in bands. The Galactic correction was applied using the values from [Schlegel et al. (1998)] and [Kalberla et al. (2005)] for the optical-UV and X-ray absorption respectively.
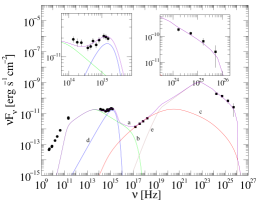
To obtain the quasi-simultaneous SED of PKS B1510089 (Fig. 1) discussed below, the VLBA, Swift and Fermi/LAT data collected during two days 2009 April 09 – 10 were complemented by photometry obtained on April 12 with the 2.56 m Nordic Optical Telescope (NOT) and infrared photometry obtained on April 07 and 17 with the 2.1 m telescope of Guillermo Haro Observatory in Cananea, México. The Submillimeter Array (SMA) provided flux density measurements at 1 mm from 2009 April 05 and 14. These observations resulted in the most well-sampled quasi-simultaneous SED (containing multi-frequency VLBI data) among all our sources, and for that reason it was the first we chose to construct a model of.
magnitudes of PKS B1510089 observed by the Swift/UVOT are systematically (05–03) brighter then those observed by the NOT two days later. Since both observations were calibrated against the same set of comparison stars from [González-Pérez et al. (2001)], the difference can be interpreted as a clear sign of optical inter-day variability.
3 Discussion of the first results
Parsec-scale radio emission of all the observed sources (Table 1) is dominated by a bright unresolved core (the apparent origin of the jet, see a discussion by [Marscher 2008]) which exhibits high-amplitude flux density variability (e.g. [Vercellone et al. 2010]). The parsec-scale core is a natural candidate to be directly related to the bright variable emission at -rays ([Kovalev et al. 2009]) and other bands.
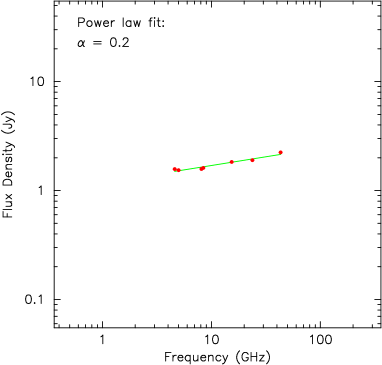
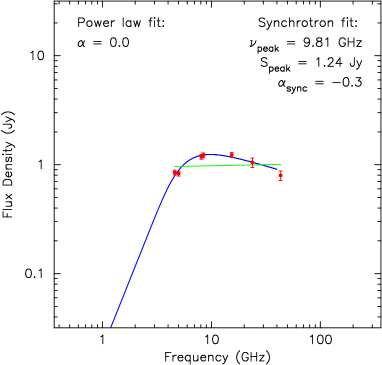
The multi-frequency VLBA observations have detected the synchrotron self-absorption peak in core regions of most of the observed sources with the exception of B0716714, OJ 287, PKS B1510089 and 3C 454.3. The latter sources show inverted spectra in the – GHz range, characteristic of a partially optically-thick inhomogeneous source. These sources may have a detectable self-absorption turnover at frequencies GHz. Fig. 2 compares core radio spectra of PKS B1510089 and OJ 248.
For sources where the self-absorption peak was detected, it was possible to put upper limits on the magnetic field strength using the procedure described by [Sokolovsky et al. (2010)]. The source intrinsic values were computed using variability Doppler factor estimations from [Hovatta et al. (2009)]. The resulting liberal upper limits on the magnetic field strength owe to poor resolution at lower observing frequency ( GHz) which ultimately limits our ability to unambiguously extract spectrum of a given spatial region.
In the case of a bright isolated component, which dominates the emission across the whole observed frequency range, it is possible to estimate its size using the highest observing frequency ( GHz) instead of the lowest one and, therefore, obtain much tighter constrains on the component size and the magnetic field strength. The applicability of this “isolated component” scenario to each individual source is currently being investigated.
Table 1 presents constrains on size (), magnetic field strength () and electron energy spectral slope () in the radio core region, see [Sokolovsky et al. (2010)] for a more detailed discussion. These values are compared to the corresponding parameters of SED models (, , ) reported in the literature. Doppler factors from SED models () and those assumed for computation () are also listed. The SED model parameters are well within the constraints set by the multi-frequency VLBA data, except for 3C 273 which shows a discrepancy in – that may be due to insufficient resolution of our data set. There is evidence from 86 GHz VLBI data that G in the mm-wavelength core of 3C 273 ([Savolainen et al. 2008]).
To further test the possible relation between the radio core and the emitting blob implied by single-zone SED models, we have constructed the quasi-simultaneous SED of PKS B1510089 presented in Fig. 1. The use of the VLBI core flux density (instead of the total flux density obtained by single-dish radio observations) allows us to exclude the emission coming from the parsec-scale jet and larger scales. Our ambition was to check how this will affect the SED modeling.
| Minimum Lorentz factor | = | |
| Brake Lorentz factor | = | |
| Maximum Lorentz factor | = | |
| energy slope below | = | |
| energy slope above | = | |
| Doppler factor | = | |
| Bulk Lorentz factor | = | |
| Magnetic field strength | = | G |
| Variability time | = | sec |
| Blob radius | = | cm |
| Jet power (magnetic field) | = | erg/s |
| Jet power (electrons) | = | erg/s |
| Black hole mass | = | |
| Accretion efficiency | = | 1/12 |
| Eddington ratio | = | |
| Blob distance from disk | = | cm |
Contribution from a hot thermal component, probably the accretion disk, is evident in the optical and UV bands. The SED in the IR to -ray range can be explained by the single zone EC model with the Compton scattered accretion disk photons being responsible for the bulk of the observed -ray emission. In this model, the blob is close enough to the accretion disk so the accretion disk photons can reach the blob directly, with no need to be scattered back from BLR clouds or dust. Note, that due to relativistic aberration some of the disk photons will be coming to the blob (nearly) head-on. The photons will primarily come from a radius of the disk of where r is the blob’s distance from the black hole ([Dermer & Schlickeiser 2002]). The blob size was constrained by the observed -ray variability time scale of the order of a few hours ([Abdo et al. 2010]). Parameters of the model are summarized in Table 2. We note that the model fit is not unique, single-zone models with a different source of seed photons could probably also produce an acceptable fit (cf. [Abdo et al. 2010]).
The constructed model (Fig. 1) represents well the IR to -ray data, however it dramatically underpredicts the radio emission because of the synchrotron self-absorption occurring in the small blob at a high frequency. A significantly larger blob size would be inconsistent with the observed variability timescale. Even if the variability timescale argument were dismissed, a single-zone SED model with a larger blob would have difficulties in explaining the observed hard radio spectrum which is inconsistent with the softer X-ray spectrum or optically thick synchrotron radiation from a uniform source. One way to overcome this difficulty would be to introduce a second brake in the electron energy spectrum.
Alternatively, one could abandon the attempt to explain the whole SED with a single-zone model and assume that even the radio emission observed from the cm-mm band core is coming from a larger () structure downstream of the blob responsible for the IR-to--ray emission. This structure (which cannot be observed separately from the blob due to limited resolution of the available VLBI data) could be a smooth jet ([Blandford & Konigl 1979]) or a number of distinct jet components ([Marscher 1980]) – perhaps the blobs which contributed to high-energy emission earlier… One could argue that currently this extended region does not contribute significantly to the optical and -ray emission on the basis of the observed short timescale variability in these bands. A more detailed SED modeling is needed to test this scenario.
4 Summary
The program of coordinated multi-frequency (– GHz) VLBA, Swift and Fermi observations of selected -ray bright blazars is described and the first analysis results are discussed. Constraints on the size () and magnetic field strength () in the parsec-scale core region derived from the VLBA observations are consistent with the values (, ) usually assumed in single-zone SED models (Table 1). However, the single-zone SED model which we tested for PKS B1510089 has difficulties in explaining the observed level of core radio emission while being consistent with the observed -ray and optical variability timescales. The multi-frequency VLBA and SED data analysis for the whole sample is in progress. The SED data on PKS B1510089 discussed here are available from KVS upon request.
Acknowledgements.
KVS is supported by the International Max-Planck Research School (IMPRS) for Astronomy and Astrophysics at the universities of Bonn and Cologne. YYK was supported in part by the return fellowship of Alexander von Humboldt foundation and the Russian Foundation for Basic Research (RFBR) grant 08-02-00545. This work is based on data obtained from the National Radio Astronomy Observatory’s Very Long Baseline Array (VLBA), project BK150. The National Radio Astronomy Observatory is a facility of the National Science Foundation operated under cooperative agreement by Associated Universities, Inc. The Submillimeter Array is a joint project between the Smithsonian Astrophysical Observatory and the Academia Sinica Institute of Astronomy and Astrophysics and is funded by the Smithsonian Institution and the Academia Sinica. The data presented here have been taken using ALFOSC, which is owned by the Instituto de Astrofisica de Andalucia (IAA) and operated at the Nordic Optical Telescope under agreement between IAA and the NBIfAFG of the Astronomical Observatory of Copenhagen. The authors acknowledge the support by the staff of the Observatorio Astrofísico Guillermo Haro.References
- [Abdo et al. 2010] Abdo, A. A., Ackermann, M., Ajello, M., et al. 2010, ApJ submitted
- [Acciari et al. (2009)] Acciari, V. A., Aliu, E., Aune, T., ApJ, 707, 612
- [Aharonian et al. (2009)] Aharonian, F., Akhperjanian, A. G., Anton, G., et al. 2009, ApJ, 696, L150
- [Anderhub et al. (2009)] Anderhub, H., Antonelli, L. A., Antoranz, P., et al. 2009, ApJ, 705, 1624
- [Blandford & Konigl 1979] Blandford R. D., Konigl A. 1979, ApJ, 232, 34
- [Bonnoli et al. (2010)] Bonnoli, G., et al. 2010, submitted to MNRAS arXiv:1003.3476
- [Chen et al. (2008)] Chen A. W., D’Ammando, F., Villata, M., et al. 2008, A&A, 489, L37
- [Dermer & Schlickeiser 2002] Dermer, C. D., & Schlickeiser, R. 2002, ApJ, 575, 667
- [Finke & Dermer 2010] Finke J. D., & Dermer C. D. 2010, ApJ, 714, L303
- [Ghisellini & Maraschi 1989] Ghisellini, G., & Maraschi, L. 1989, ApJ, 340, 181
- [Giuliani et al. (2009)] Giuliani, A., D’Ammando, F., Vercellone, S., et al. 2009, A&A, 494, 509
- [González-Pérez et al. (2001)] González-Pérez, J. N., Kidger, M. R., & Martín-Luis, F. 2001, AJ, 122, 2055
- [Greisen 1990] Greisen E. W. 1990, in Seminar on Acquisition, Processing and Archiving of Astronomical Images, 125
- [Hovatta et al. (2009)] Hovatta, T., Valtaoja, E., Tornikoski, M., Lähteenmäki, A. 2009, A&A, 494, 527
- [Jones et al. 1974] Jones, T. W., O’Dell, S. L., Stein, W. A., 1974, ApJ, 188, 353
- [Kalberla et al. (2005)] Kalberla P. M. W., Burton, W. B., Hartmann, D., et al. 2005, A&A, 440, 775
- [Kovalev et al. 2008] Kovalev, Y. Y., Lobanov, A. P., Pushkarev, A. B., Zensus, J. A. 2008, A&A, 483, 759
- [Kovalev et al. 2009] Kovalev, Y. Y., Aller, H. D., Aller, M. F., et al., 2009, ApJ, 696, L17
- [Lobanov 1998] Lobanov, A. P. 1998, A&A, 330, 79
- [Marscher 1980] Marscher, A. P. 1980, Nature, 288, 12
- [Marscher 2006] Marscher, A. P. 2006, AIP Conf. Ser., 856, 1
- [Marscher 2008] Marscher, A. P. 2008, ASP Conf. Ser., 386, 437
- [2010] Marscher, A. P., 2010, in The Jet paradigm - From Microquasars to Quasars, ed. T. Belloni, Lecture Notes in Physics, 794, 173
- [Napier 1994] Napier, P. J. 1994, IAUS, 158, 117
- [Pacciani et al. (2009)] Pacciani, L., Donnarumma, I., Vittorini, V., et al. 2009, A&A, 494, 49
- [Pacholczyk 1970] Pacholczyk, A. G. 1970, Radio astrophysics, (San Francisco: Freeman)
- [Savolainen et al. 2008] Savolainen, T., Wiik, K., Valtaoja, E., Tornikoski, M. 2008, in Extragalactic Jets: Theory and Observation from Radio to Gamma Ray, ed. T.A. Rector & D.S. De Young, ASP Conf. Ser. 386, (San Francisco: ASP), p. 451
- [Schlegel et al. (1998)] Schlegel, D. J., Finkbeiner, D. P., Davis, M. 1998, ApJ, 500, 525
- [Shepherd 1994] Shepherd, M. C., Pearson, T. J., & Taylor, G. B. 1994, BAAS, 26, 987
- [Sikora et al. 1994] Sikora, M., Begelman, M. C., & Rees, M. J. 1994, ApJ, 421, 153
- [Sokolovsky et al. (2010)] Sokolovsky, K. V., Lobanov, A. P., Savolainen, T., et al. 2010, in 2009 Fermi Symposium, eConf Proceedings C091122, arXiv:1001.2591
- [Tagliaferri et al. (2008)] Tagliaferri, G., Foschini, L., Ghisellini, G., et al. 2008, ApJ, 679, 1029
- [Vercellone et al. 2010] Vercellone, S., D’Ammando, F., Vittorini, V., et al. 2010, ApJ, 712, 405