New Results from the Magellan IMACS Spectroscopic Ly Survey: NICMOS Observations of Ly emitters at 11affiliation: This work is based in part on observations made with the NASA/ESA Hubble Space Telescope, obtained from the Space Telescope Science Institute, which is operated by the Association of Universities for Research in Astronomy Inc., under NASA contract NAS 5-26555. These observations are associated with proposal 11183.
Abstract
We present NICMOS (rest-frame 1200-2100 Å) observations of the three Ly emitters discovered in the blind multislit spectroscopic survey by Martin et al. (2008). These images confirm the presence of the two sources which were previously only seen in spectroscopic observations. The third source, which is undetected in our observations has been detected in narrowband imaging of the Cosmic Origins Survey (COSMOS), so our nondetection implies a rest frame equivalent width Å (). The two – detected sources have more modest rest frame equivalent widths of 30-40 Å, but all three are typical of high-redshift LAEs. In addition, the - detected sources have UV luminosities that are within a factor of two of , and sizes that appear compact (015) in our NIC2 images – consistent with a redshift of 5.7. We use these UV-continuum and Ly measurements to estimate the - colors of these galaxies, and show that at least one, and possibly all three would be missed by the dropout LBG selection. These observations help demonstrate the utility of multislit narrowband spectroscopy as a technique for finding faint emission line galaxies.
Subject headings:
galaxies: high-redshift – galaxies: evolution – galaxies: formation1. Introduction
Studying the epoch around is important for our understanding of the early stages of galaxy formation. It is around this time, when the age of the Universe was less than a Gyr, that the reionization of the hydrogen component of the intergalactic medium (IGM) was substantially completed (Fan et al., 2006). Hundreds of galaxies have now been photometrically selected (e.g. Bouwens et al. 2007; McLure et al. 2009), and at least tens of Lyman break galaxies (LBGs) and many more Ly emitters (LAEs) are now spectroscopically confirmed (Dow-Hygelund et al. 2007; Vanzella et al. 2009; Stanway et al. 2007; Kashikawa et al. 2006; Shimasaku et al. 2006; Stark et al. 2010). While there are hints of substantial star formation at even higher redshifts (Eyles et al. 2005, 2007; Yan et al. 2006; Simcoe 2006; Ryan-Weber et al. 2009; Dunkley et al. 2009; Bouwens et al. 2008, 2010; Bunker et al. 2009), remains the earliest epoch for which robust galaxy samples are available.
At , galaxies are selected via the Lyman break method (Meier 1976; Steidel et al. 1996), or because of strong Ly emission (Hu et al., 2002, 2004; Rhoads et al., 2004; Ajiki et al., 2004; Westra et al., 2006). Both methods select star-forming galaxies, but the two populations differ. Not all LBGs have Ly emission (Shapley et al., 2003; Stanway et al., 2007; Vanzella et al., 2009) and LAEs can be missed by LBG surveys because they are faint in the continuum or their Ly emission contaminates broad-band photometry. Studies of LAEs are an important complement to LBG surveys, because the faint continuum luminosities and high specific star formation rates of LAEs make them likely candidates for galaxy building blocks.
To date, narrow-band imaging surveys have been very successful in finding LAEs at . Mulitwavelength observations have shown that these LAEs are typically (but not always) younger and less massive, and they have lower dust extinction than LBGs (Finkelstein et al., 2007, 2008, 2009; Gawiser et al., 2006, 2007; Nilsson et al., 2007; Lai et al., 2008; Kornei et al., 2010). In addition, Ly luminosity functions measured at , show little or no evolution with redshift (Shimasaku et al., 2006; Gronwall et al., 2007; Dawson et al., 2007; Murayama et al., 2007; Ouchi et al., 2008). At higher redshifts measurements of the Ly luminosity function may allow a determination of the neutral hydrogen fraction in the intergalactic medium and LAE clustering could help constrain models of the patchiness of of the reionization process (Santos, 2004; Santos et al., 2004; Haiman & Cen, 2005; Furlanetto et al., 2006; Dijkstra et al., 2007; McQuinn et al., 2007). In fact, Kashikawa et al. (2006) now report a measured decline in the Ly luminosity function at , although this is not seen in a compilation of different data sets presented by Malhotra & Rhoads (2004).
Spectroscopic searches for LAEs have the potential to detect objects with fainter line emission than purely narrow-band imaging, because they sample with a resolution closer to the intrinsic width of the emission line. This is especially important at , where observing the faint end of the galaxy luminosity function is challenging. However, the task is challenging and first efforts at blank sky surveys using multi-slit narrowband spectroscopy at Keck Observatory and the Very Large Telescope (VLT) found only low and intermediate redshift interlopers (Tran et al., 2004; Martin & Sawicki, 2004). More recently, different spectroscopic strategies have met success. Sawicki et al. (2008) have found several faint serendipitous LAEs at in a search of 20% of the DEEP2 database. While the area subtended by DEEP2 slits is only 21.6 arcmin2, a large line-of-sight volume is sampled within in the relatively OH-free portion of the sky spectrum at Å. In addition, Rauch et al. (2008) found 27 LAEs in a single longslit spectrum; their 100 hour VLT observation reached a flux one to two orders of magnitude deeper than most other LAE searches. At higher redshifts, slitless spectroscopy with Hubble Space Telescope (HST) has uncovered a few sources at (Pirzkal et al., 2007), and longslit spectroscopy of the critical lines of strong gravitational lenses has discovered low-luminosity LAEs at (Santos et al., 2004), as well as a few candidates at (Stark et al., 2007).
Recently, wider areas have become accessible with multislit narrowband spectroscopy, and LAEs have been found at . Using the Inamori Magellan Areal Camera and Spectrograph (IMACS; Dressler et al. 2006), Martin et al. (2008) carried out a blind spectroscopic search in 200 arcmin2 in the Cosmic Evolution Survey (COSMOS; Scoville et al. 2007) and the 15 hour field of the Las Campanas Infrared Survey (LCIRS; Marzke et al. 1999). These observations reach a sensitivity fainter than (Ly) at ( several erg s-1, as measured by Shimasaku et al. 2006 and Ouchi et al. 2008), and three LAE candidates at were confirmed with further spectroscopy. Following this success, we have carried out a deeper survey in the same fields (Dressler et al., in prep.), uncovering at least several sources at luminosities that were previously only reached with strong lensing searches (Santos et al., 2004).
Of the three sources found by Martin et al. (2008), none are detected in the available continuum imaging, and only one has been previously detected in COSMOS narrow-band imaging (no narrow-band imaging is available in the 15H field). In this paper, we present new imaging of these LAEs from the Near Infrared Camera and Multi-Object Spectrometer (NICMOS; Thompson et al. 1998). These images, obtained through the filter with the NIC2 camera, confirm the presence of the two LAEs in the 15H field. In §2 we present our observations and data reduction, as well as the process by which we match our spectroscopically discovered sources with NICMOS detections. In §3 we discuss the properties of these three LAEs, and §4 contains a summary of our results. We use , , , and AB magnitudes throughout.
2. Observations and Data Reduction
2.1. NICMOS Imaging
Each of the three LAEs were observed for 5 orbits (13.4 ks) with the NICMOS 2 camera. The images were then processed in several steps to make final mosaics. First, images were corrected for the quadrant-dependent variable bias (the “pedestal effect”), and South Atlantic Anomaly (SAA) darks were subtracted from impacted orbits. Next, we used the IRAF task rnlincor to correct for the count-rate dependent non-linearity documented by de Jong (2006). With this approach, the zero point remained unchanged at = 23.69. For our configuration of with NICMOS 2, the non-linearity correction was substantial, and amounted to mag for the = 23 - 26 magnitude sources in our images. Following this correction, the images were sky subtracted, using the NICRED package (McLeod, 1997). Then, the remaining vertical and horizontal bands in the images were removed by subtracting a model sky frame constructed by taking the median of each column and smoothing it by a three pixel wide boxcar. (This step was repeated for rows to remove any top-to-bottom banding or gradients.) After this, we identified bad pixels in the images following the procedures used by the Multidrizzle software (Koekemoer et al., 2002): A truth image was made by aligning the images and creating a median stack. This image was shifted back to the frame of the original input image, and pixels deviant by more than 3 were flagged as bad pixels. Finally, images were combined with drizzle with bad pixels masked using parameters recommended in the Dither Handbook: pixfrac = 0.6, and scale = 0.5. The final output pixels are 0.038″.
The resulting PSF, measured from the two point sources in these images has a FWHM of 0.1″. Sensitivity was measured by randomly placing 0.6″ diameter apertures in the image, rejecting those that fell on sources, and fitting a Gaussian to the ”counts-per-aperture” distribution, as described in Henry et al. (2009). We found a 5 sensitivity of = 26.5 in this aperture. Using the point sources in our images, we measured the aperture correction to be 0.08 magnitudes, so the 5 total sensitivity is = 26.4 (for a point source). Finally, using a few common sources per image, the astrometric solutions to the NICMOS images were aligned with the COSMOS survey for the 10h field, and the SDSS for the 15h field.
2.2. Identifying the LAEs in NICMOS images
The spectroscopic search and confirmation data are presented in Martin et al. (2008), where a difference was discovered between the World Coordinate System (WCS) zero-points of COSMOS and that of our data. Namely, the position of MSDM 80+3 in the COSMOS/Subaru narrow-band imaging is nearly 1″ west of the position found by Martin et al. In light of this offset, we improved our technique for deriving coordinates, by mapping a WCS solution to images taken through our slitmask. We tested these solutions for both the COSMOS and 15H field, using dozens of objects (per field) that have continuum detections in our spectra. We found (1) position uncertainties of 03-05 along the slits, and 10 perpendicular to the slits. The latter uncertainty naturally arises in all blind spectroscopic searches, because sources are not necessarily centered in the slits. For the COSMOS field, the slits are oriented E-W, so these uncertainties correspond to RA and Dec, respectively. For the 15H field the slit PA was -45°.
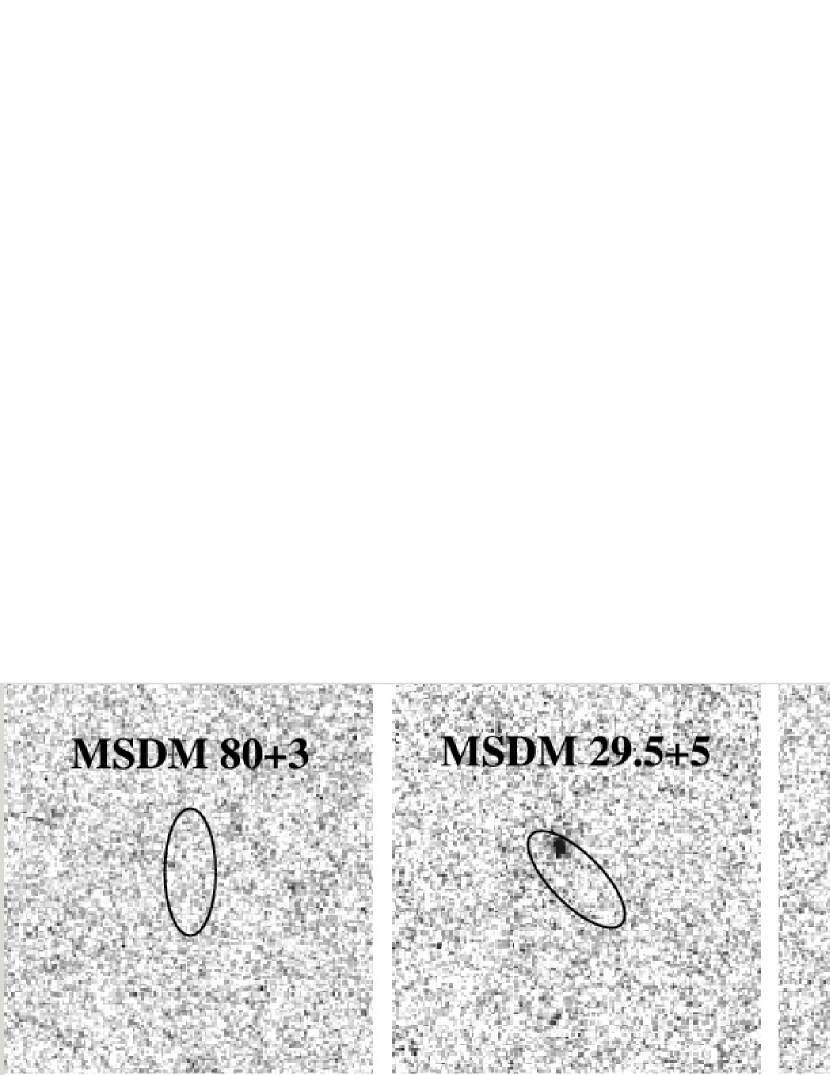
In Figure 1, we show the NICMOS images at the positions of the three LAEs. No obvious source is detected at the position of MSDM 80+3, but sources are detected within the 1 position error ellipse for MSDM 29.5+5 and just outside it for MSDM 71-5. Photometry is presented in Table 4. We used 0.6″ diameter apertures, centered on the positions of the sources shown in Figure 1 for MSDM 29.5+5 and MSDM 71-5, and at the position of the narrowband detection for MSDM 80+3 (see Figure 2). A point source model was adopted for the aperture correction, as explained in §2.1. While more light will be missed from extended sources, this loss amounts to at most 0.1 to 0.3 magnitudes (in addition to the point source aperture correction), as nearly all galaxies have half-light radii, (Bouwens et al., 2004; Ferguson et al., 2004). As we cannot accurately determine the amount of missed flux, we adopt the point source aperture correction of 0.1 magnitudes, and note this systematic uncertainty.
In order to determine whether the sources are likely to be associated with the LAEs, we calculated the probability that the NICMOS detections in the 15H field are from foreground galaxies. To do this we obtained the publicly available catalogs of the NICMOS Ultra-Deep Field555http://archive.stsci.edu/prepds/udf/udf_hlsp.html (Thompson et al., 2005). For consistency with our aperture photometry of the LAEs, we used 06 diameter apertures. To = 26.1, which is the aperture magnitude of the fainter of the two detected sources, we found cumulative number counts of 60 arcmin-2. Therefore, there is less than a one per-cent chance of a foreground interloper falling within our positional error ellipse. For the brighter source, this probability is about 50% lower. We conclude with greater than % confidence that each of the NICMOS detected sources is indeed an LAE discovered by Martin et al. (2008).
2.3. Ly contribution to broadband photometry?
Strong Ly emission can in some cases contribute appreciably to broadband flux density (Schaerer & de Barros, 2010), and for our objects this could happen. At , Ly is included in the wide bandpass, which covers approximately 0.8 to 1.4 µm. However, the contribution is negligible for our objects– our measured Ly fluxes account for only 5-10% of the flux densities for the two detected sources. This enhancement lies within our uncertainties, so no corrections are made to our photometry and equivalent width measurements.
3. Discussion
3.1. MSDM 80+3: Comparison to Narrowband Observations
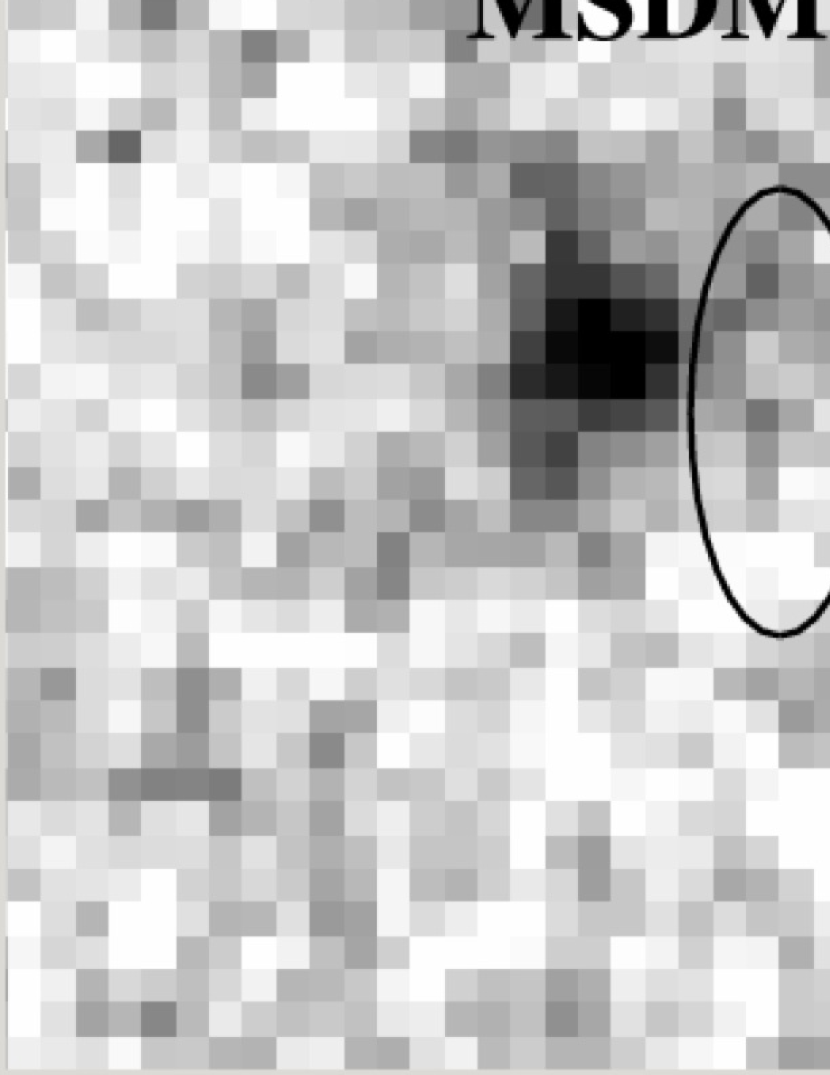
These NICMOS observations provide the first direct images of two sources (MSDM 29.5+5 and MSDM 71-5) which had previously only been detected in our spectroscopic data. On the other hand, the source which is undetected in , MSDM 80+3, shows a strong detection in Subaru narrowband imaging with the NB816 filter (object #55 in Murayama et al. 2007). In Figure 2 we show the narrowband image of MSDM 80+3, with our position error ellipse overlaid. Our improved coordinates for MSDM 80+3 are roughly consistent with the NB816 source in Murayama et al. The newly derived position is 07 west of the NB816 detection, while the previous position given in Martin et al. was 1″ east. This position offset along the slit is still large compared to other sources, including those discussed in §2.2 and for 52 lower redshift line emitters that are in common between Martin et al. and the COSMOS NB816 sample. Given the slight offset perpendicular to the slit (04) shown in Figure 2, one possibility is that the Ly emission from this object is extended, and our slit subtended an outlying region of the galaxy. Some evidence for this hypothesis is present in the Subaru narrowband image (Figure 2), where MSDM 80+3 is marginally resolved.
The absence of continuum emission could indicate that the source is extended in the continuum, although extended Ly emission need not imply a similarly extended stellar continuum. The upper bound of dropout LBG sizes is 02 (in the rest-frame UV; Bouwens et al. 2004), which corresponds to 5.3 pixels in our drizzled NIC2 images. Using the IRAF artdata package, we verified that a galaxy of this size would be undetected in our NICMOS data at . It is tempting to conclude from the low-surface brightness signal at the position of MSDM 80+3 in our NICMOS image that it may be more extended in the rest-frame UV. However, this LAE fell on the bad central column666http://www.stsci.edu/hst/nicmos/performance/anomalies in these observations, and similar artifacts appear at other locations along the column. The weight maps produced by drizzle indicate that noise is % higher at these locations relative to the rest of the image, so the extended feature is not significant. Nevertheless, the non-detection could imply that MSDM 80+3 is more extended in the continuum than the other two LAEs (MSDM 29.5+5 and 71-5), which have half-light-radii (measured with SExtractor) of 015 and 014.
The hypothesis that the Ly emission may be extended is also supported by our line flux measurement, which is a factor of two lower than the Subaru NB816 imaged line flux. This difference is larger than is expected for a point source, unless the object fell on the edge of our 15-wide slit. As noted above, in the narrow-band image coordinates, MSDM 80+3 is 04 north of the slit-center. Using the point source slit loss models from Martin et al. (2008), at this position we expect only about a 20% slit loss. The effect of the non-uniform response of the NB816 filter on SuprimeCam is negligible for MSDM 80+3, because our measured wavelength is near the central wavelength of the NB816 transmission. Furthermore, lines at wavelengths away from the center of the NB816 bandpass would have decreased observed Ly flux relative to our spectroscopic measurement– the opposite of what we observe. Generally, sources found through blind spectroscopy do not fall at the center of the slit; for larger samples the impact of slit-losses on the luminosity function is modeled statistically.
3.2. Properties
Equivalent widths, UV luminosities, and UV continuum derived star formation rates are given in Table 4. We assume a flat UV spectrum (), consistent with observations of LAEs with Ly luminosities and redshifts similar to those of our objects (Pirzkal et al., 2007), and with LBGs in the NICMOS Ultra Deep Field (Stanway et al., 2005; Bouwens et al., 2009). Therefore, although the center of the filter corresponds to Å in the rest frame, our best estimate is that k-corrections are negligible. We note that at (Bouwens et al., 2007), so the UV-luminosities that we measure are consistent with typical sources observed at this redshift– within a factor of two of for the two –detected sources.
Star formation rates (SFRs) are derived using the 1500 Å conversion from Madau et al. (1998). UV-continuum based estimates of star-formation rates are thought to be more reliable than those from Ly; nevertheless, these continuum-based estimates come with several caveats. First, the conversion is valid only when the characteristic stellar age is older than the main sequence lifetime of O- and B-stars. At young ages ( Myrs), the true SFR may be a few times larger. Second, we have not corrected the UV-luminosities for dust extinction, so again, the SFRs given in Table 4 may be underestimated. However, in general, galaxies are not thought to be very dusty (Bouwens et al., 2009), so dust corrections to our SFRs need not be very large. Third, uncertainties in the IMF slope and mass cutoffs may be just as important, as they can change the SFR by a factor of a few (Henry et al., 2009). On the other hand, the two-photon nebular continuum is not expected to make a significant contribution to the UV-luminosity, since it is generally dwarfed by the stellar contribution. While some sources are purported to have spectra dominated by the two-photon continuum, such objects appear to be rare (Fosbury et al., 2003; Raiter et al., 2010), and are predicted to have rest-frame Ly equivalent widths Å (Schaerer 2002, with coefficients from Aller 1984).
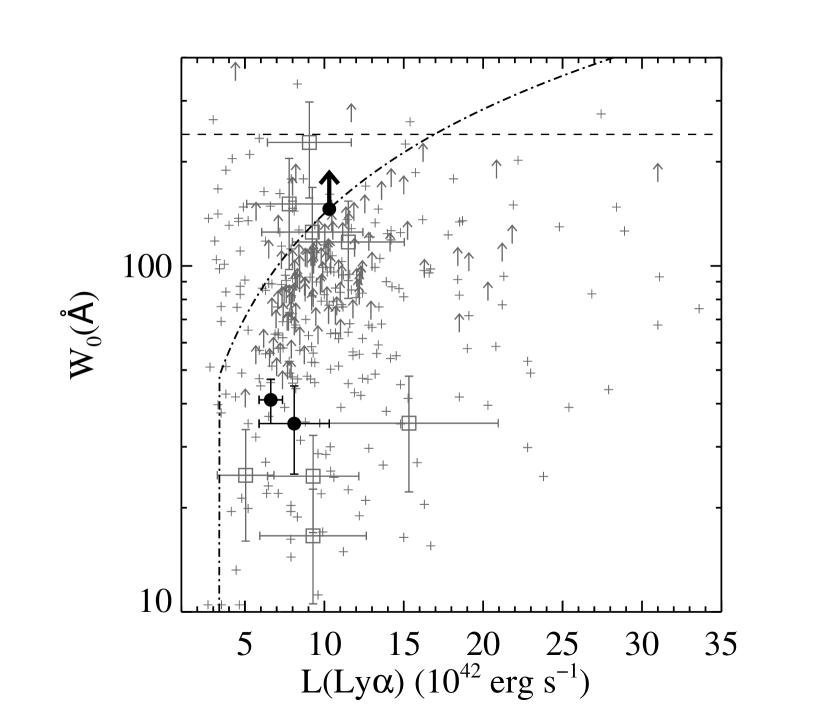
The equivalent widths that we measure are consistent with those of LAEs at high redshift, as shown in Figure 3. We do not make any correction for IGM absorption on the Ly emission, as has been done for some objects at (e.g. Shimasaku et al. 2006). While it is possible that the Ly emission emergent from the galaxy is larger than observed, the amount of attenuation is uncertain because the resonant scattering of Ly photons shifts the emission towards redder wavelengths (Verhamme et al., 2008). It is not surprising that we do not observe any sources that are both UV luminous and have high-equivalent widths. As Nilsson et al. (2009) point out, this may be a consequence of both classes of objects being rare, rather than a correlation of equivalent width with UV luminosity as has been suggested by Ando et al. (2006).
The three LAEs that we present are consistent with the range of equivalent widths that are easily explained by “normal” stellar populations, with ages older than 10 Myrs and a Salpeter IMF. However, deeper continuum observations of MSDM 80+3 could prove that its equivalent width is much larger. There are several different models that can explain very large equivalent widths. First, extremely young ages and/or top-heavy initial mass functions (IMFs) can result in rest-frame equivalent width Å (e.g. Malhotra & Rhoads 2004). Second, a multi-phase interstellar medium has sometimes been invoked to preferentially absorb UV continuum photons (Neufeld 1991; Hansen & Oh 2006; Scarlata et al. 2009; Finkelstein et al. 2009); and third, gravitational cooling radiation in the absence of star formation is predicted to result in Å (Dijkstra 2009). However, such high equivalent width objects are probably rare, as only a few sources in Figure 3 lie at Å. It is important to note that the uncertainty on such high equivalent width sources typically exceeds 100Å because of weak continuum detections, so these measurements should be viewed with caution.
It is interesting to consider whether the LAEs in our survey would be selected as dropout LBGs at , because the connection between the two populations is currently unclear. While it is generally understood that LAEs can be missed by LBG searches when their continuum is too faint, the selection of brighter sources can also be influenced by strong line emission (e.g. Stanway et al. 2007, 2008). At , Ly falls in the -band, and galaxies can sometimes be too blue in to be included in dropout samples, even when an identical galaxy without Ly emission would be included in such a sample. (It is worth noting that such objects could be included in R-dropout samples, provided that the color is not too red.) Strong Ly emission may influence the color selection of all three galaxies presented here. Assuming a flat UV slope (), we estimate and 1.3 for MSDM 29.5 and MSDM 71-5, near the cut used by most LBG studies (e.g. Bouwens et al. 2007). The inclusion of sources such as these would depend on photometric scatter and the true value of the UV slope. On the other hand, MSDM 80+3, which is undetected in the images, would be unlikely to be included in dropout samples. The Ly flux contributes substantially to the band, so even in the absence of any continuum we would expect . Assuming – as inferred from our limit– implies that we would expect . Therefore, even if MSDM 80+3 could be detected in very deep imaging such as the UDF, it would be much too blue to be included in the dropout samples. This exercise emphasizes the importance of including Ly emission in the modeling of LBG selection functions, as is done by Bouwens et al. (2007).
4. Conclusions
Spectroscopic searches for high-redshift emission-line galaxies have now been shown as a viable technique for improving sensitivity to faint emission line galaxies (Santos et al., 2004; Sawicki et al., 2008; Lemaux et al., 2009). In particular, Martin et al. (2008) have successfully identified three LAEs with multislit narrowband spectroscopy. We have presented NICMOS observations of these three LAEs, obtained with the high spatial resolution NIC2 camera. These images confirm the two sources which had only previously been seen in our IMACS spectroscopic observations. Furthermore, the data provide some constraints on the properties of these galaxies. We find that the UV luminosities, star formation rates, equivalent widths and sizes are all consistent with a redshift of . The two detected sources have within a factor of two of (as measured by Bouwens et al. 2007), and equivalent widths are well within the range of values seen at all redshifts. In addition, the non-detection of MSDM 80+3, in combination with a substantial slit-loss of Ly flux suggests that the source may be somewhat extended.
These new observations further prove the success of multislit narrowband spectroscopy as a means to uncover faint, high-redshift emission line galaxies. Further efforts for extending this technique to much fainter LAEs are already underway (Dressler et al., in prep). Longer exposures with the recently upgraded IMACS detectors can reach Ly luminosities at that have previously only been realized in gravitational lensing surveys along the critical lines of galaxy clusters (e.g. Santos et al. 2004). At the limit of our new survey ( at least ), rest-frame equivalent widths above 150 Å would imply a band magnitude fainter than 29- a regime that is currently only accessible from the small area covered by the UDF and UDF Parallels. These new blind spectroscopic observations will provide an ideal sample of low-luminosity LAEs that will be detectable with NIRCAM, NIRSPEC, and the Tunable Filter Imager on the James Webb Space Telescope in modest exposure times ( 10,000 seconds). Such future observations will provide critical insight into the building blocks of galaxies by measuring their stellar and nebular (line+continuum) emission.
| Name | RA | Dec | F(Ly) | SFR | ||||
|---|---|---|---|---|---|---|---|---|
| (J2000) | (J2000) | (AB) | ( erg s-1 cm-2) | (Å) | (AB) | ( yr-1 ) | (″) | |
| MSDM 80+3 | 10 00 30.413 | 02 17 14.81 | 28 aaTaken from the narrow-band imaging measurement (Murayama et al., 2007). | |||||
| MSDM 29.5+5 | 15 22 57.900 | -00 07 36.80 | 26.0 0.1 | 18 2 | 41 | -20.7 | 10 | 0.15 |
| MSDM 71-5 | 15 24 08.920 | -00 10 43.31 | 25.6 0.1 | 22 6 | 35 | -21.1 | 14 | 0.14 |
Note. — magnitudes are total, and equivalent width is given in the rest-frame. Limits are 3, total, for a point source. As discussed in §3.1 the limit on MSDM 80+3 will be weaker if it is significantly extended. Coordinates given are measured from direct images of the sources: NICMOS for MSDM 29.5+5 and MSDM 71-5, and Subaru NB816 for MSDM 80+3. Star formation rates are estimated from the Madau et al. (1998) conversion, but will be higher if extinction is large or the galaxies are extremely young.
References
- Ajiki et al. (2004) Ajiki, M., et al. 2004, PASJ, 56, 597
- Aller (1984) Aller, L. H. 1984, Physics of Thermal Gaseous Nebulae, Astrophysics and Space Science Library, Vol. 112
- Ando et al. (2006) Ando, M., Ohta, K., Iwata, I., Akiyama, M., Aoki, K., & Tamura, N. 2006, ApJ, 645, 9L
- Bouwens et al. (2004) Bouwens, R. J., Illingworth, G. D., Blakeslee, J. P., Broadhurst, T. J., & Franx, M. 2004, ApJ, 611, L1
- Bouwens et al. (2007) Bouwens, R. J., Illingworth, G. D., Franx, M., & Ford, H. 2007, ApJ, 670, 928
- Bouwens et al. (2008) Bouwens, R. J., Illingworth, G. D., Franx, M., & Ford, H. 2008, ApJ, 686, 230
- Bouwens et al. (2010) Bouwens, R. J., Illingworth, G. D., Oesch, P. A., Stiavelli, M., van Dokkum, P., Trenti, M., Magee, D., Labbé, I., Franx, M., Carollo, M., 2010, ApJ709, 133L
- Bouwens et al. (2009) Bouwens, R. J., Illingworth, G. D., Franx, M., Chary, R.-R., Muerer, G. R., Concelise, C. J., Ford, H., Giavalisco, M., & van Dokkum, P. 2009, ApJ, 705, 936
- Bunker et al. (2009) Bunker, A. J., Wilkins, S., Ellis, R., Stark, D., Lorenzoni, S., Chiu, K., Lacy, M., Jarvis, M., Hickey, S. 2009, arXiv:0909.2255
- Charlot & Fall (1993) Charlot, S., & Fall, S. M. 1993, ApJ, 415, 580
- Dawson et al. (2007) Dawson, S., Rhoads, J., Malhotra, S., Stern, D., Wang, J., Dey, A., Spinrad, H., & Jannuzi, B. 2007, ApJ, 671, 122
- de Jong (2006) de Jong, R. S. 2006, NICMOS Instrum. Sci. Rep. 2006-003, (Baltimore: STScI)
- Dijkstra (2009) Dijkstra, M. 2009, ApJ, 690, 82
- Dijkstra et al. (2007) Dijkstra, M., Wyithe, J. S. B., & Haiman, Z. 2007, MNRAS, 379, 259
- Dow-Hygelund et al. (2007) Dow-Hygelund, C. C., Holden, B. P., Bouwens, R. J., Illingworth, G. D., van der Wel, A., Franx, M., van Dokkum, P. G., Ford, H., Rosati, P., Magee, D., & Zirm, A. 2007, ApJ, 660, 47
- Dressler et al. (2006) Dressler, A., et al. 2006, Proc. SPIE, 6269, 13
- Dunkley et al. (2009) Dunkley, J., et al. 2009, ApJS, 180, 306
- Eyles et al. (2005) Eyles, L. P., Bunker, A. J., Stanway, E. R., Lacy, M., Ellis, R. S., Doherty, M. 2005, MNRAS, 364, 443
- Eyles et al. (2007) Eyles, L. P., Bunker, A. J., Ellis, R. S., Lacy, M., Stanway, E. R., Stark, D. P., & Chiu, K. 2007, MNRAS, 374, 910
- Fan et al. (2006) Fan, X., Carilli, C. L., & Keating, B. 2006, ARA&A, 44, 415
- Ferguson et al. (2004) Ferguson, H. C., et al. 2004, ApJ, 600, 107L
- Finkelstein et al. (2009) Finkelstein, S. L., Rhoads, J. E., Malhotra, S., & Grogin, N. 2009, ApJ, 694, 465
- Finkelstein et al. (2008) Finkelstein, S. L., Rhoads, J. E., Malhotra, S., Grogin, N., & Wang, J. 2008, ApJ, 678, 655
- Finkelstein et al. (2007) Finkelstein, S. L., Rhoads, J. E., Malhotra, S., Pirzkal, N., & Wang, J. 2007, ApJ, 660, 1023
- Fosbury et al. (2003) Fosbury, R. A. E., et al. 2003, ApJ, 596, 797
- Fruchter & Hook (1997) Fruchter, A., & Hook, R. N. 1997, Proc. SPIE, 3164, 120
- Furlanetto et al. (2006) Furlanetto, S. R., Zaldarriaga, M., & Hernquist, L. 2006, MNRAS, 365, 1012
- Gawiser et al. (2006) Gawiser, E., et al. 2006, ApJ, 642, L13
- Gawiser et al. (2007) Gawiser, E., et al. 2007, ApJ, 671, 278
- Gronwall et al. (2007) Gronwall, C., et al. 2007, ApJ, 667, 79
- Haiman & Cen (2005) Haiman, Z., & Cen, R. 2005, ApJ, 623, 627
- Hansen & Oh (2006) Hansen, M., Oh, P. S. 2006, MNRAS, 367, 979
- Henry et al. (2009) Henry, A. L., et al. 2009, ApJ, 697, 1128
- Hu et al. (2002) Hu, E., et al. 2002, ApJ, 568, L75
- Hu et al. (2004) Hu, E., et al. 2004, AJ, 127, 563
- Kashikawa et al. (2006) Kashikawa, N., et al. 2006, ApJ, 648, 7
- Koekemoer et al. (2002) Koekemoer, A. M., Fruchter, A. S., Hook, R. N., & Hack, W. 2002, in HST Calibration Workshop, ed S. Arribas, A. M. Koekemoer, & B. Whitmore (Baltimore:STScI), 337
- Kornei et al. (2010) Kornei, K. A., Shapley, A. E., Erb, D. K., Steidel, C. C., Reddy, N. A., Pettini, M., & Bogosavljević, M. 2010, ApJ, 711, 693
- Lai et al. (2008) Lai, K., et al. 2008, ApJ, 674, 70L
- Lemaux et al. (2009) Lemaux, B. C., Lubin, L. M., Sawicki, M., Martin, C., Lagattuta, D. J., Gal, R. R., Kocevski, D., Fassnacht, C. D., Squires, G. K. 2009, ApJ, 700, 20
- Madau et al. (1998) Madau, P., Pozetti, L., & Dickinson, M. 1998, ApJ, 498, 106
- Malhotra & Rhoads (2002) Malhotra, S., & Rhoads, J. E. 2002, ApJ, 565, L71
- Malhotra & Rhoads (2004) Malhotra, S., & Rhoads, J. E. 2004, ApJ, 617, L5
- Martin et al. (2008) Martin, C. L.,. Sawicki, M., Dressler, A., & McCarthy, P. 2008, ApJ, 679, 942
- Martin & Sawicki (2004) Martin, C. L., & Sawicki, M. 2004, ApJ, 603, 414
- Marzke et al. (1999) Marzke, R. O., et al. 1999, in ASP Conf. Ser. 191, Photometric Redshifts and the Detection of High Redshift Galaxies, ed. R. Weymann, L. Storrie-Lombardi, M. Sawicki, & R. Brunner (San Francisco: ASP), 148
- McLeod (1997) McLeod, B. A. 1997, NICRED: Reduction of NICMOS MULTIACCUM Data with IRAF, in ”The 1997 HST Calibration Workshop with a new generation of instruments”, eds. Casertano, S., Jedrzejewski, R., Keyes, C. D., & Stevens, M., p. 281
- McLure et al. (2009) McLure, R. J., Cirasuolo, M., Dunlop, J. S., Foucaud, S., & Almaini, O. 2009, MNRAS, 395, 2196
- McQuinn et al. (2007) McQuinn, M., Hernquist, L., Zaldarriaga, M., Dutta, S. 2007, MNRAS, 381, 75
- Meier (1976) Meier, D. L. 1976, ApJ, 203, L103
- Murayama et al. (2007) Murayama, T., et al. 2007, ApJS, 172, 523
- Neufeld (1991) Neufeld, D. A. 1991, ApJ, 370, 85L
- Nilsson et al. (2007) Nilsson, K. K., Møller, P., Möller, O., Michałowski, Watson, D., Ledoux, C., Rosati, P., Pedersen, K., & Grove, L. F. 2007, A&A, 471, 71
- Nilsson et al. (2009) Nilsson, K. K., Möller-Nilsson, O., Møller, P., Fynbo, J. P. U. & Shapley, A. E. 2009, arXiv:0907.3733
- Ouchi et al. (2008) Ouchi, M., et al. 2008, ApJS, 176, 301
- Ouchi et al. (2009) Ouchi, M., et al. 2009, ApJ, 696, 1164
- Pirzkal et al. (2007) Pirzkal, N., Malhotra, S., Rhoads, J. E., & Xu, C., ApJ, 667, 49
- Raiter et al. (2010) Raiter, A., Fosbury, R. A. E., & Teimoorinia, H. 2010, A&A, 510, 109
- Rauch et al. (2008) Rauch, M. R., et al. 2008, ApJ, 681, 586
- Rhoads et al. (2004) Rhoads, J., Xu, C., Dawson, S., Dey, A., Malhotra, S., Wang, J., Jannuzi, B. T., Spinrad, H., & Stern, D. 2004, ApJ, 611, 59
- Ryan-Weber et al. (2009) Ryan-Weber, E. V., Pettini, M., Madau, P., & Zych, B. J. 2009, MNRAS, 395, 1476
- Santos (2004) Santos, M. R. 2004, MNRAS, 349, 1137
- Santos et al. (2004) Santos, M. R., Ellis, R. S., Kneib, J.-P., Richard, J., & Kuijken, K. 2004, ApJ, 606, 683
- Sawicki et al. (2008) Sawicki, M., Lemaux, B. C., Guhathakurta, P., Kirby, E. N., Konidaris, N. P., Martin, C. L., Cooper, M. C., Koo, D. C., Newman, J. A., & Weiner, B. J. 2008, ApJ, 687, 884
- Scarlata et al. (2009) Scarlata, C., Colbert, J., Teplitz, H. I., Panagia, N., Hayes, M., Siana, B., Rau, A., Francis, P., Caon, A., Pizzella, A., & Bridge, C. 2009, ApJ, 704, 98L
- Schaerer (2002) Schaerer, D. 2002, A&A, 382, 28
- Schaerer & de Barros (2010) Schaerer, D., & de Barros, S., 2010, A&A, in press
- Scoville et al. (2007) Scoville, N., et al. 2007, ApJS, 172, 1
- Shapley et al. (2003) Shapley, A. E., Steidel, C. C., Pettini, M., & Adelberger, K. L. 2003, ApJ, 588, 65
- Shimasaku et al. (2006) Shimasaku, K., et al. 2006, PASJ, 58, 313
- Simcoe (2006) Simcoe, R. 2006, ApJ, 653,977
- Stanway et al. (2007) Stanway, E. R., Bunker, A. J., Glazebrook, K., Abraham, R. G., Rhoads, J., Malhotra, S., Crampton, D., Colless, M., & Chiu, K. 2007, MNRAS, 376, 727
- Stanway et al. (2008) Stanway, E. R., Bremer, M. N., & Lehnert, M. D. 2008, MNRAS, 385, 493
- Stanway et al. (2005) Stanway, E. R., McMahon, R. G., & Bunker, A. J. 2005, MNRAS, 359, 1184
- Stark et al. (2007) Stark, D. P., Ellis, R. S., Richard, J., Kneib, J.-P., Smith, G. P., & Santos, M. R. 2007, ApJ, 663, 10
- Stark et al. (2010) Stark, D. P., Ellis, R. S., Chiu, K., Ouchi, M., & Bunker, A., arXiv:1003.5244
- Steidel et al. (1996) Steidel, C. C., Giavalisco, M., Pettini, M., Dickinson, M., & Adelberger, K. L. 1996, ApJ, 462, 17L
- Taniguchi et al. (2009) Taniguchi, Y., et al. 2009, ApJ, 701, 915
- Thompson et al. (1998) Thompson, R. I., Reike, M., Schneider, G., Hines, D. C., & Corbin, M. R. 1998, ApJ, 492, L95
- Thompson et al. (2005) Thompson, R. I., et al. 2005, AJ, 130, 1
- Tran et al. (2004) Tran, K.-V H., Lilly, S. J., Crampton, D., & Brodwin, M. 2004, ApJ, 612, L89
- Vanzella et al. (2009) Vanzella, E., et al. 2009, ApJ, 695, 1163
- Verhamme et al. (2008) Verhamme, A., Schaerer, D., Atek, H., & Tapken, C. 2008, A&A, 491, 89
- Wang et al. (2009) Wang, J.-X., Maholtra, S., Rhoads, J. E., Zhang, H.-T., Finkelstein, S. 2009, arXiv:0907.0015
- Westra et al. (2006) Westra, E., Jones, D. H., Lidman, C. E., Meisenheimer, K., Athreya, R. M., Wolf, C., Szeifert, T., Pompei, E., & Vanzi, L. 2006, A&A, 455, 61
- Yan et al. (2006) Yan, H., Dickinson, M., Giavalisco, M., Stern, D., Eisenhardt, P. R. M., Ferguson, H. C. 2006, ApJ, 651, 24