Doppler images of the RS CVn binary II Pegasi during the years 1994-2002
Abstract
Aims. We publish 16 Doppler imaging temperature maps for the years 1994–2002 of the active RS CVn star II Peg. The six maps from 1999-2002 are based on previously unpublished observations. Through Doppler imaging we want to study the spot evolution of the star and in particular compare this with previous results showing a cyclic spot behaviour and persistent active longitudes.
Methods. The observations were collected with the SOFIN spectrograph at the Nordic Optical Telescope. The temperature maps were calculated using a Doppler imaging code based on Tikhonov regularization.
Results. During 1994-2001, our results show a consistent trend in the derived longitudes of the principal and secondary temperature minima over time such that the magnetic structure appears to rotate somewhat more rapidly than the orbital period of this close binary. A sudden phase jump of the active region occured between the observing seasons of 2001 and 2002. No clear trend over time is detected in the derived latitudes of the spots, indicating that the systematic motion could be related to the drift of the spot generating mechanism rather than to differential rotation. The derived temperature maps are quite similar to the ones obtained earlier with a different methods, the main differences occurring in the spot latitudes and relative strength of the spot structures.
Conclusions. We observe both longitude and latitude shifts in the spot activity of II Peg. However, our results are not consistent with the periodic behaviour presented in previous studies.
Key Words.:
stars: activity, imaging, starspots, HD 2240851 Introduction
Studying starspots helps us to better understand the magnetic activity and related phenomena both in the Sun and magnetically more active stars. The two most common methods to study starspots are Doppler imaging and time series analysis of photometry. With the Doppler imaging method we can calculate surface temperature maps of the star. The method is based on the fact that starspots on the surface cause changes in photospheric absorption lines (Vogt & Penrod 1983; Piskunov 2008).
Suitable absorption lines for Doppler imaging of late-type stars are neutral metal lines (e.g. Fe I, Ni I, Ca I) in the wavelength range 6000 Å– 7500 Å. Important input parameters for Doppler imaging are the projected rotational velocity, surface gravity, inclination, microturbulence and orbital parameters.
II Pegasi (HD 224085) is one of the very active RS CVn stars. RS CVn stars are closely detached binaries where the more massive component is a G-K giant or subgiant and the secondary usually a subgiant or dwarf of spectral class G to M (Huenemoerder et al. 2001). Because of the low luminosity of the secondary, many RS CVn systems appear as single-line binaries making their spectral analysis easier. In close binaries the rapid rotation is maintained by tidal forces due to the close companion. Large amplitude brightness variation of RS CVn stars imply the presence of enormous starspots on their surfaces covering up to 50% of the visible disk. Dynamos of active stars appear to produce more high-latitude spots and larger spots than inactive stars (Saar & Baliunas 1992). Also coronal X-ray and microwave emissions, strong flares in the optical, UV, radio and X-ray are observed.
Cool spots on the stellar surface will locally alter the photospheric absorption lines and continuum intensities. Through Doppler imaging these rotationally modulated distortions can be inverted into temperature maps (Vogt et al., 1987). Even though Doppler imaging is a powerful method to study stellar surfaces in detail, the results should always be interpreted critically. The method sufferes from difficulties in modelling spectral lines in late-type stars. Any errors in e.g. the stellar and spectral parameters will result in systematic errrors in the results (Hackman et al. 2001).
II Pegasi has been spectroscopically monitored for almost 19 years with the SOFIN spectrograph at NOT, La Palma, Spain. Previous studies of the surface temperature distribution of II Peg include the papers of Berdyugina et al. (1998a), who presented surface temperature maps for 1992-1996, and Bergyugina et al. (1999b) with surface maps for 1996-1999. Both studies were based on observations with the SOFIN spectrograph at NOT. Gu et al. (2003) presented surface images of II Peg for 1999-2001 based on observations with the Coude échelle spectrograph at the Xinglong station of the National Astronomical Observatories, China, but the spectral lines used for inversions were different from those of the SOFIN observations.
Photometric light curve variations of the star were analysed by Berdyugina & Tuominen (1998), and by Rodonò et al. (2000). Berdyugina et al. (1998a,b, 1999a,b) and Berdyugina & Tuominen (1998) present results that there were two active longitudes separated approximately by 180∘, migrating in the orbital reference frame, and that a switch of activity level occurs periodically with a period of about 4.65 years. In the surface images of Gu et al. (2003) the general spot pattern was quite similar, but the drift with respect of the orbital frame was less obvious, and the switch of the activity level appeared to occur earlier than predicted by Berdyugina et al. Rodonò et al. (2000) found a much more complicated spot pattern from their analysis of photometry: they report the existence of a longitudinally uniformly distributed component together with three active longitudes, with complicated cyclic behavior.
Spectropolarimetric observations in four Stokes parameters provide a new basis for Doppler imaging techniques (cf. Semel 1989 and Piskunov 2008). Time series of high resolution spectropolarimetric observations have succesfully been used for retrieving maps of the surface magnetic field for both late type stars, with temperature spots (Piskunov, 2008; Carroll et al. 2009) and Ap stars with chemical abundance spots (Kochukhov et al. 2006). Carroll et al. (2009) applied a Zeeman-Doppler imaging technique to derive the magnetic field configuration on the surface of II Peg during 2007 using spectropolarimetric (Stokes I and V) observations with SOFIN. Their maps show a very similar spot pattern as the one found by Berdyugina et al. (1998b, 1999b); moreover, the radial field direction was opposite on different active longitudes.
2 Spectroscopic observations with SOFIN
II Peg is part of our long-term observational projects. The time series of almost 19 years of observations of II Peg is unique. For this study we used high resolution spectra of II Peg measured in August 1994, July 1995, July 1996, October 1996, June 1997, August 1997, December 1997, July 1998, October 1998, November 1998, July-August 1999, September 1999, October 1999, August 2001, August 2002 and November 2002. All the observations were made using the SOFIN high resolution échelle spectrograph at the 2.6 m Nordic Optical Telescope (NOT), La Palma, Spain. The data were acquired with the 2nd camera equipped with a EEV CCD detector of 1152770 pixels, and fron January 2002 a new Loral one with 2048x2048 and the higher quantum efficiensy. The spectral region 6160-6210 was chosen for Doppler imaging. The observations are summarized in Table 1-3.
The spectral observations were reduced with the 4A software system (Ilyin 2000). Bias, cosmic ray, flat field and scattered light corrections, wavelength calibration and normalization and corrections for the motion of the Earth were included in the reduction process.
3 The Doppler imaging technique
Doppler imaging utilizes the fact that under rapid rotation surface spots will induce bumps in the rotationally broadened absorption line profiles. As the star rotates, these bumps will move across the line profiles. Using a set of observations distributed over the rotational phases we can solve the inverse problem and search for such a temperature distribution that reproduces the observations (Vogt et al. 1987).
We use the Doppler imaging technique developed by Piskunov (the code INVERS7, Piskunov et al. 1990; Piskunov 1991). In this method the otherwise ill-posed inversion problem is solved by Tikhonov regularization. In practice this means introducing an additional structure constraint minimizing the surface gradient of the solution. The Doppler imaging solution is retrieved using a table of calculated local line profiles for different surface positions (limb angles) and different effective temperatures. The local line profiles are calculated using numerical models of stellar atmospheres. In the analysis presented here, we used the stellar model atmospheres of Kurucz (1993) with temperatures 3000 – 6000 K and gravity .
The stellar parameters used in the inversions were chosen mostly according to Berdyugina et al. (1998b), and read kms-1, =3.5 kms-1, =6.724333 d, =22.6 kms-1, .
The following spectral lines were used in the surface temperature inversions: Fe I 6173.0050 Å, Ni I 6175.3600 Å, Ni I 6176.8070 Å, Ni I 6177.2560 Å, and Fe I 6180.2030 Å. All these lines are actually blends of lines. All in all we included 30 lines within the wavelength range 6172–6182 Å in the analysis. Spectral line parameters were obtained from the Vienna Atomic Line Database (Kupka et al. 1999). Solar element abundance values and standard spectral parameters were used as a starting point. A preliminary analysis showed, that in particular the Ni abundance had to be adjusted from the solar value of to . The values of two included Ni I lines were modified from the standard values of to (Ni I 6175.360 Å) and (Ni I 6176.807 Å) as the standard values were found to produce a wrong balance between these lines.
4 Results
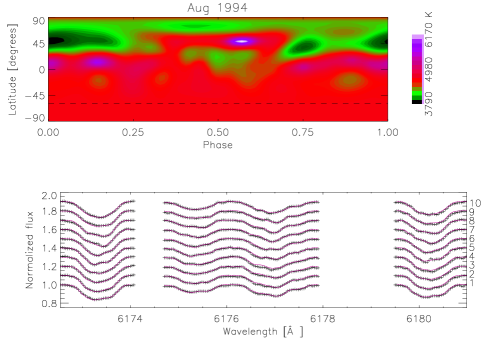
Figures 1-17 show the results of the inversions; in Figs. 1-16, we show the derived temperature maps, and in Fig. 17, the derived longitudes (actually rotation phases, left panel) and latitudes (right panel) versus time.
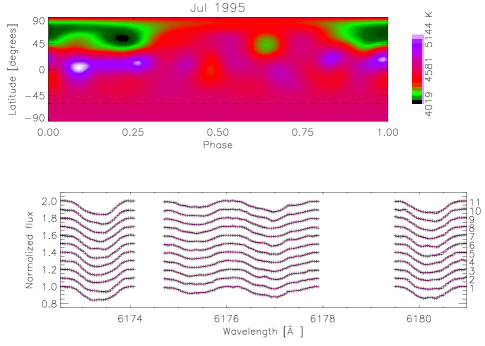
During August 1994 (Fig. 1) an extended spot structure is visible, located at mid-latitudes. The primary minimum of the temperature occurs nearly at phase 0.06, and a secondary minimum roughly at the phase 0.77. Our map is in reasonable agreement with the one of Berdyugina et al. (1998a) from the same observations. Roughly 11 months later (July 1995, Fig. 2), the extended structure is still visible, although located at somewhat higher latitudes and apparently shifted by 0.2 in phase. The temperature minima are not so pronounced as in 1994, and the deeper minimum is now located roughly at 0.22, and the secondary one roughly at the position of the former primary minimum at 0.025. Again, the main features are similar to the maps derived by Berdyugina et al. (1998a); this is to be expected, as identical observations have been used.
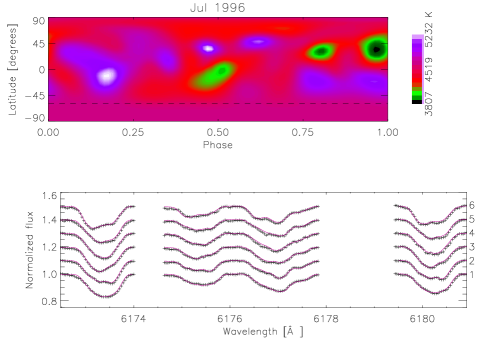
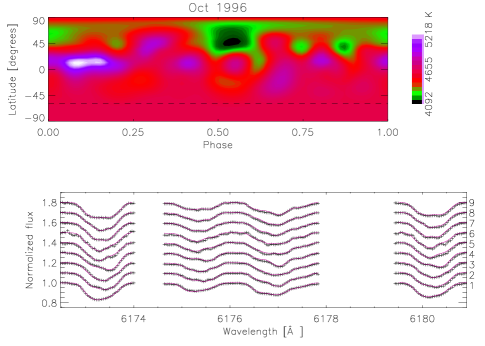
During the observing run of July 1996 (Fig. 3), the phase coverage is rather poor. The extended structure that persisted during the 1994 and 1995 observations is no longer visible; the cool regions are now seen in the form of smaller spots at relatively low latitudes. The primary minimum of temperature occurs approximately at the phase 0.97 and latitude 35 degrees. The other two spots located at phases 0.78 and 0.5 are less significant, and therefore we leave them out of Fig. 17. A few months later (October 1996, Fig. 4), cool regions can be seen at approximately same locations. Their relative strength, however, has dramatically changed: the former deepest minimum now appears as almost insignificant, while the formerly weakest structure at 0.5 is now clearly the strongest and largest one at 0.51. The strongest minimum appears at somewhat higher latitude than in July; the time between the observing runs is short, due to which the difference in the principal temperature minimum longitude cannot be explained by differential rotation due to changing latitude. A more likely explanation is related to short time-scale changes of the activity level of the spots.
Our maps for July and October 1996 are not in a very good agreement with the ones obtained by Berdyugina et al. (1998a): their maps showed two spots, the principal one being located within phases 0.8-1.0 for both July and October 1996. Concerning the maps of July 1996, Berdyugina et al. had additional data from the Crimean Coudé spectrograph, so their phase coverage was better. For October 1996, the data sets were, however, identical, except one observation with very poor signal to noise ratio included in our inversion but excluded in theirs.
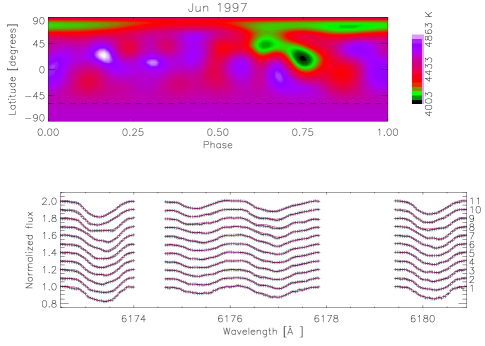
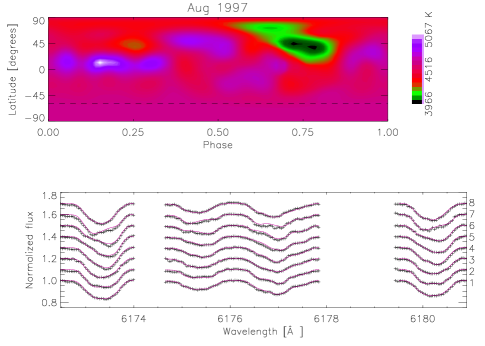
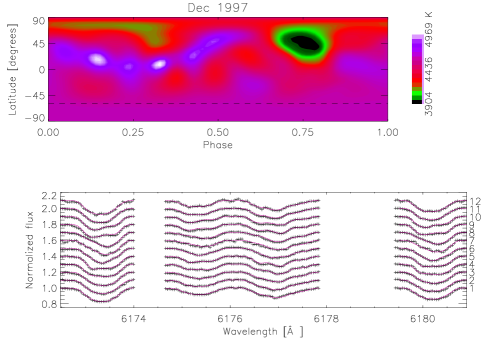
During the observing seasons of 1997 (June, Fig. 5; August, Fig. 6; December, Fig. 7), the activity is concentrated around the phase 0.75 in all the three maps. During June 1997, the spot structure is more elongated towards lower phases, the principal minimum being at a fairly low latitude of 21 degrees. In August 1997 the structure is still similarly elongated, but a general trend is that the whole structure is located somewhat higher in latitude (39 degrees). In December 1997, the lowest temperature is still around the same phase, but it has moved towards higher latitudes (44 degrees). The principal temperature minimum we have recovered matches well the one obtained by Berdyugina et al. (1999b) from identical observations (except for the phase 0.92 missing from our analysis during June 1997). In their maps, however, a clear secondary minimum can be observed around the phase 0.25, almost entirely absent in our maps. The spots are also consistently at higher latitudes in Berdyugina et al. maps than in ours.
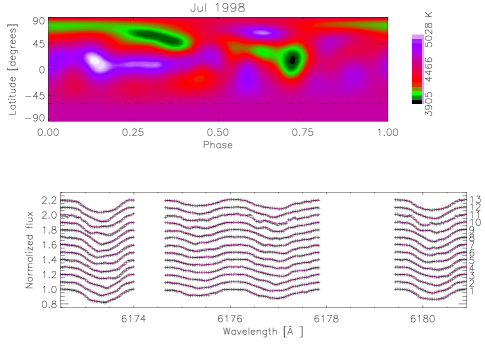
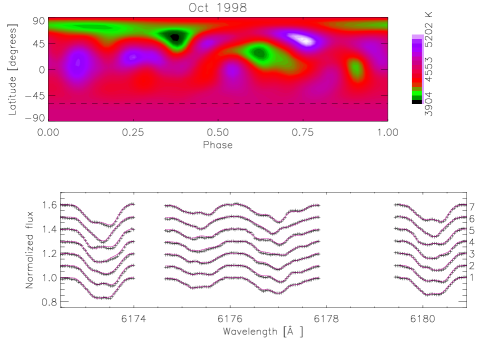
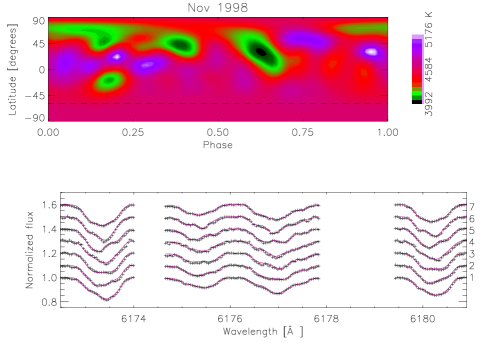
In July 1998 (Fig. 8) the primary spot structure, half a year earlier located at phase 0.75, has clearly decreased in magnitude, while the weaker structure, now at phase 0.38, has grown stronger, the structures being nearly of the same strength in July 1998. The principal minimum has rather a low latitude of 21 degrees, while the secondary minimum occurs higher, at the latitude 48. A similar configuration is seen in the map for October 1998 (Fig. 9), although the structures have moved closer to each other in longitude (phases 0.38 and 0.62), and swapped their strength relative to each other. In November 1998 (Fig. 10), however, the spot structure at the phase 0.62 is again stronger - in our maps, the relative strength of the spot structures is much more variable than in the maps of Berdyugina et al. (1999b), who report only one change of the relative strengths having occurred between the observing seasons of Dec 1997 and Jul 1998, (flip-flop phenomenon). We also note that the phase coverage for the observing seasons is poor for October and November 1998.
Signs of peculiar apparently bright features, possibly related to outbursts such as stellar flares, can be seen as “absorption dips” in the spectra at phase 0.78 in October (label 6 in Fig. 9) and phase 0.55 in November 1998 (label 4 in Fig. 10. Therefore, these maps may be regarded as less reliable than for July 1998. Flares on II Peg in the optical spectral lines have been reported several times (Berdyugina et al., 1999a) and the surface patterns might change, including positions of the active regions, during optical flare events.
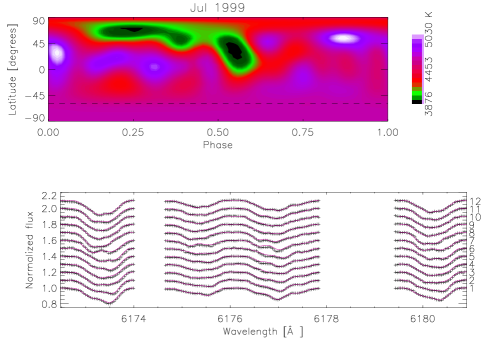
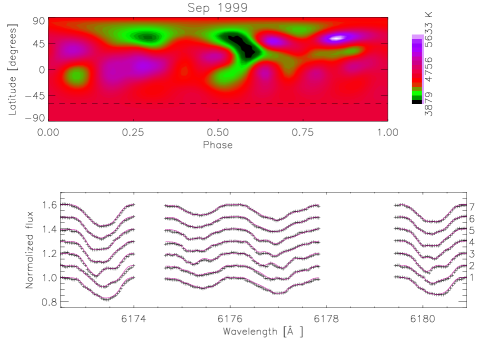
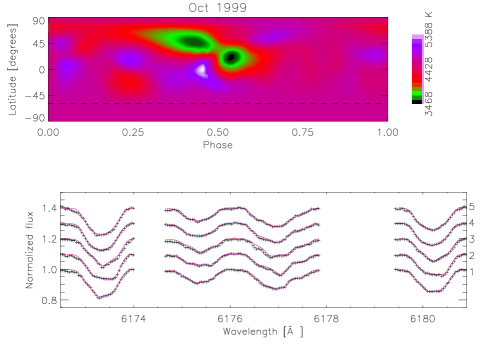
During the year 1999 (July-August 1999 Fig. 11, September 1999 Fig. 12 and October Fig. 13) an extended spot structure is seen in all maps, roughly in between the phases 0.2 and 0.6. The minimum temperature occurs around the phase 0.55 in all three maps, and its latitude is relatively low. A secondary wing-like structure is also visible, located at higher latitudes (72 degrees) and at the phase 0.24 during July 1999. In September, this structure has moved towards lower latitudes (53 degrees) and higher phase (0.27), and in October, even further in the same directions (latitude of 43 degrees and phase 0.39). We note that the phase coverage of the September and October observing runs is quite poor, so these maps are not as reliable as the July-August 1999 map.
According to the flip-flop phenomenon presented in Berdyugina et al. (1999b), the highest activity should have occured near the phase zero during the year 1999 (see the dashed line approximating the path of the stronger active longitude in their Fig. 6). We find no spots near that phase. Moreover, the deepest temperature minimum occurs near the secondary minimum branch of Berdyugina et al. (1999b). Therefore, no clear support for the flip-flop phenomenon with the spot cycle proposed by Berdyugina et al. (1999b) can be found from our maps.
Gu et al. (2003) have also published temperature maps for the same epoch, from a different observational facility and Doppler imaging method. During July and August 1999, they found an extended high-latitude structure between the phases (0.35 and 0.75), the primary minimum being located near the phase 0.4, the secondary one at roughly the phase 0.75. The location of the primary minimum matches well the one derived from our maps; the position of the secondary one, however, is different by 180 degrees.
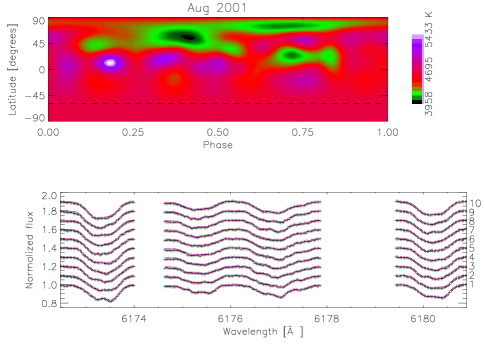
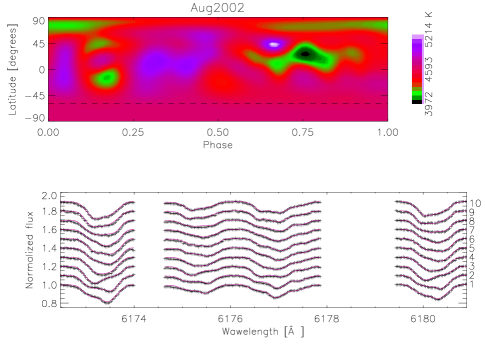
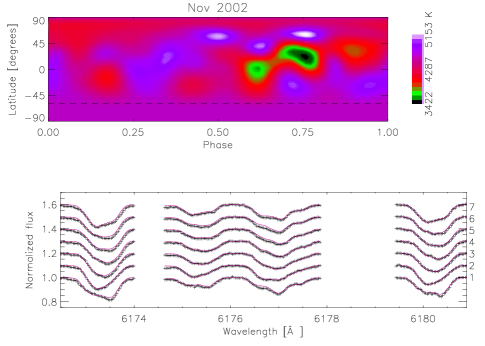
Roughly 22 months later, in August 2001, (Fig. 14) the primary spot is still quite close to the phase which it had during the 1999 observing seasons (moved from the phase of 0.55 to 0.42). The latitude of the primary spot is somewhat higher in 2001, namely 53 degrees. One year later, in August 2002, the deepest temperature minimum has moved to the phase 0.75, where it seems to persist also in the map from the November 2002 observations. This appears as a sudden jump in the left panel of Fig. 17 in an otherwise continuous trend in the spot locations more or less consistent with a stable spot structure moving in the orbital frame with a slightly shorter period (more rapidly).
In the right panel of Fig. 17 we plot the latitudes of the spot structures as a function of time. No systematic trends are visible in this plot, indicating that the systematic change of the spot positions during 1994-2001 cannot be attributed to differential rotation of spots at different latitudes. The spots seen in the maps of 2002, however, show clearly lower latitudes than during 2001. For a solar-type differential rotation pattern (equator rotates more rapidly than the pole), such a change in latitude would result in a speed up in the rotation of the spot structure; now the spot structure seems to be slowing down with respect to the systematic trend. Therefore, at least for solar-type differential rotation laws, the change in latitude is not a very likely cause of the sudden change in the longitudinal position.
The maps of Gu et al. (2003) for February 2000 and November 2001 reveal a systematic drift of the primary spot location towards higher phases. Although the maps are not exactly of the same time epochs, their trend seems to be consistent with the one we see.


5 Conclusions
In the present paper we give 16 surface images of II Pegasi for the years 1994-2002, the 6 latest ones being based on yet unpublished SOFIN@NOT observations. The earlier observations, analysed with a different Doppler imaging method, have already been published by Berdyugina et al. (1998a, 1999b).
All in all our maps show quite good resemblance to the ones obtained by Berdyugina et al. (1998a) and (1999b) with a different method. The main differences between our results to the ones of Berdyugina et al. are the consistently lower spot latitudes in our results. Some differences are also seen in the relative strength of the spot structures, even during epochs when almost identical observational data was used. Partly due to this, no definite signs of a flip-flop event in between December 1997 and July 1998 can be seen.
In contrast, the derived spot positions from our maps are consistent with a systematic drift of the spot structures in the orbital frame during (1994-2001). The spot generating structure seems to be rotating somewhat more rapidly than the binary system. Between the observing seasons of 2001 and 2002, a sudden jump of spot locations towards larger phases has occured. This is more consistent with the trend seen by Gu et al. (2003) from a different set of observations for 1999-2001. As no systematic change in the spot latitudes over time can be seen, we cannot attribute this jump being related to differential rotation. Some fast changes might be a consequence of a sudden outburst like a flare.
| HJD | Phase | S/N | Label | HJD | Phase | S/N | Label |
|---|---|---|---|---|---|---|---|
| 2440000+ | 2450000+ | ||||||
| August 1994 | July 1995 | ||||||
| 9578.6835 | 0.3690 | 286 | 3 | 9910.6629 | 0.7388 | 386 | 8 |
| 9579.6544 | 0.5134 | 273 | 5 | 9911.6449 | 0.8849 | 357 | 10 |
| 9580.6080 | 0.6552 | 285 | 7 | 9912.6448 | 0.0336 | 299 | 1 |
| 9581.5425 | 0.7941 | 321 | 9 | 9913.6311 | 0.1802 | 293 | 2 |
| 9582.5406 | 0.9426 | 251 | 10 | 9914.6525 | 0.3321 | 332 | 4 |
| 9583.6266 | 0.1041 | 353 | 1 | 9915.6549 | 0.4812 | 295 | 6 |
| 9584.6549 | 0.2570 | 371 | 2 | 9916.6640 | 0.6313 | 273 | 7 |
| 9585.6606 | 0.4066 | 391 | 4 | 9917.6137 | 0.7725 | 251 | 9 |
| 9586.6594 | 0.5551 | 425 | 6 | 9918.6255 | 0.9230 | 273 | 11 |
| 9587.6787 | 0.7067 | 293 | 8 | 9920.6676 | 0.2267 | 320 | 3 |
| 9921.6362 | 0.3707 | 258 | 5 |
| HJD | Phase | S/N | Label | HJD | Phase | S/N | Label |
|---|---|---|---|---|---|---|---|
| 2450000+ | 2450000+ | ||||||
| July 1996 | October 1996 | ||||||
| 293.6544 | 0.6949 | 273 | 4 | 381.3800 | 0.7409 | 242 | 7 |
| 294.6784 | 0.8472 | 198 | 5 | 382.4175 | 0.8952 | 264 | 9 |
| 295.6166 | 0.9867 | 228 | 6 | 383.4008 | 0.0414 | 282 | 1 |
| 297.6716 | 0.2923 | 253 | 1 | 384.3821 | 0.1873 | 274 | 2 |
| 298.6767 | 0.4418 | 302 | 2 | 385.4396 | 0.3446 | 259 | 3 |
| 299.6952 | 0.5932 | 253 | 3 | 386.4171 | 0.4900 | 275 | 4 |
| 387.4776 | 0.6477 | 163 | 5 | ||||
| 387.5683 | 0.6612 | 94 | 6 | ||||
| 388.3760 | 0.7813 | 286 | 8 | ||||
| June 1997 | August 1997 | ||||||
| 617.6833 | 0.8822 | 225 | 10 | 676.7269 | 0.6628 | 249 | 5 |
| 618.7239 | 0.0369 | 153 | 1 | 677.7541 | 0.8156 | 112 | 7 |
| 619.6745 | 0.1784 | 216 | 3 | 678.7250 | 0.9599 | 191 | 8 |
| 620.6783 | 0.3276 | 307 | 5 | 679.7443 | 0.1116 | 234 | 1 |
| 621.6597 | 0.4736 | 293 | 7 | 680.7498 | 0.2611 | 179 | 2 |
| 622.7085 | 0.6296 | 285 | 8 | 681.7510 | 0.4099 | 160 | 3 |
| 623.7143 | 0.7791 | 236 | 9 | 682.7517 | 0.5588 | 224 | 4 |
| 624.6985 | 0.9255 | 329 | 11 | 683.7536 | 0.7078 | 175 | 6 |
| 625.6800 | 0.0715 | 277 | 2 | ||||
| 626.7049 | 0.2239 | 298 | 4 | ||||
| 627.6788 | 0.3687 | 301 | 6 | ||||
| December 1997 | |||||||
| 794.3720 | 0.1584 | 249 | 3 | ||||
| 795.3692 | 0.3067 | 218 | 4 | ||||
| 796.3834 | 0.4575 | 179 | 6 | ||||
| 802.4216 | 0.3555 | 208 | 5 | ||||
| 804.3410 | 0.6409 | 66 | 7 | ||||
| 804.4534 | 0.6577 | 158 | 8 | ||||
| 805.3263 | 0.7875 | 170 | 9 | ||||
| 805.4735 | 0.8094 | 158 | 10 | ||||
| 806.3601 | 0.9412 | 164 | 11 | ||||
| 806.4636 | 0.9566 | 98 | 12 | ||||
| 807.3734 | 0.0919 | 147 | 1 | ||||
| 807.4011 | 0.0960 | 129 | 2 | ||||
| July 1998 | October 1998 | ||||||
| 997.7161 | 0.3982 | 234 | 6 | 1088.4366 | 0.8898 | 244 | 7 |
| 998.7255 | 0.5483 | 196 | 8 | 1089.4187 | 0.0358 | 258 | 1 |
| 999.7027 | 0.6937 | 245 | 10 | 1090.4712 | 0.1923 | 277 | 2 |
| 1000.6999 | 0.8420 | 208 | 12 | 1091.4116 | 0.3322 | 263 | 3 |
| 1001.6995 | 0.9907 | 259 | 13 | 1092.4301 | 0.4837 | 190 | 4 |
| 1002.7031 | 0.1399 | 230 | 2 | 1093.4439 | 0.6344 | 206 | 5 |
| 1003.6983 | 0.2879 | 245 | 4 | 1094.4554 | 0.7848 | 240 | 6 |
| 1004.7087 | 0.4381 | 247 | 7 | ||||
| 1005.6946 | 0.5848 | 241 | 9 | ||||
| 1006.7059 | 0.7352 | 82 | 11 | ||||
| 1008.7135 | 0.0337 | 190 | 1 | ||||
| 1009.7077 | 0.1816 | 196 | 3 | ||||
| 1010.7002 | 0.3291 | 144 | 5 | ||||
| November 1998 | |||||||
| 1121.4971 | 0.8064 | 136 | 6 | ||||
| 1122.4786 | 0.9523 | 259 | 7 | ||||
| 1123.4666 | 0.0993 | 245 | 1 | ||||
| 1124.4742 | 0.2491 | 183 | 2 | ||||
| 1125.4906 | 0.4003 | 139 | 3 | ||||
| 1126.4920 | 0.5492 | 113 | 4 | ||||
| 1127.4864 | 0.6971 | 162 | 5 |
| July-August 1999 | September 1999 | ||||||
|---|---|---|---|---|---|---|---|
| 1383.7017 | 0.7998 | 248 | 9 | 1443.4928 | 0.6915 | 179 | 4 |
| 1384.7178 | 0.9509 | 238 | 11 | 1443.6184 | 0.7102 | 164 | 5 |
| 1385.7232 | 0.1004 | 217 | 1 | 1444.4788 | 0.8382 | 230 | 6 |
| 1386.7124 | 0.2475 | 229 | 3 | 1445.5656 | 0.9998 | 194 | 7 |
| 1387.7094 | 0.3958 | 200 | 5 | 1447.6084 | 0.3036 | 174 | 1 |
| 1388.7278 | 0.5472 | 181 | 7 | 1448.6212 | 0.4542 | 184 | 2 |
| 1389.7031 | 0.6923 | 178 | 8 | 1449.5979 | 0.5994 | 178 | 3 |
| 1390.7198 | 0.8435 | 151 | 10 | ||||
| 1391.7045 | 0.9899 | 243 | 12 | ||||
| 1392.7108 | 0.1396 | 258 | 2 | ||||
| 1393.7275 | 0.2908 | 189 | 4 | ||||
| 1394.7386 | 0.4411 | 206 | 6 | ||||
| October 1999 | |||||||
| 1471.5553 | 0.8648 | 267 | 4 | ||||
| 1472.5753 | 0.0165 | 249 | 1 | ||||
| 1473.5795 | 0.1658 | 223 | 2 | ||||
| 1475.5762 | 0.4628 | 221 | 3 | ||||
| 1505.3230 | 0.8865 | 128 | 5 | ||||
| August 2001 | August 2002 | ||||||
| 2120.5503 | 0.3796 | 192 | 3 | 2507.6078 | 0.9405 | 139 | 9 |
| 2121.5642 | 0.5303 | 225 | 4 | 2508.6582 | 0.0967 | 208 | 1 |
| 2122.7102 | 0.7008 | 185 | 6 | 2509.5877 | 0.2349 | 200 | 3 |
| 2123.6083 | 0.8344 | 196 | 8 | 2510.5909 | 0.3842 | 216 | 4 |
| 2124.5644 | 0.9765 | 193 | 10 | 2511.5413 | 0.5255 | 195 | 5 |
| 2125.6758 | 0.1418 | 177 | 1 | 2512.6316 | 0.6876 | 212 | 7 |
| 2126.7146 | 0.2963 | 189 | 2 | 2513.5494 | 0.8242 | 179 | 8 |
| 2128.6067 | 0.5777 | 166 | 5 | 2514.5854 | 0.9782 | 206 | 10 |
| 2129.6470 | 0.7324 | 190 | 7 | 2515.5768 | 0.1257 | 207 | 2 |
| 2130.6415 | 0.8804 | 208 | 9 | 2518.5749 | 0.5715 | 129 | 6 |
| November 2002 | |||||||
| 2588.3964 | 0.9549 | 207 | 7 | ||||
| 2589.3764 | 0.1007 | 160 | 1 | ||||
| 2591.3567 | 0.3951 | 241 | 3 | ||||
| 2592.3705 | 0.5459 | 219 | 4 | ||||
| 2597.4333 | 0.2988 | 252 | 2 | ||||
| 2599.4798 | 0.6031 | 275 | 5 | ||||
| 2600.4896 | 0.7532 | 259 | 6 |
Acknowledgements.
The results presented in this manuscript are based on observations made with the Nordic Optical Telescope, operated on the island of La Palma jointly by Denmark, Finland, Iceland, Norway, and Sweden, in the Spanish Observatorio del Roque de los Muchachos of the Instituto de Astrofisica de Canarias. The authors are grateful for the fruitful discussions with Jaan Pelt, Oleg Kochukhov, Thorsten Carroll and Markus Kopf.6 References
References
- Berdyugina et al. (1998a) Berdyugina, S.V., Berdyugin, A.V., Ilyin, I., Tuominen, I. 1998a, A&A, 340, 437
- Berdyugina et al. (1998b) Berdyugina, S.V., Jankov, S., Ilyin, I., Tuominen, I., Fekel, F.C. 1998b, A&A, 334, 863
- Berdyugina & Tuominen (1998) Berdyugina, S.V. & Tuominen, I. 1998, A&A, 336, L25
- Berdyugina et al. (1999a) Berdyugina, S.V., Ilyin, I., Tuominen, I. 1999a, A&A, 349, 863
- Berdyugina et al. (1999b) Berdyugina, S.V., Berdyugin, A.V., Ilyin, I., Tuominen, I. 1999b, A&A, 350, 626
- Carroll et al. (2009) Carroll, T., Kopf, M., Strassmeier, K., Ilyin, I., Tuominen, I. 2009, IAU Symposium, 259
- Gu et al. (2003) Gu, S.-H., Tan, H.-S., Wang, X.-B., Shan, H.-G. 2003, A&A, 405, 763
- Hackman et al. (2001) Hackman, T., Jetsu, L., Tuominen, I. 2001, A&A, 374, 171
- Huenemoerder et al. (2001) Huenemoerder, D.P., Canizares, C.R., Schultz, N.S. 2001, ApJ, 559
- Ilyin (2000) Ilyin, I.V. 2000, High resolution SOFIN CCD echelle spectroscopy, PhD. dissertation, University of Oulu
- Jetsu et al. (1993) Jetsu, L., Pelt, J. Tuominen, I. 1993, A&A, 278, 449
- Kochukhov et al. (2006) Kochukhov, O., Tsymbal, V., Ryabchikova, T., Makaganyk, V., Bagnulo, S. 2006, A&A, 460, 3
- Kupka et al. (1999) Kupka, F., Ryabchikova, T.A. 1999, VALD-The Vienna Atomic Line Database: A Survey
- Kurucz (1993) Kurucz, R.L. 1993, VizieR On-line Data catalog: VI/39
- Piskunov et al. (1990) Piskunov, N.E., Tuominen, I., Vilhu, O. 1990, A&A, 230, 363
- Piskunov (1991) Piskunov, N.E. 1991, In: Tuominen I., Moss D., Ruediger G. (eds) The Sun and Cool Stars: activity, magnetism, dynamos, IAU Coll. 130, Lecture Notes in Physics 380, Springer-Verlag, p. 309
- Piskunov (2008) Piskunov, N.E. 2008, Phys. Scr., T133
- Rodonò et al. (2000) Rodonò , M., Messina, S., Lanza, A.F., Cutispoto, G., Teriaca, L. 2000, A&A, 358, 624
- Saar et al. (1992) Saar, S.H., Baliunas, S.L. 1992 ASP Conf. Series, 27
- Semel (1989) Semel, M. 1989, A&A, 225
- Vogt & Penrod (1983) Vogt, S.S, Penrod, G.D. 1983, Proceedings of Colloquium No. 71 of the International Astronomical Union, p. 379
- Vogt et al. (1987) Vogt, S.S., Penrod, G., Hatzes, A.P. 1987, ApJ, 321, 496