The optical spectra of X-shaped radio galaxies
Abstract
X-shaped radio galaxies are defined by their peculiar large-scale radio morphology. In addition to the classical double-lobed structure they have a pair of low-luminosity wings that straddles the nucleus at almost right angles to the active lobes, thus giving the impression of an ’X’. In this paper we study for the first time the optical spectral properties of this object class using a large sample ( sources). We find that the X-shaped radio population is composed roughly equally of sources with weak and strong emission line spectra, which makes them, in combination with the well-known fact that they preferentially have radio powers intermediate between those of Fanaroff-Riley type I (FR I) and type II (FR II) radio galaxies, the archetypal transition population. We do not find evidence in support of the proposition that the X-shape is the result of a recent merger: X-shaped radio sources do not have unusually broad emission lines, their nuclear environments are in general not dusty, and their host galaxies do not show signs of enhanced star formation. Instead, we observe that the nuclear regions of X-shaped radio sources have relatively high temperatures. This finding favours models, which propose that the X-shape is the result of an overpressured environment.
keywords:
galaxies: active – galaxies: nuclei – galaxies: emission lines1 Introduction
X-shaped radio galaxies are distinguished from the classical double-lobed radio sources by their peculiar large-scale radio morphology (Leahy & Parma, 1992). In addition to the primary, active lobes, defined as such by having an overall higher surface brightness, they have a secondary pair of wings. These wings are located on each side of the nucleus and at large angles relative to the primary lobes, thus giving the impression of an ’X’. A prime example of this object class is the source 3C 403 (Black et al., 1992, see their Fig. 13).
Whereas agreement exists about the fact that only the pair of lobes are actively fed by radio plasma, it is not clear how the wings formed. The current propositions fall roughly into two main schools of thought: the wings are either (i) relic emission from previously active lobes or (ii) backflow emission from the primary, now active lobes. The first possibility requires a change in the jet direction, which occured either slowly over time as jet precession (Ekers et al., 1978) or suddenly due to a flip of the black hole spin after a galaxy merger (e.g., Dennett-Thorpe et al., 2002; Merritt & Ekers, 2002; Gopal-Krishna et al., 2003). The second possibility requires the presence of steep pressure gradients in the environment through which the jet propagates. These gradients are either due to an asymmetric distribution of the intracluster medium (Worrall et al., 1995) or to the shape of the host galaxy relative to the jet direction (Capetti et al., 2002). A combination of the two possibilities was proposed early on by Leahy & Williams (1984); radio plasma from the hotspots flows back preferentially into the cavities produced by the radio lobes of a previously active phase.
Observational evidence has been gathered so far mainly from studies of the radio spectral index and polarization along the lobes and wings, and from comparisons between the radio structure and the X-ray and optical morphologies of the host galaxy and immediate environment. The radio spectral index is often found to be steeper in the wings than in the lobes, indicating that the former contain older radio emission than the latter (e.g., Murgia et al., 2001; Rottmann, 2001; Dennett-Thorpe et al., 2002; Lal & Rao, 2007). But this result is expected in both scenarios, if the wings and lobes are relic and active emission, respectively, and if the plasma in the wings has flown first through the lobes. The direction of polarization, on the other hand, seems to favour the backflow scenario, since a smooth plasma stream from the active lobe to its nearest wing is almost always present.
Optical imaging revealed that X-shaped radio sources are mostly harboured by unperturbed, highly elliptical galaxies and generally live in poor clusters (e.g., Ulrich & Roennback, 1996; Capetti et al., 2002; Dennett-Thorpe et al., 2002). This finding seems to disfavour a scenario, in which a recent merger has changed the jet direction. In addition, it is always found that the direction of the active lobes coincides with the major axis of the host galaxy, indicating that environmental effects strongly influence the resultant radio morphology of the backflow (Capetti et al., 2002; Saripalli & Subrahmanyan, 2009). So far, few X-shaped radio sources have been imaged at X-ray frequencies, but all such studies favoured the backflow scenario based on the asymmetries detected in the environment (Worrall et al., 1995; Kraft et al., 2005; Miller & Brandt, 2009; Hodges-Kluck et al., 2010).
In this paper we present the first systematic analysis of the optical spectra of X-shaped radio galaxies. To this end we have used a large sample, which was selected as decribed in Section 2, and for which we have measured selected spectral quantities as explained in Section 3. With these in hand we have addressed the issue of jet orientation and general spectral class (Section 4), we have investigated their broad and narrow emission line regions (Section 5) and we have studied the properties of the host galaxy (Section 6). Our main results are summarized in Section 7, where we also present our conclusions.
Throughout this paper we have assumed cosmological parameters km s-1 Mpc-1, , and .
2 The Sample
Cheung (2007) selected from the images of the NRAO Very Large Array (VLA) FIRST survey (Becker et al., 1995) a sample of sources with clear or tentative X-shaped extended radio morphology. Later, Cheung et al. (2009) slightly extended this sample and defined a subsample of 50 radio galaxies with bona-fide X-shaped radio morphology and available optical spectroscopy (see their Table 2). We have considered here this radio galaxy sample to which we added two sources, namely, J14305217, which was identified as a quasar by the Sloan Digital Sky Survey (SDSS; Abazajian et al., 2009) but has only narrow emission lines in its spectrum (see Fig. 8), and J02451047, whose X-shaped radio morphology has recently been discovered by Landt & Bignall (2008). We have also included all X-shaped radio quasars with optical spectroscopy available to us (7 sources).
Cheung et al. (2009) obtained high-quality optical spectroscopy for 27/59 X-shaped radio sources and a further 19/59 sources were spectroscopically observed by the SDSS (Data Release 5; see Fig. 8). For another seven sources, namely, J01130106, J01150000, J02451047, J13090012, J16060000, J19520230, and J23470852, the published optical spectra were made available to us by the authors (Perlman et al., 1998; Best et al., 1999; Tadhunter et al., 1993; Lacy, 2000). Table 1 lists the total spectroscopic sample used in this paper (53 sources). The six sources excluded are J00091244, J00582651, J14242637, J15132607, J18247420, and J21232504.
3 The Spectral Measurements
We have measured all spectral quantities on rest-frame spectra, which were corrected for Galactic extinction using values derived from the Galactic hydrogen column densities of Dickey & Lockman (1990). We have measured the flux and rest-frame equivalent width by integrating the emission in the line over a local continuum using the IRAF task onedspec.splot and its option ’e’. In the case of blends (such as, e.g., H and [O III] ) we assumed Gaussian profiles and used the option ’d’ of this task to deblend the individual features. However, this procedure was not necessary in the case of the SDSS spectra, whose spectral resolution () is sufficient to resolve all investigated lines.
We have derived upper limits on the rest-frame equivalent widths and line fluxes of the narrow emission lines [O II] and [O III] when the lines were not detected but the line position was covered by the spectrum. The non-detection limits have been calculated assuming a rectangular emission line of width 1000 km s-1.
We have measured the value of the Ca II break (located at Å) in spectra versus . The Ca II break value is defined as , where and are the fluxes in the wavelength regions Å and Å, respectively. The Ca II break value is a suitable orientation indicator for radio-loud active galactic nuclei (AGN): the smaller its value, the smaller the jet viewing angle, i.e., the angle between the radio jet and the observer’s line of sight (e.g., Landt et al., 2002).
4 Orientation and Classification

Landt et al. (2004) proposed a physical classification scheme for radio-loud AGN that takes into account the effects of orientation. This scheme requires the measurement of only two quantities, namely, the rest-frame equivalent widths of the narrow emission lines [O II] and [O III] . Based on a bimodality observed for [O III], it then separates sources at all viewing angles into weak-lined and strong-lined radio-loud AGN.
In Fig. 1 we show the [O II]-[O III] equivalent width plane for the X-shaped radio sources in our spectroscopic sample, superposed with the line dividing the weak-lined and strong-lined classes (solid line) as well as the loci of constant viewing angles as obtained by Landt et al. (2004) from their simulations (dotted lines). Our optical spectra cover the locations of both [O II] and [O III] for all but one source (J07025002) and we list the measurements in Table 1 (columns (6) and (8)). Two important results become evident from Fig. 1. Firstly, most X-shaped radio sources are viewed at relatively large angles (). This result is supported by their large Ca II break values. We measure for all but six sources and for roughly half the sample (22/53 sources; see Table 1, column (4)). The observed result is intuitive given that projection effects are expected to distort the X-shape of the diffuse radio emission at small viewing angles, thus making it difficult to recognize. However, it also means that strongly relativistically beamed X-shaped radio galaxies (i.e., X-shaped radio quasars) will be difficult to select based on radio maps.
Secondly, roughly half the sample (23/53 sources) is classified as weak-lined radio-loud AGN (Table 1, column (5)), with about half of these objects (11/23 sources) having no [O II] or [O III] emission lines. This result is rather suprising. Since X-shaped radio sources are generally known to have their active pair of lobes terminating in pronounced hot spots, as observed for FR II radio galaxies, one would expect that, like these, they predominantly have strong optical emission lines. Are then X-shaped radio sources equally related to FR Is, which are known to have optical spectra with no or only weak emission lines, or do they simply contain an exceptionally large number of the otherwise rather rare weak-lined FR IIs (e.g., Laing et al., 1994; Tadhunter et al., 1998)?


In order to answer this question we have plotted in Fig. 2 the total radio luminosity at 1.4 GHz versus the absolute magnitude for the strong-lined (filled symbols) and weak-lined X-shaped radio galaxies (open symbols), which we subdivided based on the presence or lack of pronounced hotspots in their active lobes into sources with FR II (squares) and ambiguous (triangles) radio morphology, respectively. Luminosities were predominantly taken from Cheung et al. (2009) and the radio morphology judged visually from the FIRST maps and, where available, also from published, deeper radio maps (see references in Cheung, 2007). We have included only sources viewed at relatively large angles, i.e., without broad emission lines and with Ca II break values (46 sources), since in their case relativistic beaming effects are expected to be negligible. Then, Fig. 2 represents the so-called Ledlow-Owen plot (Ledlow & Owen, 1996), i.e., extended radio emission versus host galaxy luminosity, in which FR I and FR II galaxies separate (below and above the solid line, respectively). This separation, however, does not occur suddenly but rather via a transition region (Best, 2009).
Fig. 2 shows that the large majority of weak-lined sources straddle the FR I/II dividing line, as X-shaped radio galaxies generally do (Leahy & Parma, 1992; Dennett-Thorpe et al., 2002; Cheung et al., 2009), with only two (J01485332 and J14345906) and five objects (J00010033, J07025002, J08134347, J10051154, and J16142817) clearly in the FR II and FR I regime, respectively. All but one of these sources have active lobes with an FR II radio morphology, whereas J08134347 could be part of the recently identified X-shaped radio population without pronounced hotspots and similar to FR Is (Saripalli & Subrahmanyan, 2009).
It seems then that X-shaped radio galaxies genuinely represent a transition population, and this in both radio power and emission line strengths. This transition is illustrated in detail in Fig. 3, where we have plotted the total radio luminosity at 1.4 GHz versus the luminosity of the narrow emission line region , the latter calculated from the luminosities of [O II] and [O III] following Rawlings & Saunders (1991). As Fig. 3 shows, a clear transition point between the two classes can be identified at values of W and W Hz-1 (dashed lines). Interestingly, this point lies on the strong () linear correlation present for the strong-lined X-shaped radio sources (solid line).
| Object Name | Observatory | z | C | class | [O II] | [O III] | Other Name | ||
| flux | flux | ||||||||
| [Å] | [erg/s/cm2] | [Å] | [erg/s/cm2] | ||||||
| (1) | (2) | (3) | (4) | (5) | (6) | (7) | (8) | (9) | (10) |
| J00010033 | SDSS 2.5 m | 0.247 | 0.43 | WL | 2.5 | 6.68E17 | 1.0 | 7.51E17 | |
| J00490059 | SDSS 2.5 m | 0.304 | 0.46 | WL | 18.0 | 2.35E16 | 0.8 | 4.23E17 | |
| J01130106 | Shane 3 m | 0.281 | 0.31 | SL | 101.0 | 2.22E15 | 441.7 | 1.95E14 | |
| J01150000 | Shane 3 m | 0.381 | 0.30 | SL | 157.0 | 5.96E16 | 149.3 | 1.16E15 | 4C 00.07 |
| J01440830 | MMT 6.5 m | 0.181 | 0.39 | WL | 1.5 | 4.14E17 | 1.0 | 6.49E17 | |
| J01485332 | MMT 6.5 m | 0.290 | 0.25 | WL | 5.0 | 2.28E16 | 1.7 | 1.54E16 | 3C 52 |
| J02200156 | MMT 6.5 m | 0.173 | 0.35 | SL | 66.0 | 4.03E15 | 39.8 | 6.64E15 | 3C 63 |
| J02451047 | MMT 4.5 m | 0.070 | 0.26 | SL | 15.0 | 5.30E15 | 20.6 | 2.05E14 | 4C 10.08 |
| J05162458 | MMT 6.5 m | 0.063 | 0.33 | SL | 37.9 | 3.55E15 | 15.7 | 4.41E15 | 3C 136.1 |
| J07025002 | HJST 2.7 m | 0.094 | ? | WL | ? | ? | 5.0 | 8.80E16 | |
| J08052409 | SDSS 2.5 m | 0.060 | 0.47 | SL | 74.1 | 1.22E14 | 55.4 | 2.40E14 | 3C 192 |
| J08134347 | SDSS 2.5 m | 0.128 | 0.45 | WL | 2.1 | 1.65E16 | 0.8 | 1.61E16 | |
| J08313219 | SDSS 2.5 m | 0.051 | 0.44 | WL | 7.5 | 1.34E15 | 2.5 | 1.38E15 | 4C 32.25 |
| J08454031 | HET 9.2 m | 0.429 | 0.31 | SL | 9.9 | 5.25E16 | 21.8 | 2.23E15 | |
| J08590433 | MMT 6.5 m | 0.356 | 0.43 | SL | 19.1 | 3.41E16 | 10.1 | 4.59E16 | |
| J09170523 | HET 9.2 m | 0.591 | 0.40 | SL | 13.8 | 6.26E16 | 19.4 | 2.01E15 | 4C 05.39 |
| J09244233 | SDSS 2.5 m | 0.227 | 0.42 | WL | 4.1 | 1.25E16 | 1.7 | 1.48E16 | |
| J09410143 | MMT 6.5 m | 0.384 | 0.45 | WL | 18.2 | 3.16E16 | 2.8 | 1.20E16 | 4C 01.19 |
| J09413944 | SDSS 2.5 m | 0.108 | 0.38 | SL | 15.9 | 1.48E15 | 45.2 | 1.16E14 | 3C 223.1 |
| J10051154 | SDSS 2.5 m | 0.166 | 0.48 | WL | 2.5 | 1.60E16 | 1.0 | 1.99E16 | |
| J10155944 | SDSS 2.5 m | 0.527 | 0 | SL | 1.8 | 1.86E16 | 32.3 | 2.01E15 | |
| J10182914 | MMT 6.5 m | 0.389 | 0.27 | SL | 51.5 | 3.93E16 | 67.0 | 9.87E16 | |
| J10204831 | SDSS 2.5 m | 0.052 | 0.44 | WL | 23.1 | 2.39E15 | 1.0 | 3.18E16 | 4C 48.29 |
| J11011640 | MMT 6.5 m | 0.071 | 0.45 | WL | 14.5 | 1.84E15 | 4.4 | 1.44E15 | Abell 1145 |
| J11300058 | SDSS 2.5 m | 0.133 | 0.26 | SL | 24.2 | 2.59E15 | 69.9 | 1.51E14 | 4C 01.30 |
| J11350737 | MMT 6.5 m | 0.602 | 0.36 | WL | 20.8 | 1.35E16 | 7.1 | 1.14E16 | |
| J11401057 | SDSS 2.5 m | 0.081 | 0.41 | WL | 5.1 | 5.72E16 | 1.0 | 3.31E16 | |
| J12063812 | SDSS 2.5 m | 0.838 | 0 | SL | 2.7 | 2.55E16 | 31.5⋆ | 2.18E15⋆ | |
| J12073352 | SDSS 2.5 m | 0.079 | 0.28 | SL | 36.8 | 5.22E15 | 63.1 | 1.85E14 | |
| J12100341 | MMT 6.5 m | 0.178 | 0.40 | WL | 3.5 | 1.12E16 | 1.7 | 1.38E16 | |
| J12181955 | MMT 6.5 m | 0.424 | 0.33 | SL | 50.0 | 2.87E16 | 102.8 | 1.25E15 | 4C 20.28 |
| J12282642 | HET 9.2 m | 0.201 | 0.47 | WL | 5.0 | 4.78E16 | 1.3 | 3.80E16 | |
| J12533435 | MMT 6.5 m | 0.358 | 0.30 | SL | 9.5 | 1.04E16 | 31.5 | 6.89E16 | |
| J13090012 | ESO 3.6 m | 0.419 | 0.24 | SL | 58.0 | 1.34E15 | 62.4 | 1.89E15 | 4C 00.46 |
| J13105458 | HET 9.2 m | 0.356 | 0.27 | SL | 71.2 | 1.14E15 | 54.2 | 2.17E15 | |
| J13270203 | SDSS 2.5 m | 0.183 | 0.48 | WL | 8.9 | 3.49E16 | 0.6 | 7.99E17 | 4C 01.29 |
| J13422547 | HET 9.2 m | 0.585 | 0.08 | SL | 10.5 | 1.95E16 | 13.4 | 3.03E16 | |
| J13484411 | MMT 6.5 m | 0.267 | 0.28 | WL | 12.4 | 1.61E16 | 5.6 | 1.43E16 | |
| J13574807 | HET 9.2 m | 0.383 | 0.26 | SL | 88.3 | 1.27E15 | 105.5 | 3.00E15 | |
| J14060154 | HET 9.2 m | 0.641 | 0.40 | SL | 11.8 | 6.03E17 | 13.7 | 1.71E16 | 4C 01.31 |
| J14060657 | HET 9.2 m | 0.550 | 0 | SL | 0.6 | 3.36E16 | 19.7† | 6.89E15 | |
| J14305217 | SDSS 2.5 m | 0.367 | 0.28 | SL | 127.0 | 2.02E15 | 133.8 | 3.65E15 | |
| J14345906 | HET 9.2 m | 0.538 | 0.45 | WL | 14.3 | 7.04E17 | 4.9 | 5.01E17 | |
| J14444147 | SDSS 2.5 m | 0.188 | 0.44 | WL | 1.8 | 7.64E17 | 1.7 | 2.02E16 | |
| J14562542 | HET 9.2 m | 0.536 | 0.39 | WL | 1.7 | 2.19E17 | 1.7 | 5.18E17 | |
| J16002058 | MMT 6.5 m | 0.174 | 0.37 | SL | 25.4 | 1.08E15 | 11.5 | 1.25E15 | |
| J16060000 | ESO 3.6 m | 0.059 | 0.41 | WL | 5.0 | 1.18E15 | 1.0 | 6.59E16 | 4C 00.58 |
| J16064517 | HET 9.2 m | 0.556 | 0.37 | SL | 59.9 | 5.15E16 | 36.2 | 6.72E16 | |
| J16142817 | MMT 6.5 m | 0.108 | 0.42 | WL | 5.0 | 2.25E16 | 3.3 | 3.63E16 | |
| J16252705 | SDSS 2.5 m | 0.526 | 0 | SL | 4.1 | 3.97E16 | 53.9 | 3.01E15 | |
| J19520230 | ESO 2.2 m | 0.059 | 0.40 | SL | 28.8 | 1.36E14 | 74.3 | 8.56E14 | 3C 403 |
| J21570037 | SDSS 2.5 m | 0.391 | 0.35 | SL | 17.7 | 2.56E16 | 23.1 | 7.47E16 | |
| J23470852 | KPNO 2.1 m | 0.292 | 0 | SL | 4.6 | 2.20E15 | 51.1 | 2.37E14 | |
The columns are: (1) object name; (2) observatory at which the spectrum was obtained; (3) redshift; (4) Ca II break value (measured in spectra versus ); (5) classification following Landt et al. (2004), where WL: weak-lined radio-loud AGN, SL: strong-lined radio-loud AGN; (6) rest-frame equivalent width and (7) flux of [O II] ; (8) rest-frame equivalent width and (9) flux of [O III] ; and (10) common object name.
derived from [O III] ; rest-frame equivalent width relative to general continuum
5 The Emission Line Regions
Seven sources in our spectroscopic sample have broad emmission lines and we discuss their properties below (Section 5.1). For these (with the exception of J14060657) and a further 22 sources we detect besides [O II] and [O III] also other useful narrow emission lines, which we analyze in Section 5.2. We do not further discuss four sources (J10182914, J12533435, J13090012, and J14060154) that have only H , [O II] and [O III]. The remaining 20 sources in our sample have either no emission lines or none besides [O II] and [O III].
5.1 The Broad Emission Lines
| Object Name | H | H | Mg II |
|---|---|---|---|
| FWHM | FWHM | FWHM | |
| [km/s] | [km/s] | [km/s] | |
| (1) | (2) | (3) | (4) |
| J10155944 | ? | 5727 | 3656 |
| J11300058 | 7241 | – | ? |
| J12063812 | ? | 8048 | 7473 |
| J13422547 | ? | – | 9864 |
| J14060657 | ? | 12053 | 8792 |
| J16252705 | ? | 7079 | 4074 |
| J23470852 | 8420 | 7926 | ? |
Many popular explanations for the genesis of X-shaped radio sources require a galaxy merger, which is expected to yield a binary supermassive black hole. Such a binary can have two broad-line systems and/or two narrow-line systems, if both supermassive black holes are quasars and their spatial separation is large enough (e.g., Peterson et al., 1987; Gaskell, 1996; Boroson & Lauer, 2009; Shen & Loeb, 2009). In particular the two broad-line systems are expected to be observable as a single but unusually broad emission line.
In order to assess if X-shaped radio quasars have unusually broad emission lines, we have measured the full width at half-maximum (FWHM) of the most prominent lines present in our spectra, namely, the Balmer lines H and H , and Mg II . The narrow emission line components of H and H are pronounced in all objects and were removed prior to measuring the broad component. Such a correction was not straightforward for Mg II and we left the line unchanged. In Table 2 we list the measurements, where a question mark indicates that the position of the line was not covered by the spectrum. For J11300058 we observe broad H, but only narrow H. The lack of a broad H component in this source is most likely due to dust obscuration (see Section 5.2 and Wang et al. (2003); Zhang et al. (2007)). For J13422547 a broad H line appears to be present, but the spectrum is too noisy to reliably measure its width.
The observed broad emission line widths of X-shaped radio quasars span a range similar to that generally found for lobe-dominated radio quasars (Brotherton, 1996; Corbin, 1997; Aars et al., 2005). In this respect we note that the relatively large H width of J14060657 could be due to a strong “red shelf”, an emission feature known to be asscociated with broad H in some quasars (e.g., De Robertis, 1985; Marziani et al., 1996). This result argues against merger models, in which the two black holes are still separated. However, it does not exclude any binary model, if it is assumed that one of the black holes has no emission line system.
5.2 The Narrow Emission Lines
The narrow emission lines probe the nuclear gas environment on scales up to a few kpc and can reveal important information that might constrain models for the origin of the X-shaped radio morphology. For example, a perturbed and rather dusty environment is expected in the case of a recent galaxy merger. On the other hand, the large pressure gradients required by the backflow model could have also increased the gas densities and/or temperatures.
In the following we estimate the nuclear dust extinction using the three strongest hydrogen lines (Section 5.2.1) and derive gas electron densities and temperatures based on sulphur and oxygen emission line ratios, respectively (Section 5.2.2). Table 3 lists the relevant flux measurements (28/53 sources).
5.2.1 Dust Extinction

We detect all three Balmer emission lines H, H and H in 11/28 sources. These sources are all but one (J07025002) classified as strong-lined radio-loud AGN. In Fig. 4 we compare their measured line fluxes with the predictions from Case B recombination without dust (lower solid line), and including a dust extinction of and 2 mag (middle and upper solid lines, respectively). The values expected from Case B recombination were calculated using the Cloudy photoionization simulation code (last described by Ferland et al., 1998) and assuming a temperature of K and an electron density of cm-3. The values were transformed into values using the analytical expression for the interstellar extinction curve of Cardelli et al. (1989) and assuming a parameter . Fig. 4 shows the emission line fluxes and the Case B lines normalized such that the H flux is unity.
In all but three sources we estimate the dust extinction to be negligible. In two sources (J11300058 and J12073352) we obtain a dust extinction of the order of mag and the highest extinction ( mag) is observed for J16002058. The amount of dust observed in the X-shaped radio quasar J11300058 may explain why this source displays a broad H but only a narrow H emission line.
The general lack of large amounts of dust in the nuclear environments of X-shaped radio galaxies indicates that any galaxy merger must have happened a long time ago. This conclusion is similar to that drawn by authors who studied the host galaxies of X-shaped sources with optical imaging. They find them to be almost perfectly elliptical, without the usual signs of a recent interaction, such as, e.g., tidal tails or extended dust lanes (e.g., Wirth et al., 1982; van Breugel et al., 1983; Capetti et al., 2002; Cheung & Springmann, 2007; Saripalli & Subrahmanyan, 2009).
5.2.2 Electron Densities and Temperatures


The flux ratio between the lines of the sulphur doublet [S II] is a suitable indicator of electron density (the higher its value, the lower the density) in the intermediate regime of cm-3 (e.g., Peterson, 1997). We detect the two sulphur lines in 16/28 sources, of which equal numbers are classified as weak-lined and strong-lined AGN. In Fig. 5 we compare their [S II] line ratios with those observed for a sample of 76 ’normal’ radio galaxies from the 3CR survey (Buttiglione et al., 2009). We note that we have excluded from the 3CR comparison sample sources in common with our sample. Fig. 5 shows that X-shaped sources reach both higher and lower electron densities than is typical of radio galaxies, however, according to a Kolmogorov-Smirnov (KS) test the distributions of the two groups are not significantly different ().
The flux ratio between the sum of the oxygen doublet [O III] and the oxygen line [O III] is a suitable indicator of electron temperature (the higher its value, the lower the temperature). We detect the [O III] line in 19/28 sources. These sources are all classified as strong-lined radio-loud AGN. In Fig. 6 (top panel) we have plotted the distribution of the observed oxygen ratios, which suggests that the large majority of X-shaped sources have relatively high electron temperatures. Using a theoretical relation calculated following Osterbrock & Ferland (2006) and assuming an electron density of cm-3 (Fig. 6, lower panel), we estimate for 13/19 sources temperatures well in excess of the typical value of K, with eight sources even exceeding the upper boundary of K usually derived for AGN narrow emission line regions (e.g., Peterson, 1997).
We note that the [O III] emission line is usually difficult to measure in AGN, since it is often weak and can blend with . However, in particular in the aforementioned 13 sources, we observe this line to be relatively strong with typically a rest-frame equivalent width of Å for a signal-to-noise ratio in the continuum of . Furthermore, the resolution of the majority of the spectra is sufficient to reliably separate it from .
Our results hint at increased pressures being present in the nuclear environments of X-shaped radio galaxies, mainly caused by elevated temperatures. Such enhanced pressures are necessary in the backflow model of Capetti et al. (2002), which proposed that wings emerge in addition to lobes when the jet is orientated along the major axis of the host galaxy. Then, in such a case, the jet lobe becomes overpressured and radio plasma will eventually escape along the galaxy minor axis. In this respect we note that, contrary to our results, the X-ray studies of Hodges-Kluck et al. (2010) found no significant differences in temperature (or density) between a sample of eight X-shaped sources and a sample of 18 ’normal’ radio galaxies.
| Object Name | Observatory | class | H | H | H | [S II] | [S II] | [O III] | [O III] |
|---|---|---|---|---|---|---|---|---|---|
| flux | flux | flux | flux | flux | flux | flux | |||
| [erg/s/cm2] | [erg/s/cm2] | [erg/s/cm2] | [erg/s/cm2] | [erg/s/cm2] | [erg/s/cm2] | ratio | |||
| (1) | (2) | (3) | (4) | (5) | (6) | (7) | (8) | (9) | (10) |
| J00490059 | SDSS 2.5 m | WL | 7.68E17 | – | – | 8.14E17 | 6.58E17 | – | – |
| J01130106 | Shane 3 m | SL | ? | 1.47E15 | 7.05E16 | ? | ? | 1.96E16 | 133 |
| J01150000 | Shane 3 m | SL | ? | 2.18E16 | 1.40E16 | ? | ? | 4.56E17 | 34 |
| J02200156 | MMT 6.5 m | SL | 3.75E15 | 1.15E15 | 5.91E16 | 6.03E16 | 6.35E16 | 5.63E16 | 16 |
| J02451047 | MMT 4.5 m | SL | 4.60E15 | – | 6.90E16 | – | – | 1.60E15 | 17 |
| J05162458 | MMT 6.5 m | SL | 6.07E15 | 2.16E15 | 1.02E15 | 3.37E15 | 3.28E15 | – | – |
| J07025002 | HJST 2.7 m | WL | 1.53E15 | 3.66E16 | 3.10E16 | 7.11E16 | 1.22E15 | – | – |
| J08052409 | SDSS 2.5 m | SL | 9.23E15 | 2.40E15 | 1.55E15 | 3.53E15 | 2.69E15 | 1.11E15 | 29 |
| J08313219 | SDSS 2.5 m | WL | 1.00E15 | – | – | 1.09E15 | 7.36E16 | – | – |
| J09413944 | SDSS 2.5 m | SL | 3.81E15 | 9.04E16 | 9.23E16 | 1.02E15 | 8.38E16 | 6.02E16 | 26 |
| J10155944 | SDSS 2.5 m | SL | ? | 2.54E16 | 1.72E16 | ? | ? | 1.27E16 | 21 |
| J10204831 | SDSS 2.5 m | WL | 1.29E15 | – | – | 9.44E16 | 7.84E16 | – | – |
| J11011640 | MMT 6.5 m | WL | 9.06E16 | – | – | 9.86E16 | 7.52E16 | – | – |
| J11300058 | SDSS 2.5 m | SL | 5.66E15 | 1.51E15 | 6.77E16 | 1.13E15 | 9.70E16 | 3.08E16 | 65 |
| J11401057 | SDSS 2.5 m | WL | 3.20E16 | – | – | 2.32E16 | 4.36E16 | – | – |
| J12063812 | SDSS 2.5 m | SL | ? | 1.79E16 | 9.98E17 | ? | ? | 8.19E17 | 35 |
| J12073352 | SDSS 2.5 m | SL | 8.16E15 | 1.90E15 | 9.51E16 | 2.63E15 | 2.24E15 | 6.38E16 | 39 |
| J12181955 | MMT 6.5 m | SL | ? | 1.25E16 | 5.98E17 | ? | ? | 7.57E17 | 22 |
| J13105458 | HET 9.2 m | SL | 6.08E16 | 2.11E16 | 1.24E16 | – | – | 1.19E16 | 24 |
| J13270203 | SDSS 2.5 m | WL | 1.34E16 | – | – | 2.54E16 | 1.41E16 | – | – |
| J13422547 | HET 9.2 m | SL | ? | 6.30E17 | 5.90E17 | ? | ? | 1.91E17 | 21 |
| J13574807 | HET 9.2 m | SL | 1.41E15 | 3.78E16 | 2.27E16 | – | – | 2.36E17 | 169 |
| J14305217 | SDSS 2.5 m | SL | ? | 5.22E16 | 3.17E16 | ? | ? | 1.37E16 | 36 |
| J16002058 | MMT 6.5 m | SL | 1.19E15 | 1.53E16 | 8.77E17 | 6.18E16 | 4.22E16 | 3.35E17 | 50 |
| J16060000 | ESO 3.6 m | WL | 2.08E16 | – | – | 8.00E16 | 9.63E16 | – | – |
| J16252705 | SDSS 2.5 m | SL | ? | 3.66E16 | 1.83E16 | ? | ? | 1.47E16 | 27 |
| J19520230 | ESO 2.2 m | SL | ? | 5.57E15 | 4.43E15 | ? | ? | 2.04E15 | 56 |
| J23470852 | KPNO 2.1 m | SL | 2.46E15 | 1.11E15 | 4.02E16 | 2.12E16 | 4.74E16 | 1.28E16 | 247 |
The columns are: (1) object name; (2) observatory at which the spectrum was obtained; (3) classification; (4) - (9) fluxes of the narrow emission lines as labeled, where ?: line position not covered by spectrum, and – : line position covered by spectrum, but line not detected; and (10) flux ratio [O III] /, calculated assuming the theoretical flux ratio [O III] /.
6 The Host Galaxy
The spectrum of the host galaxy can also put constraints on models for the origin of the X-shaped radio morphology. In particular, if a recent galaxy merger was the source of a change in jet direction, we expect to see spectral signs of starburst activity, such as strong hydrogen absorption lines that are typical of young stars or enhanced continuum flux at short wavelengths.
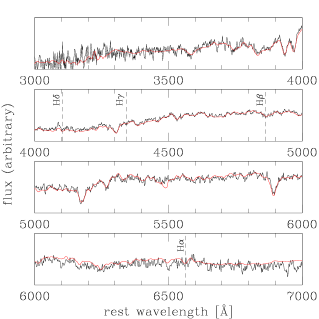
In order to investigate the properties of the host galaxy spectra of X-shaped radio sources, we have created a composite. For this purpose we have used only those sources in our sample that had a ’pure’ host galaxy spectrum, i.e., had no [O II] or [O III] emission lines and a Ca II break value of (8 objects). The latter constraint ensured that the blue part of the spectrum was not enhanced by the jet at any perceptible level (see Fig. 1 in Landt et al., 2002), which could otherwise be wrongly interpreted as a sign of enhanced star formation.
Fig. 7 shows the resulting composite host galaxy spectrum (black solid line), compared to the elliptical galaxy template of Mannucci et al. (2001) (red solid line). There are no pronounced differences present between the two spectra, and in particular none of the Balmer hydrogen absorption lines H , H , H or H appear unusually strong.
This result indicates, similar to that of Section 5.2.1, that any galaxy merger must have happened a considerable time ago. Since the starburst should be observable for at least a few million years after its initiation, which is of the order of the electron radiative lifetimes, this then means that the secondary wings are unlikely to be plasma from the old jets and are rather backflow from the currently active lobes.
7 Summary and Conclusions
We have analysed the optical spectral properties of a large sample (53 objects) of X-shaped radio sources. The large majority of our sample are radio galaxies, but seven sources are radio quasars (i.e., have broad emission lines). We have considered the general relation between radio and emission line power, searched for signs of recent merger activity and looked for probes of the nuclear environment. Our main results can be summarized as follows:
(i) The X-shaped radio population contains roughly equal numbers of sources with a weak and a strong emission line spectrum. Given also that their radio powers mostly straddle the dividing line between FR I and FR II radio galaxies, we show that this kind of sources are the archetypal transition population. We observe a clear transition point in both narrow emission line and radio power at W and W Hz-1, respectively.
(ii) We have searched for signs of a recent galaxy merger, such as, unusually broad emission lines that would indicate a (large-separation) binary black hole, dusty nuclear environments as probed by the narrow emission lines, and signs of enhanced star formation in the host galaxy. All three approaches gave negative results, suggesting that any merger must have occurred a considerable time ago (longer than the electron radiative lifetimes), thus making it improbable that the pair of wings are relic radio emission.
(iii) We have probed the electron densities and temperatures in the nuclear environments of X-shaped radio sources using narrow emission line diagnostics. We find that the majority of sources have relatively high temperatures ( K). This supports the scenario where overpressured environments rather than recent mergers seem to be the cause for the X-shape radio morphology.
Acknowledgments
We thank Mark Lacy, Philip Best and Clive Tadhunter for providing spectra in electronic format. We are indebted to Kirk Korista for providing the results from the Cloudy photoionization code calculations. An anonymous reviewer provided useful suggestions that helped us to improve the paper.
References
- Aars et al. (2005) Aars C. E., Hough D. H., Yu L. H., Linick J. P., Beyer P. J., Vermeulen R. C., Readhead A. C. S., 2005, AJ, 130, 23
- Abazajian et al. (2009) Abazajian K. N., Adelman-McCarthy J. K., Agüeros M. A., Allam S. S., Allende Prieto C., An D., Anderson K. S. J., Anderson S. F., et al., 2009, ApJS, 182, 543
- Becker et al. (1995) Becker R. H., White R. L., Helfand D. J., 1995, ApJ, 450, 559
- Best (2009) Best P. N., 2009, Astronomische Nachrichten, 330, 184
- Best et al. (1999) Best P. N., Röttgering H. J. A., Lehnert M. D., 1999, MNRAS, 310, 223
- Black et al. (1992) Black A. R. S., Baum S. A., Leahy J. P., Perley R. A., Riley J. M., Scheuer P. A. G., 1992, MNRAS, 256, 186
- Boroson & Lauer (2009) Boroson T. A., Lauer T. R., 2009, Nature, 458, 53
- Brotherton (1996) Brotherton M. S., 1996, ApJS, 102, 1
- Buttiglione et al. (2009) Buttiglione S., Capetti A., Celotti A., Axon D. J., Chiaberge M., Macchetto F. D., Sparks W. B., 2009, A&A, 495, 1033
- Capetti et al. (2002) Capetti A., Zamfir S., Rossi P., Bodo G., Zanni C., Massaglia S., 2002, A&A, 394, 39
- Cardelli et al. (1989) Cardelli J. A., Clayton G. C., Mathis J. S., 1989, ApJ, 345, 245
- Cheung (2007) Cheung C. C., 2007, AJ, 133, 2097
- Cheung et al. (2009) Cheung C. C., Healey S. E., Landt H., Verdoes Kleijn G., Jordán A., 2009, ApJS, 181, 548
- Cheung & Springmann (2007) Cheung C. C., Springmann A., 2007, in L. C. Ho & J.-W. Wang ed., The Central Engine of Active Galactic Nuclei Vol. 373 of Astronomical Society of the Pacific Conference Series, FIRST “Winged” and “X”-shaped Radio Source Candidates. p. 259
- Corbin (1997) Corbin M. R., 1997, ApJS, 113, 245
- De Robertis (1985) De Robertis M., 1985, ApJ, 289, 67
- Dennett-Thorpe et al. (2002) Dennett-Thorpe J., Scheuer P. A. G., Laing R. A., Bridle A. H., Pooley G. G., Reich W., 2002, MNRAS, 330, 609
- Dickey & Lockman (1990) Dickey J. M., Lockman F. J., 1990, ARA&A, 28, 215
- Ekers et al. (1978) Ekers R. D., Fanti R., Lari C., Parma P., 1978, Nature, 276, 588
- Ferland et al. (1998) Ferland G. J., Korista K. T., Verner D. A., Ferguson J. W., Kingdon J. B., Verner E. M., 1998, PASP, 110, 761
- Gaskell (1996) Gaskell C. M., 1996, ApJ, 464, L107
- Gopal-Krishna et al. (2003) Gopal-Krishna Biermann P. L., Wiita P. J., 2003, ApJ, 594, L103
- Hodges-Kluck et al. (2010) Hodges-Kluck E. J., Reynolds C. S., Cheung C. C., Miller M. C., 2010, ApJ, 710, 1205
- Kraft et al. (2005) Kraft R. P., Hardcastle M. J., Worrall D. M., Murray S. S., 2005, ApJ, 622, 149
- Lacy (2000) Lacy M., 2000, ApJ, 536, L1
- Laing et al. (1994) Laing R. A., Jenkins C. R., Wall J. V., Unger S. W., 1994, in Bicknell G. V., Dopita M. A., Quinn P. J., eds, The First Stromlo Symposium: The Physics of Active Glaxies Spectrophotometry of a complete sample of 3CR radio sources: Implications for unified models. A.S.P., San Francisco, p. 201
- Lal & Rao (2007) Lal D. V., Rao A. P., 2007, MNRAS, 374, 1085
- Landt & Bignall (2008) Landt H., Bignall H. E., 2008, MNRAS, 391, 967
- Landt et al. (2002) Landt H., Padovani P., Giommi P., 2002, MNRAS, 336, 945
- Landt et al. (2004) Landt H., Padovani P., Perlman E. S., Giommi P., 2004, MNRAS, 351, 83
- Leahy & Parma (1992) Leahy J. P., Parma P., 1992, in Roland J., Sol H., Pelletier G., eds, Extragalactic Radio Sources. From Beams to Jets Multiple outbursts in radio galaxies. Cambridge University Press, p. 307
- Leahy & Williams (1984) Leahy J. P., Williams A. G., 1984, MNRAS, 210, 929
- Ledlow & Owen (1996) Ledlow M. J., Owen F. N., 1996, AJ, 112, 9
- Mannucci et al. (2001) Mannucci F., Basile F., Poggianti B. M., Cimatti A., Daddi E., Pozzetti L., Vanzi L., 2001, MNRAS, 326, 745
- Marziani et al. (1996) Marziani P., Sulentic J. W., Dultzin-Hacyan D., C̃alvani M., Moles M., 1996, ApJS, 104, 37
- Merritt & Ekers (2002) Merritt D., Ekers R. D., 2002, Science, 297, 1310
- Miller & Brandt (2009) Miller B. P., Brandt W. N., 2009, ApJ, 695, 755
- Murgia et al. (2001) Murgia M., Parma P., de Ruiter H. R., Bondi M., Ekers R. D., Fanti R., Fomalont E. B., 2001, A&A, 380, 102
- Osterbrock & Ferland (2006) Osterbrock D. E., Ferland G. J., 2006, Astrophysics of Gaseous Nebulae and Active Galactic Nuclei. University Science Books
- Perlman et al. (1998) Perlman E. S., Padovani P., Giommi P., Sambruna R., Jones L. R., Tzioumis A., Reynolds J., 1998, AJ, 115, 1253
- Peterson (1997) Peterson B. M., 1997, An Introduction to Active Galactic Nuclei. Cambridge University Press
- Peterson et al. (1987) Peterson B. M., Korista K. T., Cota S. A., 1987, ApJ, 312, L1
- Rawlings & Saunders (1991) Rawlings S., Saunders R., 1991, Nature, 349, 138
- Rottmann (2001) Rottmann H., 2001, PhD thesis, Rheinische Friedrich-Wilhelms-Universität Bonn
- Saripalli & Subrahmanyan (2009) Saripalli L., Subrahmanyan R., 2009, ApJ, 695, 156
- Shen & Loeb (2009) Shen Y., Loeb A., 2009, ArXiv e-prints
- Tadhunter et al. (1993) Tadhunter C. N., Morganti R., di Serego-Alighieri S., Fosbury R. A. E., Danziger I. J., 1993, MNRAS, 263, 999
- Tadhunter et al. (1998) Tadhunter C. N., Morganti R., Robinson A., Dickson R., Villar-Martin M., Fosbury R. A. E., 1998, MNRAS, 298, 1035
- Ulrich & Roennback (1996) Ulrich M., Roennback J., 1996, A&A, 313, 750
- van Breugel et al. (1983) van Breugel W., Balick B., Heckman T., Miley G., Helfand D., 1983, AJ, 88, 40
- Wang et al. (2003) Wang T., Zhou H., Dong X., 2003, AJ, 126, 113
- Wirth et al. (1982) Wirth A., Smarr L., Gallagher J. S., 1982, AJ, 87, 602
- Worrall et al. (1995) Worrall D. M., Birkinshaw M., Cameron R. A., 1995, ApJ, 449, 93
- Zhang et al. (2007) Zhang X., Dultzin-Hacyan D., Wang T., 2007, MNRAS, 377, 1215
Appendix A SDSS spectra


