Determining the Physical Lens Parameters of the Binary Gravitational Microlensing Event MOA-2009-BLG-016
Abstract
We report the result of the analysis of the light curve of the microlensing event MOA-2009-BLG-016. The light curve is characterized by a short-duration anomaly near the peak and an overall asymmetry. We find that the peak anomaly is due to a binary companion to the primary lens and the asymmetry of the light curve is explained by the parallax effect caused by the acceleration of the observer over the course of the event due to the orbital motion of the Earth around the Sun. In addition, we detect evidence for the effect of the finite size of the source near the peak of the event, which allows us to measure the angular Einstein radius of the lens system. The Einstein radius combined with the microlens parallax allows us to determine the total mass of the lens and the distance to the lens. We identify three distinct classes of degenerate solutions for the binary lens parameters, where two are manifestations of the previously identified degeneracies of close/wide binaries and positive/negative impact parameters, while the third class is caused by the symmetric cycloid shape of the caustic. We find that, for the best-fit solution, the estimated mass of the lower-mass component of the binary is , implying a brown-dwarf companion. However, there exists a solution that is worse only by for which the mass of the secondary is above the hydrogen-burning limit. Unfortunately, resolving these two degenerate solutions will be difficult as the relative lens-source proper motions for both are similar and small () and thus the lens will remain blended with the source for the next several decades.
Subject headings:
gravitational lensing1. Introduction
For general microlensing events, the only lensing parameter that provides information about the physical parameters of the lens is the Einstein time scale . However, the time scale results from the combination of the underlying physical lens parameters of the lens mass , relative lens-source parallax , and proper motion by
| (1) |
where , represents the angular Einstein radius, and and are the distances to the lens and source star, respectively. As a result, it is difficult to uniquely determine the physical lens parameters from the time scale alone.
For complete determination of the physical parameters of a lens, it is required to measure both the lens parallax and angular Einstein radius. The microlens parallax is defined by the ratio of the Earth’s orbit to the Einstein radius projected on the observer plane, , i.e.,
| (2) |
In general, parallaxes are measured from the slight deviation of the overall shape of the light curve from a symmetric standard light curve (Paczyński, 1986), which is caused by the deviation of the relative lens-source motion from a rectilinear motion due to the orbital motion of the Earth around the Sun (Gould, 1992). Parallaxes are usually measured for long time-scale events for which the parallax effect is maximized. Einstein radii, on the other hand, are generally measured from the deviation of the light curve caused by the finite size of source stars such as caustic-approaching events (Gould, 1994). With the measured parallax and Einstein radius, the mass of the lens and the distance to the lens are uniquely determined by
| (3) |
and
| (4) |
where is the parallax of the source star.
Unfortunately, the conditions for the optimal measurements of the parallax and Einstein radius are different and thus the chance to completely determine the physical parameters of lenses by measuring both quantities is low. In the literature, we find a total 13 microlensing events for which the lens masses were determined. These include EROS-2000-BLG-5 (An et al., 2002), sc26-2218 (Smith et al., 2003a), OGLE-2002-BLG-018 (Kubas et al., 2005), OGLE-2003-BLG-235 (Bennett et al., 2006), OGLE-2003-BLG-238 (Jiang et al., 2004), OGLE-2006-BLG-109 (Gaudi et al., 2008; Bennett et al., 2009), OGLE-2007-BLG-050 (Batista et al., 2009), OGLE-2007-BLG-192 (Bennett et al., 2008) OGLE-2007-BLG-224 (Gould et al., 2009), OGLE-2008-BLG-279 (Yee et al., 2009), MACHO-LMC-5 (Alcock et al., 2001; Gould et al., 2004), OGLE-2003-BLG-175/MOA-2003-BLG-045 (Ghosh et al., 2004), and OGLE-2005-BLG-071 (Udalski et al., 2005; Dong et al., 2009).
In this paper, we report the result of the analysis of the microlensing event MOA-2009-BLG-016. We determine the mass of the lens and distance to it by measuring both the Einstein radius and lens parallax. We identify three distinct types of degeneracy, where two are previously known and the other is newly identified in this work.
2. Observation
The microlensing event MOA-2009-BLG-016 occurred on a star located at , which corresponds to the Galactic coordinates of . It was first detected by the MOA collaboration on 2009 February 18 by using the 1.8 m telescope of Mt. John Observatory in New Zealand. An anomaly was detected on April 2 and it was announced to the microlensing community. In response to the alert, the FUN team conducted follow-up observations by using the 1.3 m SMARTS telescope of CTIO in Chile. The CTIO data are composed of 29 images in band and 5 images in band. Data set from additional observatories were either single-epoch or near baseline and hence have not been included for analysis. Photometric reductions of the data were carried out by using the codes developed by the individual groups.
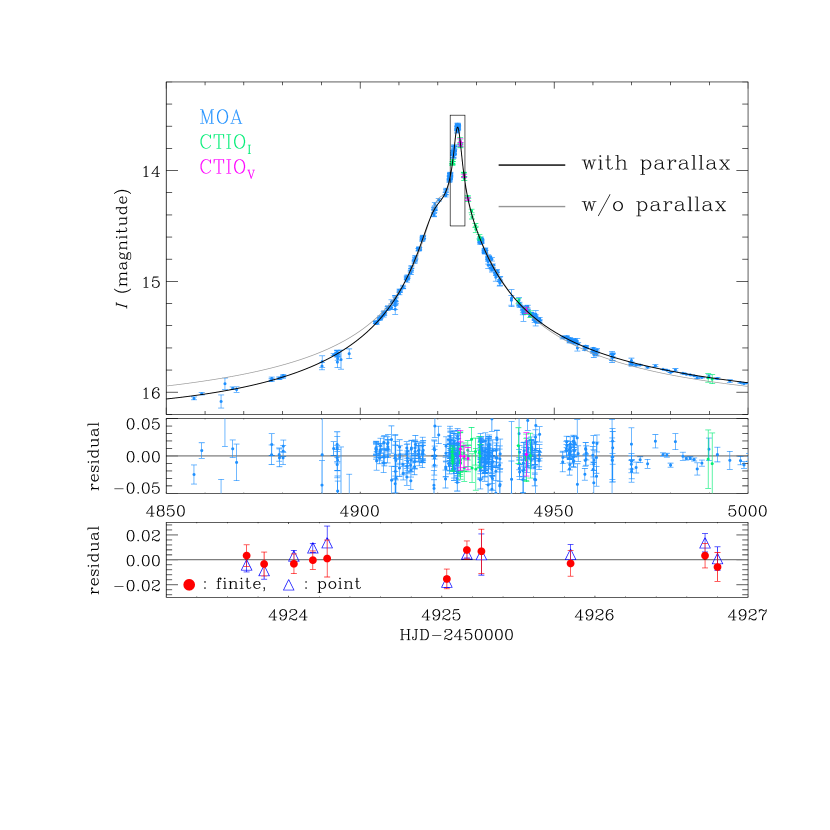
In Figure 1, we present the light curve of the event. We note that the magnitude of the light curve is not calibrated. This is due to the lack of calibrated comparison stars in the field due to severe blending. However, the lensed star can be constrained from modeling combined with the color information obtained from the position of the source star on the color-magnitude diagram relative to the position of the center of clump giants in the field for which the de-reddened magnitude and color are well known. See more details in section 3.1. We also note that data set from different observatories and filters are aligned by fitting them a common model. 111Photometric data used for analysis are available upon requests.
3. Characterization
3.1. Modeling
Modeling microlensing light curves requires to include various parameters. To describe light curves of standard single-lens events, a set of three parameters are needed. These include the Einstein time scale, , the time of the closest lens-source approach, , and the lens-source separation normalized by the Einstein radius at the time of the closest approach, . If light curves exhibit binary-induced anomalies, an additional set of parameters is needed. These parameters include the mass ratio between the lens components, , the projected binary separation in units of the Einstein radius, , and the angle of the source trajectory with respect to the binary axis, . For many cases of binary events, the normalized source radius, , is needed to describe the lensing magnification whenever the angular radius of the source star, , plays an important role such as in the vicinity of a caustic crossing. For some long time-scale events with parallax-induced deviations, it is required to include the parallax parameters and , which are the components of the lens-parallax vector projected on the sky in the north and east celestial coordinates, respectively. The direction of this vector is that of the lens-source relative motion in the frame of the Earth at the peak of the event. Similar to the deviation by the parallax effect, the source trajectory can also be affected by the orbital motion of the source if it is composed of binary stars (‘xallarap’ effect). Under the assumption of a circular orbit and a very faint binary companion, the xallarap effect is parameterized by the orbital period , inclination , and phase angle of the orbit.
Modeling light curves of microlensing events is a difficult task. The large number of parameters makes brute-force searches of solutions difficult. In addition, a simple downhill approach in the complicated surface often results in wrong solutions of local minima. We, therefore, use a hybrid approach where grid searches are conducted over the space of the parameters of , , and and the remaining parameters are searched by letting them vary so that they result in minimum at each grid of , , and parameters. We use a Markov Chain Monte Carlo method for minimization. Once the minima of the individual grid points are determined, the best-fit model is obtained by comparing the values of the individual grids. We investigate degeneracy of the solutions by probing local minima that appear in the space of the grid parameters.
The light curve of the event MOA-2009-BLG-016 is characterized by two important features. One is the anomaly near the peak of the light curve and the other is the asymmetry of the overall light curve. From modeling, we find that the anomaly near the peak is well explained by the central perturbation caused by a close/wide binary. For the best-fit model, the determined values of the projected separation and mass ratio between the binary components are
| (5) |
We also find that the asymmetry of the light curve can be explained by the parallax effect. The determined values of the parallax parameters for the best-fit parallax model are
| (6) |
The improvement of the fit with the addition of the parallax effect is . The parallax interpretation is consistent with the long time scale of the event, which is days for the best-fit model.
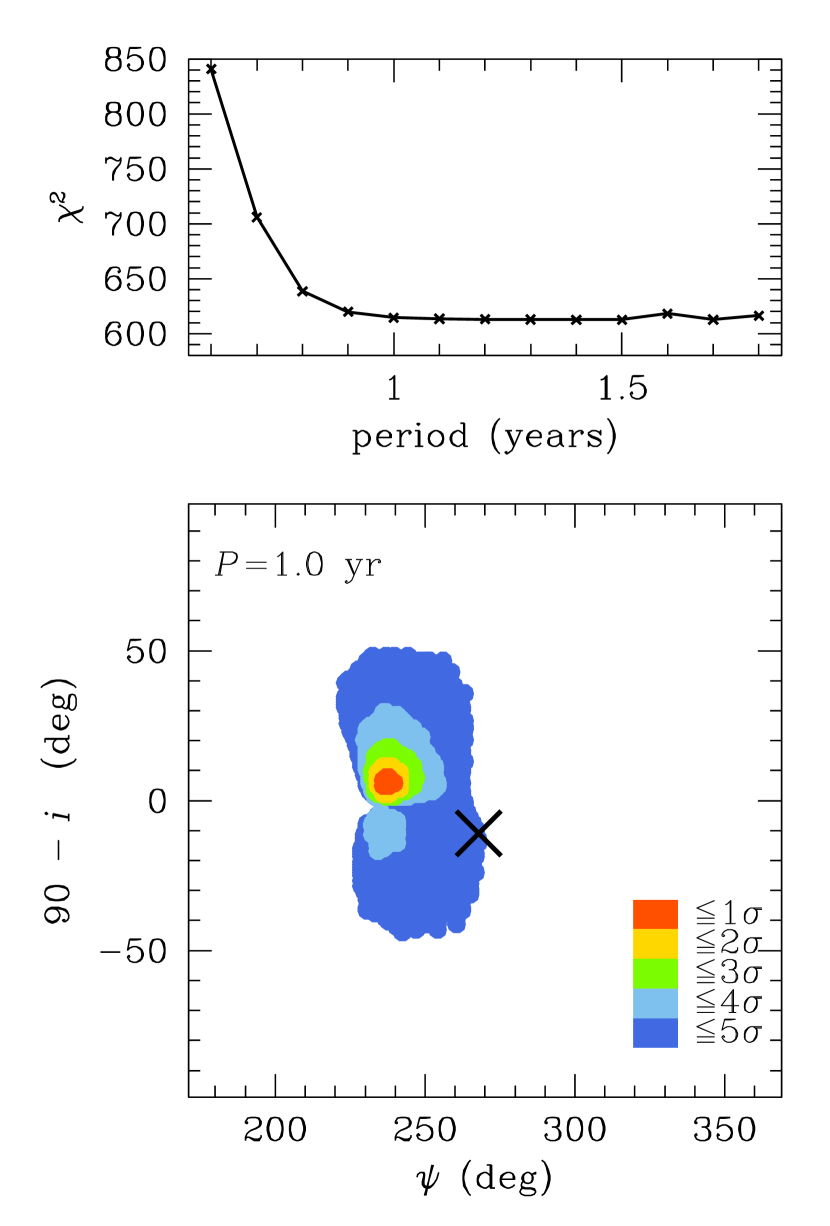
It is known that a parallax signal can be mimicked by that of the xallarap effect (Smith et al., 2003b). To check this possibility, we search for xallarap solutions under the assumption that the binary source is in a circular orbit. Figure 2 shows the distributions of as a function of the xallarap parameters obtained from modeling.
We find that the best fit xallarap solution yields an improvement of for 3 additional degrees of freedom. Although this improvement is formally highly significant and certainly implies that the 3 additional xallarap parameters are capable of “responding” to systematic deviations in the data that are not fully captured by the parallax modeling, we will now argue that the parallax solutions is preferred and the additional systematic deviations “detected” by the xallarap parameters are most likely due to other effects.
The first point is that the parallax signal () is more than 100 times stronger than the additional signal from xallarap, and such 1% systematic effects are quite common in microlensing events. These may be due to real effects, such as binary orbital motion, third bodies in the system, or other physical effects, or may simply be due to systematics in the data, which (because of the fleeting nature of the events) are taken under an extremely wide range of conditions. Systematic effects at this level can never be definitively tracked down because the is too small to adequately characterize the real effects (such as the mass and separation of a putative third body).
Second, if we consider the entire two-dimensional space of possible binary orientations, only 1/6 lie within of the minimum, i.e., as close as the parallax solution (see Figure 2). If we further account for the fact that all events must have parallax at some level, whereas only half of sources have a binary companion of any mass, with period (see 2), then the prior probability of a xallarap solution is only 1/12. If there were known to be no other systematic effects (real or instrumental) affecting this event, then this 1/12 probability would have meager weight against a . But since such low-level systematics are in fact common, the 1/12 probability must be taken seriously. In brief, while we cannot rule out the xallarap solution, we judge it to be relatively unlikely and so adopt the parallax solution.
We find that a finite-source model is preferred over a point-source model with . The amount of is not big, but we note that it is statistically significant considering that the signal of the finite-source effect lasts only a short period of time during the source’s approach close to the cusp of the caustic.
In Figure 1, we present the best-fit model curve on the top of the light curve. Also presented in the top panel is the model curve without the parallax effect. Middle panel shows the residual from the best-fit model (both the parallax and finite-source effect included). The bottom panel shows the residuals from the best-fit finite-source (red) and point-source (blue) models in the region around the perturbation. We note that the data points in the bottom panel are binned by 4 hours to better show the difference.
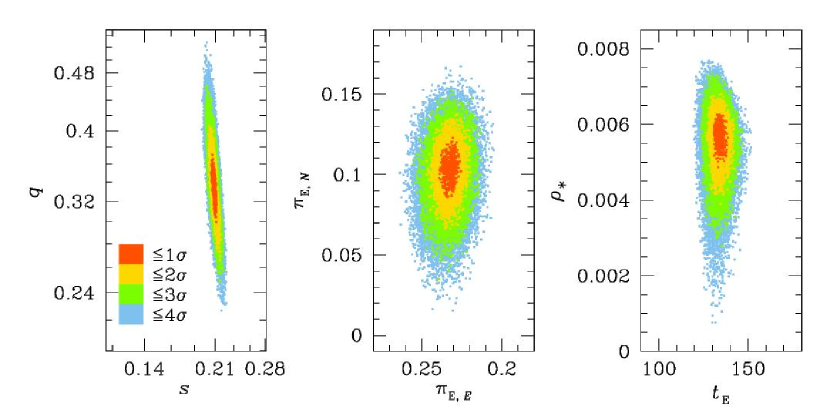
In Figure 3, we present the contours of in the spaces of the binary parameters [left panel], the parallax parameters [middle panel], and the normalized source radius and the Einstein time scale [right panel] in the neighborhood of the best-fit model.
| parameters | close I+ | close I– | wide I+ | wide I– | close II+ | close II– | wide II+ | wide II– |
|---|---|---|---|---|---|---|---|---|
| /dof | 649.1/645 | 642.8/645 | 655.9/645 | 645.7/645 | 663.7/645 | 669.6/645 | 673.0/645 | 673.8/645 |
| 0.211 | 0.208 | 7.190 | 7.296 | 0.210 | 0.207 | 9.099 | 8.934 | |
| 0.298 | 0.333 | 0.686 | 0.735 | 0.582 | 0.610 | 5.157 | 4.002 | |
| (deg) | 163.20 | -162.56 | 163.53 | -162.91 | 70.12 | -70.11 | 69.22 | -69.18 |
| (HJD’) | 4923.805 | 4923.779 | 4923.914 | 4923.882 | 4923.928 | 4923.934 | 4923.780 | 4923.785 |
| 0.027 | -0.028 | 0.021(0.027) | -0.020(-0.027) | 0.036 | -0.036 | 0.015(0.036) | -0.016(-0.036) | |
| 135.77 | 135.29 | 173.21(133.40) | 177.17(134.50) | 106.24 | 108.55 | 274.62(110.68) | 247.69(110.75) | |
| 0.0055 | 0.0056 | 0.0046(0.0059) | 0.0043(0.0057) | 0.0087 | 0.0085 | 0.0031(0.0076) | 0.0035(0.0079) | |
| 0.090 | 0.108 | 0.065(0.084) | 0.082(0.108) | -0.026 | -0.023 | -0.011(-0.028) | -0.010(-0.021) | |
| 0.224 | 0.230 | 0.171(0.221) | 0.180(0.237) | 0.275 | 0.268 | 0.104(0.257) | 0.117(0.261) | |
| 0.692 | 0.688 | 0.690 | 0.692 | 0.594 | 0.604 | 0.600 | 0.602 | |
| 0.693 | 0.694 | 0.690 | 0.697 | 0.604 | 0.613 | 0.604 | 0.608 |
Note. — . The parameters of the best-fit solution are marked in bold fonts. The parameters in the parentheses for wide solutions represent the values with respect to the mass of the binary component associated with the caustic involved with the perturbation. We note that and represent the blended light fractions in and passbands, respectively, measured from the CTIO data.
3.2. Degeneracy
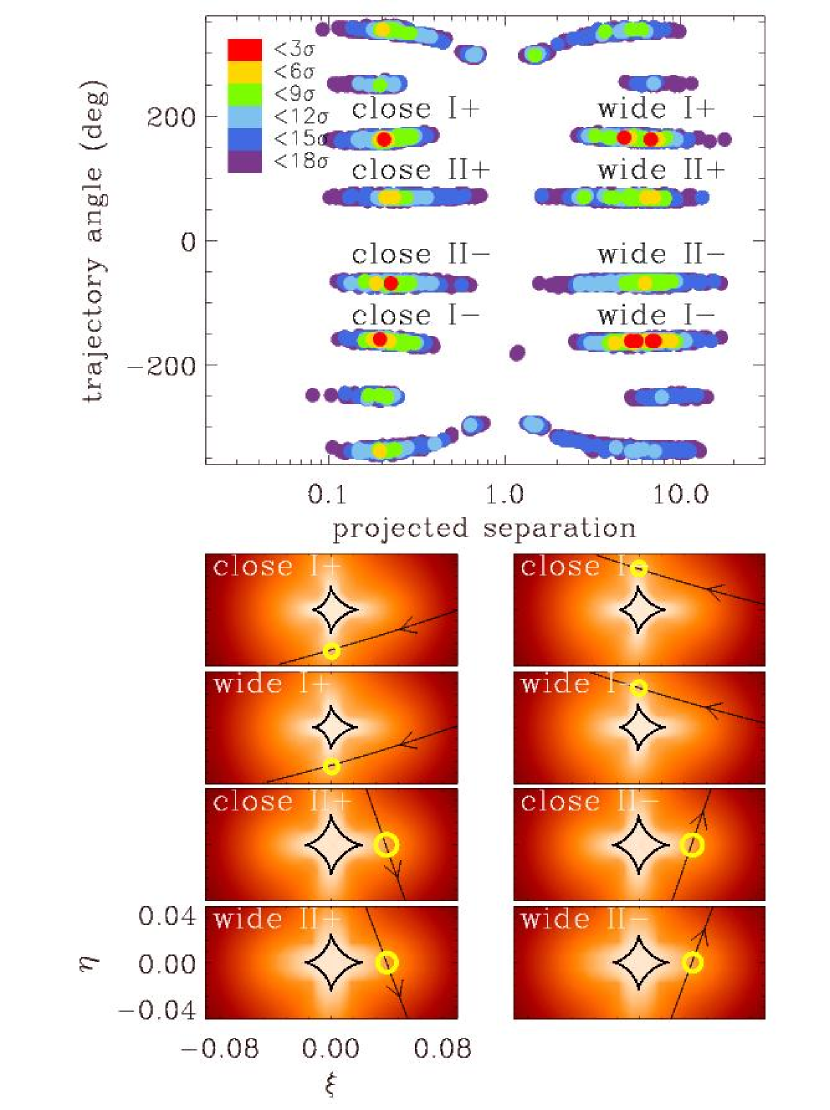
Although the basic characteristics of the lens system are defined, we find that there exist degenerate solutions. The upper panel of Figure 4 shows the local minima in the parameter space of the projected binary separation and the source trajectory angle. Panels in the lower half show the geometry of the source trajectory with respect to the caustic for the solutions corresponding to the individual local minima. We note that among the total 8 pairs of local minima we label only 4 pairs for which the values of from the best-fit model are relatively small. From the analysis of the individual local minima, we find that they result from three distinct types of degeneracy.
The first type of degeneracy is the well-known close/wide degeneracy (Dominik et al., 1999; Albrow et al., 1999; Afonso et al., 2000; Albrow et al., 2002). This degeneracy is caused by the similarity in shape between the caustics induced by a wide-separation binary with and a close-separation binary with . This can be seen in Figure 4, where one finds pairs of local minima with separations and .
The second type of degeneracy is caused by the mirror symmetry between the pair of source trajectories with the impact parameters and source trajectory angles of and (Smith et al., 2003b). For a rectilinear motion, the two light curves resulting from the two source trajectories are identical. If the parallax effect is not negligible, however, the light curves from the trajectories are slightly different due to the curvature of the source trajectory. The pairs of local minima with trajectory angles and in Figure 4 are caused by this degeneracy.
The third type of degeneracy is caused by the shape of the caustic. When the caustic is produced by a binary with a separation significantly larger or smaller than the Einstein radius, its shape is a symmetric cycloid with four cusps where two cusps are on the binary axis and the others are off the axis. Then, source trajectories approaching the caustic with angles , , , and result in a similar perturbation. We refer to this degeneracy as ‘cycloid degeneracy’. We find that the caustic responsible for the central perturbation of the event MOA-2009-BLG-016 is very symmetric and thus the light curve is subject to this degeneracy. The four local minima on each quadrant of parameter space in Figure 3 are caused by this degeneracy.
In Table 1, we list the lensing parameters of the local minima along with values of . We find that the models with trajectory angle of provide better fits than the corresponding models with . Among the close-wide pairs of solutions with , we find close-binary models are preferred. Among the two close-binary models with , we find that the “” model (close I–) provides the best fit to the observed light curve.
| model | |||||||||
|---|---|---|---|---|---|---|---|---|---|
| (mas) | (mas yr-1) | (mas yr-1) | (deg) | (kpc) | () | () | () | ||
| close I+ | 6.3 | 0.360.07 | 0.970.17 | 1.120.20 | 65.9 | 4.800.60 | 0.180.03 | 0.140.03 | 0.040.01 |
| close I– | 0.0 | 0.360.06 | 0.960.17 | 1.130.20 | 63.1 | 4.700.58 | 0.170.03 | 0.130.02 | 0.040.01 |
| wide I+ | 13.1 | 0.430.08 (0.330.06) | 0.910.17 | 1.050.20 | 66.9 | 4.980.64 | 0.290.06 | 0.170.03 | 0.120.02 |
| wide I– | 2.9 | 0.460.08 (0.350.06) | 0.940.16 | 1.110.19 | 63.6 | 4.720.59 | 0.280.05 | 0.160.03 | 0.120.02 |
| close II+ | 21.0 | 0.270.03 | 0.910.10 | 1.020.11 | 90.1 | 5.120.58 | 0.120.01 | 0.080.01 | 0.040.01 |
| close II– | 26.8 | 0.270.03 | 0.900.11 | 1.000.12 | 89.7 | 5.160.60 | 0.120.02 | 0.080.01 | 0.050.01 |
| wide II+ | 30.3 | 0.740.14 (0.300.06) | 0.990.19 | 1.100.21 | 90.9 | 5.010.67 | 0.880.19 | 0.140.03 | 0.730.16 |
| wide II– | 31.0 | 0.640.11 (0.290.05) | 0.950.16 | 1.060.18 | 89.6 | 5.070.65 | 0.680.13 | 0.140.03 | 0.540.11 |
Note. — Here represents the angular Einstein radius, and represent the geocentric and heliocentric lens-source proper motion, respectively, is the angle of the proper motion with respect to the east, is the distance to the lens, is the total mass of the binary lens, and and are the masses of the binary components. We note that the subscript “1” is used to denote the lens component located closer to the source trajectory and thus can be smaller than . The parameters of the best-fit solution are marked in bold fonts. The values of are with respect to the best-fit solution, i.e. close I– model. The Einstein radius in parenthesis represents the value with respect to the mass of the binary component associated with the caustic involved with the perturbation.
3.3. Physical Parameters
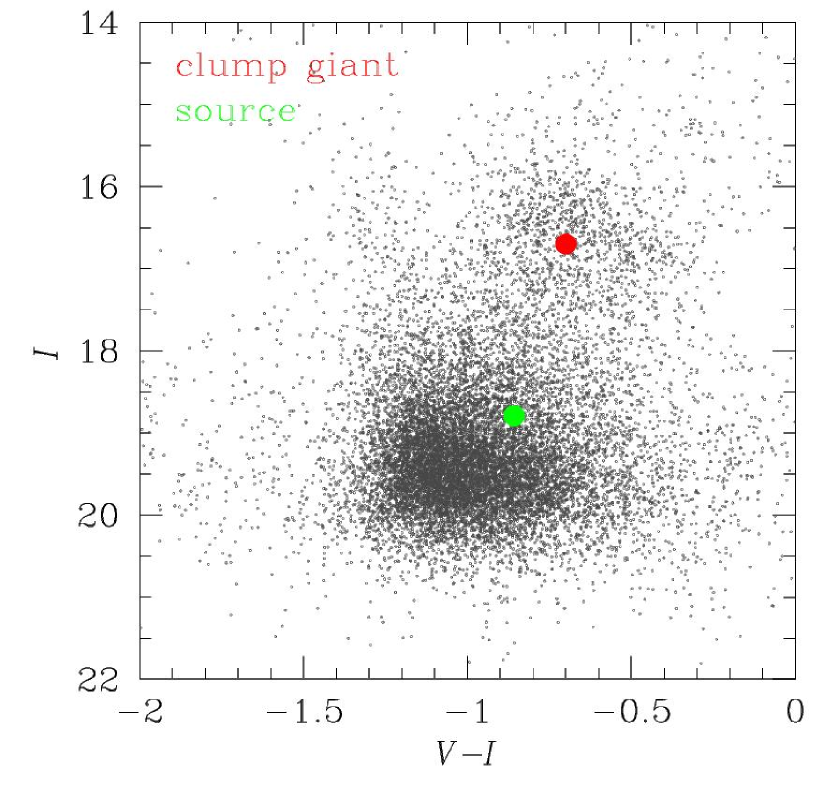
To determine , we first determine the de-reddened magnitude and color of the source star from the measured offset between the source and the centroid of the clump giants in the instrumental color-magnitude diagram (CMD) constructed by using the and band images taken from CTIO (Figure 5) under the assumption that the source star and clump giants experience the same amount of extinction. The locations of the source star and the centroid of clump giants on the instrumental CMD are and , respectively. The location of the source on the CMD is determined based on the light fractions of the source star in the and bands determined from modeling. With the known de-reddened magnitude and color of bulge clump giants of toward the field, the de-reddened brightness and color of the source star are determined by and , respectively. Here we adopt a mean distance to clump giants toward the field of 8.8 kpc estimated by Rattenbury et al. (2007). Then, the angular source size is determined by first transforming from to using the color-color relation of Bessel & Brett (1998) and then applying the relation between and the angular stellar radius of Kervella et al. (2004). The resulting angular radius is
| (7) |
where the uncertainty is estimated from the combination of the uncertainties of the colors and magnitudes of the source star and and an additional 7% intrinsic error in the conversion process from the measured color to source radius (Yee et al., 2009). With the measured source radius, the Einstein radius and lens-source proper motion are determined by
| (8) |
and
| (9) |
respectively.
With the measured parallax and Einstein radius, the mass of the lens system and distance to the lens are determined from the relations in equation (3) and (4). For the best-fit model, these values are
| (10) |
and
| (11) |
respectively. For the estimation of the uncertainty of , we consider an fractional error of the source location estimated by the bulge mass distribution model of Han & Gould (1995). The values for other solutions are presented in Table 2. We note that, for the best solution, the estimated mass of the lower-mass component of the binary is
| (12) |
making it a brown-dwarf candidate. We note, however, that the estimated mass of the companion for the second-best model is above the hydrogen-buring limit.
3.4. Resolution of Degeneracies
It is found that analysis of the light curve of MOA-2009-BLG-016 alone results in degenerate solutions. However, it might be possible to resolve the degeneracies with extra information. We check the possibility of resolving the degeneracies from the measurement of proper motion from high-resolution observations. For this, we compute the heliocentric lens-source proper motion for the individual solutions.
In Table 1, we present the magnitudes and directions of the proper motion vectors for the individual solutions. From the table, it is found that the high-resolution observation would be of limited use due to several reasons. First, the two sets of solutions caused by the cycloid degeneracy result in different directions of proper motion and thus resolution of the lens and source would make it possible to resolve the degeneracy, but this degeneracy is already clearly lifted with significant from the light curve alone. Moreover, this would be only possible many years after the event considering the small magnitude of the proper motion of . Second, the solutions caused by other degeneracies result in proper motions with not only a similar magnitude but also a similar direction, implying that the degeneracies would be difficult to be lifted even with high-resolution observations.
4. Conclusion
We analyzed the light curve of a microlensing event MOA-2009-BLG-016, which is characterized by high-magnification with an anomaly near the peak and an overall asymmetric light curve. We found that the anomaly and asymmetry of the light curve are explained by the lens binarity and the parallax effect, respectively. With the Einstein radius measured from the central perturbation combined with the lens parallax measured from the overall asymmetric light curve, we determined the mass of the lens and distance to the lens. We identified three distinct types of degeneracy, where two were previously known and the other is first identified in this work. We also found that, for the best solution, the estimated mass of the lower-mass component of the binary is in the mass range of brown dwarfs.
We acknowledge the following support: Creative Research Initiative Program (2009-0081561) of National Research Foundation of Korea (CH); Korea Astronomy and Space Science Institute (B-GP, C-UL); NSF AST-0757888 (AG); NASA NNG04GL51G (BSG, AG, RWP); NSF AST-0708890 (DPB); NASA NNX07AL71G (BPB); JSPS20740104 (TS).
References
- Afonso et al. (2000) Afonso C., et al. 2000, ApJ, 532, 340
- Albrow et al. (2002) Albrow M., et al. 2002, ApJ, 572, 1031
- Albrow et al. (1999) Albrow M., et al. 1999, ApJ, 522, 1022
- Alcock et al. (2001) Alcock, C., et al. 2001, Nature, 414, 617
- An et al. (2002) An, J. H., et al. 2002, ApJ, 572, 521
- Batista et al. (2009) Batista, V., et al. 2009, A&A, in press
- Bennett et al. (2006) Bennett, D. P., Anderson, J., Bond, I. A., Udalski, A., & Gould, A. 2006, ApJ, 647, L171
- Bennett et al. (2008) Bennett, D. P., et al. 2008, ApJ, 684, 663
- Bennett et al. (2009) Bennett, D. P., et al. 2009, ApJ, submitted
- Bessel & Brett (1998) Bessel, M. S., & Brett, J. M. 1998, PASP, 100, 1134
- Dominik et al. (1999) Dominik, M., et al. 1999, A&A, 349, 108
- Dong et al. (2009) Dong, S., et al. 2009, ApJ, 695, 970
- Dong et al. (2009) Dong, S., et al. 2009, ApJ, 698, 1826
- Gaudi et al. (2008) Gaudi, B. S., et al. 2008, Science, 319, 927
- Ghosh et al. (2004) Ghosh, H., et al. 2004, ApJ, 615, 450
- Gould (1992) Gould, A. 1992, ApJ, 392, 442
- Gould (1994) Gould, A. 1994, ApJ, 421, L71
- Gould et al. (2004) Gould, A., Bennett, D. P., & Alves, D. R. 2004, ApJ, 614, 404
- Gould et al. (2009) Gould, A., et al. 2009, ApJ, 698, L147
- Han & Gould (1995) Han, C., & Gould, A. 1995, ApJ, 447, 53
- Jiang et al. (2004) Jiang, G., et al. 2004, ApJ,617, 1307
- Kervella et al. (2004) Kervella, P., Thévenin, F., Di Folco, E., & Ségransan, D. 2004, A&A, 426, 297
- Kubas et al. (2005) Kubas, D., et al. 2005, A&A, 435, 941
- Paczyński (1986) Paczyński, B. 1986, ApJ, 304, 1
- Poindexter et al. (2005) Poindexter, S., et al. 2005, ApJ, 633, 914
- Rattenbury et al. (2007) Rattenbury, N. J., Mao, S., Sumi, T., & Smith, M. C. 2007, MNRAS, 378, 1064
- Smith et al. (2003a) Smith, M. C., Mao, S, & Woźniak, P. 2003, ApJ, 585, L65
- Smith et al. (2003b) Smith, M. C., Mao, S., & Paczyński, B. 2003, MNRAS, 339, 925
- Udalski et al. (2005) Udalski, A., et al. 2005, ApJ, 628, L109
- Yee et al. (2009) Yee, J. C., et al. 2009, ApJ, 703, 2082