Disks in the Arches cluster – survival in a starburst environment**affiliation: Based on observations made with the Keck II telescope on Mauna Kea, Hawai’i, and with ESO Telescopes at the Paranal Observatory under programme ID 60.A-9026.
Abstract
Deep Keck/NIRC2 observations of the Arches cluster near the Galactic center reveal a significant population of near-infrared excess sources. We combine the -band excess observations with -band proper motions, which allow us to confirm cluster membership of excess sources in a starburst cluster for the first time. The robust removal of field contamination provides a reliable disk fraction down to our completeness limit of mag, or at the distance of the Arches. Of the 24 identified sources with mag, 21 have reliable proper motion measurements, all of which are proper motion members of the Arches cluster. VLT/SINFONI -band spectroscopy of three excess sources reveals strong CO bandhead emission, which we interpret as the signature of dense circumstellar disks. The detection of strong disk emission from the Arches stars is surprising in view of the high mass of the B-type main sequence host stars of the disks and the intense starburst environment. We find a disk fraction of % among B-type stars in the Arches cluster. A radial increase in the disk fraction from 3 to 10% suggests rapid disk destruction in the immediate vicinity of numerous O-type stars in the cluster core. A comparison between the Arches and other high- and low-mass star-forming regions provides strong indication that disk depletion is significantly more rapid in compact starburst clusters than in moderate star-forming environments.
1 Introduction
1.1 The Arches starburst cluster
The Arches cluster is a dense, massive, young stellar cluster located in the central molecular zone near the center of the Galaxy (Cotera et al. 1996, Figer et al. 1999, 2002, Stolte et al. 2002, 2005, Kim et al. 2006, Stolte et al. 2008, Espinoza et al. 2009). With a total stellar mass of (Espinoza et al. 2009), it is considered one of the rare starburst clusters in the Milky Way. The young age of only Myr (Najarro et al. 2004) places it at an evolutionary state comparable to nearby star-forming regions. Nearby star-forming regions at these young ages, as observed, for example, in the Orion complex, display a significant fraction of circumstellar disks remaining from the star formation process (Haisch et al. 2001, Hernández et al. 2007, and references therein). As a starburst cluster, however, the Arches hosts 125 O-type stars (Figer et al. 2002, Stolte et al. 2005), some of which have already evolved to the earliest Wolf-Rayet phases (Martins et al. 2008). For comparison, the Orion nebula cluster hosts only 2 to 4 O-type stars (Hillenbrand 1997). Most of our knowledge of the first few million years of stellar evolution and disk depletion stems from nearby star-forming regions of significantly lower density and stellar mass, while the effects of the starburst environment on circumstellar material and the disk lifetime has rarely been probed.
Increasing evidence for remnant accretion disks around young, massive OB stars is deduced from K-band spectroscopy in very young star-forming regions (e.g., M17: Hanson et al. 1997, Hoffmeister et al. 2006, NGC 3576: Blum et al. 2004, Figueredo et al. 2005) and UCHII regions (e.g., Bik et al. 2005, 2006, and references therein). The large fraction of near-infrared excess objects and the fact that early O-type stars are on the main sequence suggest very young ages of less than 1-2 Myr for these environments. Observing disk fractions at later evolutionary stages is complicated by the steeply decreasing disk fraction as clusters age (Haisch et al. 2001), and the decreasing brightness of the increasingly depleted disks themselves. The Arches cluster, at an age of Myr (Najarro et al. 2004), fills one of the rare gaps in cluster evolution. Not only does it provide an estimate of the disk lifetime in its substantial B-star population, it additionally connects disk survival with the dense environment of a starburst cluster.
1.2 Circumstellar disks in young star clusters
In young star-forming regions with ages less than 10 Myr, -band excess provides one of the most efficient tools to detect circumstellar disks (Haisch et al. 2001, see also Hillenbrand et al. 1992, Lada et al. 2000). As the illumination of the dense, inner disk rim by the central star generates 3.8m emission from hot dust (Natta et al. 2001), the excess -band flux indicates dense disks surviving from the star-formation process. The hostile starburst cluster environment can accelerate disk destruction, to the extent that one might not expect to find any remaining gaseous disks in a cluster like the Arches. The finding of disks provides crucial clues for our understanding of disk survival and the likelyhood of planet formation in dense cluster environments.
A linear decrease is observed in the disk fraction as a function of increasing cluster age in nearby star-forming regions (Haisch et al. 2001). This decrease in near-infrared excess emission can be understood as the depletion of dust in the inner, hot disk rim due to photoevaporation and grain growth (e.g., Takeuchi et al. 2005). The lifetimes of young disks, as derived from near-infrared excess fractions, indicate that most disks are depleted within 10 Myr, with shorter disk lifetimes for higher mass stars. In a pioneering study of 47 Herbig Ae/Be stars, Hillenbrand et al. (1992) found a more rapid depletion of disks around B-type stars with masses of than in A stars in the mass range. On average, the disks around high-mass stars do not survive for more than 1 Myr, with a characteristic disk age of only a few yr (Alonso-Albi et al. 2009).
According to disk depletion simulations, the timescale for disk survival is expected to depend on the mass of the central star and on the ambient UV radiation field, and thus on the cluster environment. However, disk photoevaporation models do not arrive at a consistent conclusion for disk survival times around high-mass stars. Models of disks around high-mass O- and early B-type stars in isolation suggest that while the outer disk is evaporated by the central star on timescales of less than 1 Myr, the inner, dense disks with radii of AU can survive for several Myr in late O-type stars, and more than 20 Myr in early B-type stars (Richling & Yorke 1997, Hollenbach et al. 2000, Scally & Clarke 2001, see also Bik et al. 2006). Photoevaporation models by Takeuchi et al. (2005), on the other hand, predict that the dense, inner disk around a Herbig Ae/Be star will be depleted out to a radius of 40 AU within 3 Myr. In a starburst cluster, the numerous O- and B-type stars additionally create a strong EUV/FUV radiation field that accelerates disk evaporation. Simulations by Armitage (2000) suggest that a disk with a dust mass of can survive for up to 1 Myr in clusters with stars at a distance of 1 pc from the dense core, while the same disk will be evaporated in less than yrs if located at 0.1-0.3 pc from the massive stars in the cluster center. Similar conclusions are reached by Fatuzzo & Adams (2008), who simulate the influence of the radiation field on circumstellar disks in a massive star cluster with respect to planetary system formation. Tidal forces during dynamical interactions between cluster members might additionally truncate circumstellar disks (Olczak et al. 2008, Pfalzner et al. 2006, Cesaroni et al. 2007, Scally & Clarke 2001, Boffin et al. 1998), and enhance the exposure of the inner disks to ambient UV radiation, thereby accelerating dust depletion.
In the Arches, NGC 3603, and similarly dense starburst clusters, the situation may be more extreme than in nearby star-forming regions, as the numerous O-type stars segregate toward the cluster core, where the combined effect of their radiation fields act on circumstellar material around lower-mass cluster members as well. The radiation environment in starburst clusters therefore has important consequences for the survival timescale of disks, both in the Milky Way and in extragalactic systems, and thus for the potential of planetary system formation in dense star-forming environments. In particular, the disk fraction is predicted to be a function of the stellar density in addition to the cluster age. A lower disk fraction in high-density environments might influence the accretion timescale and final stellar masses, and hence the initial stellar mass function. Observationally, the effect of the ambient stellar density can be evidenced as a depletion of circumstellar disks towards the dense cluster core, where the most massive stars reside. A decrease in the disk fraction with decreasing cluster radius is observed in the young starburst cluster at the center of the giant HII region NGC 3603 (Harayama et al. 2008, Stolte et al. 2004). As a consequence of limited spatial resolution and sensitivity in -band observations, the high foreground extinction and large distances to Milky Way starburst clusters has so far hampered a systematic study of disk survival in the starburst environment. Thus far, NGC3̇603 YC is the only starburst cluster where the disk fraction has been determined.
Fortunately, our study of the Arches cluster has provided an opportunity to progress in this domain. We have obtained observations of the Arches cluster with the Keck II laser-assisted adaptive optics system (LGS-AO) during our proper motion campaign to study the kinematics, extinction and stellar mass distribution of the cluster core. In the central pc of the cluster core, we detect 24 sources with substantial 3.8m excesses of mag as compared to the cluster main sequence population. VLT/SINFONI K-band spectroscopy of three of these excess sources reveals CO emission, indicative of disk emission. The high contamination of field stars in the inner Galaxy particularly influences the fraction of main sequence sources at the faint end of the cluster main sequence population. The combination of a complete proper motion member sample among both the disk-bearing -band excess sources and main sequence stars allows us to obtain the first measurement of the disk fraction in the Arches cluster. With the aim of assessing the prediction of an environment-dependent disk lifetime, we determine the disk fraction as a function of radius and discuss the prospects for disk survival around high-mass stars in a dense cluster environment.
The observations of the Arches cluster are presented in Sec. 2. Results are presented in Sec. 3, where the excess sample is defined in Sec. 3.1, K-band spectroscopy of selected sources is analysed in Sec. 3.2, and the disk fraction of the Arches is derived in Sec. 3.3. The results are discussed in Sec. 4, including a comparison to similarly young star-forming regions (Sec. 4.2), and our results are summarised in Sec. 5.
2 Observations
2.1 Keck/NIRC2 imaging
2.1.1 Data reduction and PSF extraction
Five fields in the Arches cluster were observed in with the Keck II NIRC2 camera (PI: K. Matthews) with the laser guide star adaptive optics system (LGS-AO; Wizinowich et al. 2006, van Dam et al. 2006) between 2006 May and 2008 July. The field and tip-tilt star positions, distance from the brightest source in the cluster core and to the tip-tilt source are provided in Table 1. The central wavelengths and bandwidths for these NIRC2 filters are m, m, m, m, m, and m. The narrow camera setting with a pixel scale of delivered a field of view (FOV) of (Ghez et al. 2008). The LGS-AO system provided an mag wavefront reference source centered in the field of view. Two fainter natural guide stars with mag were used as tip-tilt reference sources, located from the center of each field. The adaptive optics performance was strongly dependent on the observing wavelength and on nightly atmospheric conditions. The average Strehl ratios were 0.15 in , 0.27 in , and 0.64 in . A mosaic of the five fields is illustrated in Fig. 3, and field positions and tip-tilt star offsets are provided in Table 1. A summary of the observations, including the observational details, the number of frames entering each final combined image, as well as the resulting Strehl ratios and spatial resolutions, can be found in Table 2.
The images were reduced with our NIRC2 python/pyraf pipeline (Lu et al. 2009), which includes dark and flatfield correction, sky subtraction, the removal of NIRC2 bad pixels and cosmic rays, and distortion correction (Thompson et al. 2001) prior to image combination. Ten separate sky frames were observed in each filter at the end of each 3 hour Arches observing block. From these open-loop, star-free exposures, a median sky frame was created for each filter, which was scaled to the median background value of each individual exposure prior to subtraction. In , a special procedure was employed to additionally account for structured thermal background caused by the Keck II field rotator mirror. Residual background structure was minimized by observing sky frames at the same rotator mirror angle as the science observations. Skies were taken with rotator angle increments of two degrees, and median skies were averaged from three adjacent rotator angle positions. We also note that the best performance is achieved in when sky frames are taken close in time to the observations. When sky frames were observed within one hour of our targets, the photometric sensitivity in the reduced images was typically 0.5 mag deeper than on the images observed earlier during the same night. Strehl ratios and full-width at half maximum (FWHM) values of the point-spread function (PSF) were derived for each individual image during the pipeline reduction. In observing sequences with less than 20 frames, all frames with closed-loop AO correction were combined into the final image. In observing sequences with more than 20 frames, frame selection to enhance the spatial resolution was possible without compromising photometric depth. In these sequences, only frames with were included in the final image, where was the minimum achieved in the sequence for each field and filter. This rejection criterion typically removed between 10% of the images under stable atmospheric conditions and 30% of the images in the case of variable seeing and AO performance prior to image combination. When frame selection was applied, the selected images were weighted by the Strehl ratio to enhance the resolution on the combined image. After the standard reduction procedures, the drizzle algorithm was used to combine the images to preserve the original resolution and to achieve the maximum sensitivity on the co-added image (Fruchter & Hook 2002).
Relative photometry was extracted using the starfinder algorithm (Diolaiti et al. 2000), which is designed to fit an empirical PSF to crowded stellar fields. The code has the advantage of creating an empirical 2-dimensional PSF by averaging several isolated sources, such that the extracted PSF is independent of fitted analytical functions. This is particularly crucial, as the Keck AO PSF cannot be characterized by azimuthally symmetric functions. The emploid version of the code is limited to non-spatially varying PSFs. The radial extent of the PSF was set for each field and filter by the radius where the PSF structure was dominated by background noise, and is listed in Tab. 2. In the cluster core, sufficiently bright and isolated sources could be found to define the average PSF. In the east fields (see Fig. 3), the rapidly decreasing density of bright stars limited the PSF template selection to 5-7 sources on field east1, and 3-5 sources on east2. The final PSF for each field was created iteratively after selection and subtraction of neighboring sources from each image. Three iterations were performed before the final PSF was extracted. The average empirical PSF then served as the template to fit simultaneous photometry for all sources in each frame.
In addition to the deep, combined images, the reduced frames were divided into three qualitatively comparable subsets and combined into three auxiliary images to estimate the photometric and astrometric uncertainties. The auxiliary frames are composed from the list of all selected images sorted by Strehl ratio. From this quality-sorted list, every third frame enters auxiliary frames 1, 2, and 3, respectively, to ensure the same quality in all three auxiliary frames. The random dither pattern with three images per pointing position and small dither offsets additionally ensures that image distortions are sampled in the same way in all three auxiliary frames. Starfinder positions and photometry were derived for point sources on the auxiliary images in the same way as for the deep data sets. As a first pass at rejecting faint, spurious detections caused by the varying halo structure of the PSF or fluctuations in the background, sources in and were required to be detected in at least one auxiliary frame in addition to the deep image in order to be included in the final photometry table. In addition, the auxiliary frames were used to estimate the photometric and astrometric uncertainties. In and , the uncertainties are dominated by crowding effects. The photometry of stars near bright sources is sensitive to the Strehl ratio of each image, and hence their individual measurements on the three auxiliary images vary more than for isolated sources. This crowding effect is not evident in the photometric uncertainties delivered during PSF fitting by starfinder, but is well reproduced in the rms uncertainties from repeated measurements on the auxiliary images. The astrometric and photometric uncertainties, shown in Figs. 4 and 5, are derived from the standard deviation (rms) of the positions and fluxes on the auxiliary images and the main image, and hence from the repeatability of each measurement. In , residual thermal background emission caused the sensitivity of the auxiliary images to be significantly lower than the sensitivity of the deep image, such that uncertainties are most affected by spatial sensitivity variations and not by crowding. The limited photometric sensitivity of the auxiliary frames restricted the number of sources matched with the photometry of the and images. With the goal of including the fainter sources detected only in the deep combined image in the final catalogue, all starfinder detections were matched with the photometric table. When sources were detected in the auxiliary frames, the photometric uncertainties were derived from the standard deviation of the repeated measurements. For faint sources not detected in the auxiliary frames, the starfinder signal-to-noise ratio (S/N) was used to estimate the photometric uncertainty. As PSF fitting does not account for background fluctuations, the starfinder S/N still appears to underestimate the photometric uncertainty in some cases. A comparison of the rms photometric uncertainties derived from the auxiliary frames and the starfinder S/N indicates that the starfinder S/N may underestimate the true photometric uncertainty by up to a factor of 4. These smaller uncertainties have a negligible effect on the final photometric uncertainty of each source, which is dominated by the uncertainty in the zeropoint (see Table 3). The final table thus contains as many sources as possible, while avoiding artefacts with the requirement that any source be detected in all three filters. This procedure resulted in a clean list of 380 detections and 1033 additional detections for the two-color analysis (Table 7).
2.1.2 photometric calibration
The photometry was calibrated with reference to the VLT/NAOS-CONICA (NACO) observations obtained in 2002 (Stolte et al. 2002, 2005, see also Stolte et al. 2008), covering a FOV around the cluster center with a spatial resolution similar to the Keck/NIRC2 observations (Tab. 2). The absolute calibration zeropoint for the NACO photometry is provided by lower resolution () HST/NICMOS calibrations presented in Figer et al. (1999). Five available 2MASS sources were used to check that the calibration with respect to the NICMOS filter system did not display systematic offsets with respect to the standard 2MASS system. As in our previous work, no color terms were found (Fig. 6). In order to verify that the use of a spatially invariant PSF did not alter the photometric performance across the field, photometric residuals were tested independently in the x, y and radial directions. A possible weak zeropoint variation of less than mag, comparable to the standard deviation of mag in and mag in in a sample of 76 calibration sources, may be present over the maximum radial extent of in the NIRC2 and data sets when compared to both NICMOS and NACO, but the linear fit indicates less than one sigma significance. As the variance is within our formal zeropoint uncertainties (Table 3), we apply a constant zeropoint across the field. With increasing distance from the field center, anisoplanatic effects are expected to affect the natural guide star observations with NACO most severely, while more modest effects are expected for the Keck LGS observations since the artificial guide star was pointed at the center of each field of view. This may explain the slight differences of 0.03-0.10 between the zeropoints of the NIRC2-NIRC2 and the NIRC2-NACO calibrations. In order to achieve a uniform photometric calibration across the NIRC2 mosaic area, we therefore apply a two-step correction process. First, absolute photometric calibration is obtained for the central core region from the comparison with NACO, and relative calibration of fields at larger distances from the guide star is then derived with respect to the cluster core. The core field is close to the guide star used both as the natural GS with NACO and as the tip-tilt source with NIRC2, such that anisoplanatic effects at increasing guide star distances are minimized (see Fig. 3). For the core field, we use only the innermost region within NIRC2 pixels to calibrate against NACO . The high stellar density in this area provides 56 sources with and mag for the absolute calibration, and zeropoint variations over this small area were confirmed to be negligible. The zeropoint offsets of the adjacent fields, “east1” and “lead” were derived with respect to the calibrated core field, and “east2” and the intermediate proper motion field “east1.5” were calibrated against “east1” (see Table 3). Only sources with relative photometric uncertainties mag, as derived from the auxiliary images (see above), were used as calibration sources. The halo field does not overlap with the core field, but its proximity to the guide star ensures that anisoplanatic effects are avoided. Hence, the halo field photometry was calibrated against the NACO field. The average zeropoints after airmass correction were 25.219 in , 24.578 in .
2.1.3 photometric calibration
In , where no previous data exist, absolute calibration was achieved using observations of the central parsec in the Galactic center (GC), where numerous previous long-wavelength observations are available (see Appendix, Tab. A.1, and for reference, see also Blum et al. 1996, Clénet et al. 2001, 2004). The central parsec was observed during the same night and at the same airmass as the Arches core field. The surrounding Arches fields were subsequently calibrated relative to the core field. The same observational setup was employed for both the Arches and the GC observations. Taking into account airmass variations, we first derived the zeropoint for the GC data by referencing against calibrated NGSAO observations reported in Appendix A. The final calibration was confirmed by matching with both the Blum and Clénet tables. This procedure ensures that the zeropoint offset between the (), used by Clénet et al. (2001) and for our data, and the () filter used in Blum et al. (1996) was accounted for. The difference between and is a constant offset in this case, as sources in the GC sample as well as in the Arches cluster have comparable line of sight extinctions (see Appendix B for details on the filter differences and the extinction law) 111Note that Viehmann et al. (2005) provided the most recent photometry in the central parsec, however, these data unfortunately display an extensive scatter in as well as , such that they could not be used as calibration sources.. The uncertainty in the zeropoint was estimated from variations of the zeropoints of individual images throughout the observation sequence. The derived GC zeropoint of mag was used to calculate magnitudes for the Arches core field after airmass correction. Possible temperature or atmospheric variations leading to a varying thermal or sky background during the two hours of observations cause the remaining uncertainty of 0.10 mag in the zeropoint. When the calibrated photometry was compared to the location of the reddening vector in the two-color diagram, the majority of sources was located below the reddening line. This is unexpected, as the cluster population is dominated by main sequence stars, and the field population is dominated by field giants. The intrinsic colors of main sequence stars are close to zero in the standard magnitude system, such that the reddening vector also passes through the origin in the two-color diagram, and main sequence stars behind substantial foreground extinction, such as the Arches members, are expected to scatter around this vector according to their photometric uncertainties. A shift of mag allowed for both cluster stars and background sources in the Arches field to follow the extinction vector (see Sec. 3.1.1 below), as expected. Such a zeropoint shift can be explained by the difference in the average extinction between the GC calibration sources, mag and Arches cluster members, mag. mag corresponds to a difference of mag when calibrating with respect to data (see appendix B for details). This offset is, however, also consistent with the zeropoint variation across the two hour GC observing sequence due to thermal background variations across the night. As the offset is within the zeropoint uncertainties, it was applied to the absolute calibration.
All adjacent images were calibrated with respect to the core, and as in the case of , the zeropoint uncertainties were calculated based on the standard deviations of the photometric residuals of the calibration sources after the zeropoint was applied. In the halo field, four acquisition exposures with total exposure times of 30s each were obtained with one third of the acquisition images overlapping the core field, and two thirds overlapping the lower-density halo field. The acquisition exposures were combined to provide a calibration field for the halo field photometry. The zeropoint of the acquisition image was obtained with respect to the core, and the halo field was calibrated with respect to the acquisition image, consecutively. The reported systematic zeropoint uncertainty in for this field is comprised of the standard deviations of the photometric residuals of the acquisition and halo fields.
2.1.4 Zeropoint uncertainties
Zeropoint uncertainties are estimated from the standard deviation in the photometric residuals of calibration sources after the zeropoint was applied (Table 3), and are included as systematic uncertainties in all reported photometric uncertainties. Where several fields had to be used consecutively to obtain the absolute zeropoint, the standard deviations from each field were added in quadrature to obtain the final zeropoint uncertainty. The zeropoint uncertainties in east1 comprise the quadrature sum of the core NIRC2-NACO residuals (first row in Table 3) and east1 residuals (, , ). The intermediate field east1.5 was only observed in for proper motion membership. The zeropoint uncertainty contains the standard deviation from all consecutive calibrations (i.e., the zeropoint uncertainties of core and east1), added in quadrature to the measured standard deviation in east1.5 () after calibration. The east2 zeropoints were derived from field east1.5 in , and field east1 in and , and the uncertainties contain the uncertainty in the core, east1 and east1.5 calibration in addition to the residual standard deviation in east2 after calibration (, , ). The leading field zeropoints were derived from overlap with the core field, and the uncertainties include the quadrature sum of the core zeropoint uncertainties and the standard deviation in the residuals of the leading field after calibration (, , ). The halo field photometry was zeropointed against the NACO catalogue. The zeropoint uncertainty is the residual standard deviation in the calibration sources after the zeropoint was applied. photometry on the halo field was calibrated in two steps with respect to an aquisition exposure with significant overlap to the core and halo fields. The zeropoint uncertainty contains the uncertainties in the core and aquisition image calibrations in addition to the residual standard deviation in the halo field after the zeropoint was applied (, , ). Final zeropoint uncertainties from this procedure are tabulated in Table 3.
2.1.5 Photometric uncertainties and completeness limits
Fig. 4 shows the relative photometric uncertainties in each field, color-coded by filter. As discussed above, the relative uncertainties were derived from the repeatability of each photometric measurement from the three auxiliary images in each field and filter. These uncertainties illustrate the filter dependence in the photometric accuracy and the uniformity between the different observations. The absolute uncertainty is dominated by the systematic zeropoint uncertainty, which appears as a constant offset in these plots and is not included here, such that the relative measurement uncertainties can be directly compared. The dashed lines indicate the peak in the observed luminosity functions (LF) as a proxy for the completeness limit. In the crowding limited field of the Arches core, the non-detection of sources in high-density regions shifts the peak of the LF to brighter luminosities. While numerous stars can thus be detected at magnitudes fainter than the LF peak, the sample beyond this limiting magnitude will be incomplete. In field east1 (middle panel), where only 10 frames with good AO correction were obtained, the -band photometry is significantly shallower. Where sources were detected in the overlap regions between east1 and the cluster core or east2, sources were preferentially selected from the more complete core and east2 photometric samples. The last column in Tab. 2 contains the peak of the luminosity function (LF) in each field and filter, which we identify as the completeness limit. In the crowding-limited cluster core, the completeness limits are 19.0, 19.5, 14.0, and in the remaining fields the average limits are 20.5, 19.5, 14.5 in , respectively. The total numbers of unique sources detected in all three filters in the core, east1, east2, leading, and halo west fields are 173, 32, 39, 73, and 63, respectively. These samples are limited by completeness, and faint sources without -band excess will not be included in this sample. For the derivation of the excess fraction, it is crucial to have a complete main sequence reference sample (see Sec. 3). Hence, we also define a sample of detections down to the -band completeness limit of 19.0 mag in the most crowding-limited cluster core. The sample includes 261, 63, 75, 108, 61 unique detections with mag in the core, east1, east2, leading, and halo west fields, respectively. Note that these samples are not yet selected for cluster membership, but include the full number of detections in our fields.
2.2 Proper motion membership
Following the procedures detailed in Stolte et al. (2008), the -band catalogue was matched with VLT/NAOS-CONICA observations, providing a time baseline of 4.3 years. As different fields were observed over several years with NIRC2 during different atmospheric conditions, the geometric transformation of each NIRC2 -band image was derived with respect to the larger NACO image individually. The transformations are derived iteratively, with the first pass determined from bright, likely cluster members, and the second pass from a preliminary selection of member candidates of all magnitudes to improve spatial coverage and thus the quality of the transformation. This procedure ensures that variations due to adaptive optics performance and airmass differences are removed. Note that this also implies that internal cluster motions, which are expected to be below our NIRC2-NACO proper motion accuracies, are also minimized and cannot be detected with this method. A comparison of NIRC2-NIRC2 epochs leading to the determination of internal motions will be the topic of a forthcoming paper (Clarkson et al. 2010, in prep.). In addition to the core members determined in Stolte et al. (2008), we have included sources with membership information on field east1, as well as on the leading and halo-west fields, where overlap with the NACO data set is available (see Fig. 3). A total area of 442 square arcseconds was observed in , of which 312 square arcseconds are also covered with NACO. Fields east1 and east2 did not overlap entirely with our NACO observations. The intermediate field east1.5 covering the missing portion of the eastern part of the cluster was re-observed with Keck/NIRC2 in July 2008 to obtain second-epoch images (see Tab. 2), which increases the area with proper motion measurements to 392 arcseconds squared. Hence, 90% of the coverage has proper motion information. The standard deviation in the proper motions of cluster members derived for fields east1/east2 using east1.5 as proper motion reference over a two-year baseline with NIRC2 was comparable to the astrometric residuals in the four-year NACO-NIRC2 comparison, such that no distinction between the two data sets had to be made.
Only stars brighter than the core -band incompleteness limit (peak of the LF), mag, were included in the fit, as these stars represent the main sequence sample in the analysis below. The membership selection of stars brighter than mag is illustrated in Fig. 7. The gaussian fit to the strong concentration of stellar motions in this sample yields a proper motion dispersion of mas/yr, and stars within 2-sigma of the peak, or a proper motion of less than 1.30 mas/yr relative to the average motion of the Arches cluster, were considered cluster member candidates (hereafter ’proper motion members’). In the following sections, members and non-members will be distinguished on the basis of this selection criterion. As a consequence of the different resolutions in the two data sets, the proper motion table is not complete in the cluster core. Faint sources or close neighbours resolved with the 53 mas resolution obtained in the NIRC2 -band images were not always resolved with the 84 mas resolution obtained with NACO. This leads to 16 sources without proper motion information in the cluster core, one of which has -band excess (see Sec. 3). The membership status of the 15 sources without excess is uncertain, and therefore these are not considered members. The detection of -band excess suggests that this one sources belongs to the cluster, such that this source is included, albeit seperately, in the discussion below.
This procedure provides membership information for 479 (84%) sources of the 568 detections with mag, including 335 cluster members. The final catalogue, which is limited by the detection threshold of mag, contains 362 detections with mag, of which 331 (91%) have proper motion information and 235 are cluster member candidates within the 2-sigma member selection criterion.
2.3 VLT/SINFONI K-band spectroscopy
VLT/SINFONI integral-field spectroscopy was obtained in the core of the Arches cluster between 2006 May and 2006 July. The medium pixel scale with mas/pixel spaxels delivered a field of view of , and the grism yielded a mean spectral resolution of 1750. Two fields in the cluster core were observed, and the total integration time was 2 hours per field split into 4 spectral cubes of 30 min each. Each cube consisted of six individual 300 s exposures obtained with an ABBA dither pattern alternating between science and sky frames pointed to a dark region near the cluster to account for variable sky levels in the near-infrared. The spectra were extracted from the pipeline-reduced data delivered by ESO, which includes standard sky subtraction, flat fielding, masking of hot pixels, and wavelength distortion correction and calibration. The wavelength scale was rebinned to an equal wavelength spacing of 0.0005/pixel, providing a nominal spectral resolution of 2000 at 2.2 or 140 km/s per wavelength element. From telluric lines, a spectral resolution of 1900 is measured near 2.2, or 160 km/s (FWHM). Telluric correction was achieved either with a G2V or a B3V calibrator observed during the same night. In the case of the G star, the rebinned, high-resolution solar spectrum available from KPNO was used to remove intrinsic stellar features, while for the B3V calibrator, the broad hydrogen lines were removed using template spectra from the -band atlas of Hanson et al. (1996). In order to correct for flexures in the SINFONI instrument, the telluric spectra were cross-correlated with bright stars in the science cubes, sub-pixel shifted and rebinned to the original wavelength scale. This procedure resulted in a clean removal of almost all telluric lines, except for one residual line at 2.355, visible as a strong contaminant at the location of the third CO overtone in all the spectra. This line might originate locally near the telescope or inside the instrument, as telluric sky correction did not allow for its removal in either of our science data cubes. Three sources with excess (see Sec. 3.1.1) were located in two SINFONI fields. For these three -band excess sources with and 15.5, the spectra of three to four data cubes were added to provide the final, extracted spectrum of each source with signal-to-noise ratios (S/N) of 40, 65, and 60, respectively, in the continuum near the CO emission band heads.
3 Results
3.1 Photometric and spectroscopic evidence for circumstellar disks in the Arches cluster
3.1.1 Identification of -band excess sources
Near-infrared excess at wavelengths longward of 3 microns can be caused by circumstellar dust emission. At different stages of stellar evolution, the emitting molecular material can be found in different geometries around the central star. In very young main sequence stars, dust emission is attributed to the existence of a circumstellar disk, assumed to be the remnant disk from the accretion phase of the star. A remnant disk is less likely for high-mass stars earlier than spectral type B3V, where native material is evaporated by UV radiation from the central star on timescales of one to a few Myr (Richling & Yorke 1997, Hollenbach et al. 2000). At later stages of high-mass stellar evolution, in particular during the Wolf-Rayet (WR) phase, the winds of high-mass stars can produce massive, dusty envelopes, in which the stellar light is also reprocessed and emitted at near- to mid-infrared wavelengths (see Crowther 2007 for a review).
The , two-color diagram (Fig. 8) allows us to distinguish sources with enhanced foreground extinction from infrared excess sources. The solid line indicates the reddening path of an A0 star using the extinction law as measured towards the GC (Rieke & Lebofsky 1985). In Fig. 8 (left), cluster members are plotted in light blue, while non-members are displayed in red. Black dots indicate stars without membership information. The bulk of the Arches members follow the reddening vector, as expected from the range of extinctions of mag observed towards the cluster center (see also Stolte et al. 2002, Espinoza et al. 2009). Non-members are preferentially found at higher extinctions, but still concentrated around the reddening path. The proper motion member sample of Arches cluster stars is shown in the right panel of Fig. 8. The efficiency of the membership selection is evidenced by the lack of sources above a foreground extinction of mag along the reddening vector. A significant sample of extremely red cluster members with mag is found to the right of the reddening vector, clearly distinct from both the cluster main sequence and the field populations. For these excess sources, we have to investigate whether they are evolved high-mass stars, or whether the excess emission stems from a circumstellar disk.
Spectroscopically classified evolved, high-mass stars (Martins et al. 2008) are indicated as crosses and asterisks in the two-color diagram. While O4-6 supergiants cluster close to the main sequence population, nitrogen-enriched WN8-9h stars occupy the locus of classical T Tauri stars (CTTS, Meyer et al. 1997), which represents characteristic colors for young, disk-bearing stars. The -band excess of these Wolf-Rayet stars is, however, not caused by disk emission, but originates in extended dusty envelopes produced by their strong stellar winds. Three of the brightest cluster members ( mag) not covered by the Martins et al. (2008) spectroscopic survey of evolved stars display colors comparable to the identified WN8-9h stars, indicating that these sources have also started their post-main sequence evolution. These contaminants in the two-color diagram are found only in massive star clusters, and are not a source of uncertainty in the disk fractions measured in lower-mass star-forming regions. For the purpose of deriving the disk fraction in the Arches cluster (Sec. 3.2), evolved stars with mag are excluded from the excess sample representing circumstellar disks.
Several very red cluster members with excesses of at least mag redder in than even the evolved cluster population stand out in the two-color diagram at mag. While the spectroscopically studied sources in Martins et al. (2008) comprise the brightest part of the cluster main sequence with likely progenitor masses above , the comparison with the CMD (Fig. 9) reveals that the extreme excess sources are faint. With -band magnitudes of 14.5 to 18 mag (Tab.4), their stellar masses are expected to be substantially lower than Wolf-Rayet stars (Sec. 3.1.2). As the spectra of three of these sources with large -band excess display strong CO bandhead emission lines (Sec. 3.2), their -band excesses most likely originate in circumstellar disks.
Formally, we define disk sources as cluster members with colors
too red to be reddened main sequence stars, and that are too faint to
be Wolf-Rayet stars ( mag).
To distinguish sources with significant excess from the cluster
main sequence,
we determine the standard deviation in the main sequence population from
the rms in the and color of stars with
mag to be mag and mag.
The 2-sigma ellipse with a major and minor axis of twice the derived
standard deviations in and , respectively, is shown in the
two-color diagram in Fig. 8.
Note that the apparent circular shape of the ellipse is a consequence of
the unequal axis spacing. The tangent lines parallel to the reddening vector
(dashed lines) indicate the color regime where cluster stars with higher
foreground extinctions can be found. The color variations of sources
above the reddening path are dominated by their photometric uncertainties.
These randomly scattered sources above the reddening path are enveloped
by the dashed lines, indicating that all main sequence members without excess
both above and below the reddening path are confined between these 2-sigma limits.
Hence, we define stars significantly beyond these 2-sigma limits as excess sources.
Specifically, sources to the right of the lower dashed line in Fig. 8
are required to meet the following criteria:
where the slope of the Rieke & Lebofsky (1985) extinction law is given by
.
The y intercept is determined by the shift of the reddening vector to the tangent of the 2-sigma ellipse, . and denote the photometric color uncertainties of each source. These requirements imply that sources are counted as having an excess when their colors are significantly to the right of the 2-sigma reddening band in and significantly downward of the 2-sigma reddening band in . Fig. 8 (right) shows the selection of significant excess members as diamonds. The bulk of the excess sample is shown in the insert in Fig. 8 (right) with photometric uncertainties, illustrating that the uncertainty in the colors of each excess source cannot account for their observed distances from the main sequence locus and the reddening band. With these selection criteria, 24 -band excess sources are detected with mag. In addition, six stars with mag are located close to the CTTS locus, but are consistent with a locus inside the reddening band when their photometric uncertainties are taken into account. These sources can either be main sequence cluster members suffering enhanced foreground extinction along the line of sight or sources with weaker excesses. As the nature of these stars cannot unambiguously be determined at this point, they are not included in the excess sample. The photometric properties of the -band excess sources are summarized in Table 4. Of the 24 sources with infrared excess, 23 have measured proper motions (red diamonds in Fig. 7), while one star is not resolved in the NACO reference image due to its proximity to a bright neighbor. One source, located at the edge of the NIRC2 field of view, is formally a non-member, but its positional uncertainty in the x direction is a factor of five higher than the mean uncertainty in the excess sample and does not allow for a final conclusion on its membership. The second formal non-member is blended with a source of comparable brightness, and the two sources are not well resolved in the NACO -band reference image. All 21 infrared excess sources with reliable proper motion measurements are proper motion members of the Arches cluster. It is extremely unlikely to find 21 sources with specific colors to be cluster members simultaneously. The region in the proper motion plane covered by the majority of the field stars amounts to , while the excess sources cover an area of , and the full 2-sigma circle is exactly . Hence, the likelyhood to find a single field source inside the 2-sigma candidate circle is 5.15/50 = 0.10, and the likelyhood to find 21 sources in this area of the proper motion plane simultaneously is only . Given the uncertain proper motion of the 3 remaining sources with -band excess colors, we consider all 24 sources members of the cluster.
Within the completeness limit in the cluster core, mag, the -band excess cluster members occupy a magnitude range of , and span a color range of (Tab. 4). The cluster main sequence population covering the same -band magnitudes displays a mean color of mag (rms). With a mean color of mag (rms), the 19 -band excess members with mag are separated from the cluster main sequence by mag, and hence are redder than the mean main sequence color by at least 0.6 mag (see Fig. 9, right panel). The comparison with the CMD shows that the excess sources are not revealed by photometry alone. In particular, the bluest sources with -band excess emission overlap in the , CMD with the color-magnitude location of the red clump in the nuclear bulge ( mag, mag, for mag, mag, Alves 2000). The empirical location of red clump stars stands out in our non-member sample as a clustering at , mag and is marked with a red box in the CMDs. The ambiguity between excess sources and red clump stars is resolved in , emphasizing the importance of -band observations to derive disk fractions in young star clusters. The completeness limits indicate that the detection of fainter excess candidates is limited by the current -band completeness limit of mag in each field.
In summary, we detect 24 sources with significant -band excess, of which all 21 excess sources with reliable membership information are proper motion members of the Arches.
3.1.2 Spectral types and stellar masses of disk host stars
In the Arches cluster, photospheric flux measurements of excess sources at visible wavelengths are prohibited by the large foreground extinction towards the GC. Hillenbrand et al. (1992) provide evidence that photospheric emission dominates the SED of Herbig Be stars below m, i.e. -band. Even in -band observations, however, most fainter sources are veiled by the foreground extinction of mag towards the Arches (Stolte et al. 2002). The CMD (Fig. 10) shows that the near-infrared excess in is substantially smaller than in . The Arches excess sources display on average about 0.5 mag less excess than the Hillenbrand Herbig Be sample, shown as box points. A lower excess at smaller wavelength indicates that the hot, inner disk rim becomes increasingly depleted at these ages, possibly due to the existence of a growing inner hole. As a consequence, the -band flux of the excess sources will be closer to the expected main sequence flux than in younger excess populations. Hence, we use the -band magnitude to derive an approximate mass range for the excess population.
The -band magnitudes are compared to a solar-metallicity, 2.5 Myr main sequence isochrone from the standard set of Geneva stellar evolution models (Lejeune & Schaerer 2001). The foreground extinction to each excess source (Tab. 4) is measured from the color of the four nearest cluster members without excess emission using a Rieke & Lebofsky (1985) extinction law. The variation in visual extinction ranges from 22.7 to 27.9 mag, or to 3.1 mag. The variation between individual neighbouring sources used to estimate the average extinction on the line of sight to each excess source is large, yielding standard deviations of up to mag. The bright stars concentrated towards the cluster center have blown a cavity evidenced by a lower reddening in the cluster core (Stolte et al. 2002). The mean foreground extinction towards the cluster center is therefore determined from the upper main sequence, mag and mag, which is least biased by variable extinction (see Fig. 9), to . This value is identical to the mean foreground extinction of mag of the excess sample. As substantial small-scale spatial variation leads to the large uncertainties in the extinction of each excess source, we use the average extinction towards the excess sample for stellar mass computation. The extinction of mag and a distance modulus of mag (8 kpc) are applied to the isochrone magnitude. No color transformation to the Mauna Kea system was applied, as the difference is smaller than 0.05 mag (Carpenter 2001, Hawarden et al. 2001). The 19 excess sources above the core -band completeness limit are observed within a magnitude range of mag, corresponding to a mass interval of . On the zero-age main sequence (ZAMS), these masses correspond to spectral types B1V - B6V. Two excess sources with and are not included in the complete disk sample, and the comparison of their faint -band magnitudes with a Geneva 2.5 Myr isochrone indicates that disk-bearing A stars (Herbig Ae stars) with masses down to at least exist in the Arches cluster. Likewise, when the maximum foreground extinction uncertainty of mag, corresponding to mag, is taken into account, the full allowable mass range could be as large as . A similar lower mass limit is obtained by allowing for an unaccounted residual -band excess, which might influence the luminosities of the reddest excess sources in the sample, which have colors similar to the Hillenbrand Group I star/disk systems. Characteristic -band excesses in very young Herbig Be stars are in the range 0.3-1 mag (see, e.g., Fig. 2 in the Herbig Ae/Be survey of Hernández et al. 2005). If we allow for a maximum -band excess of 1 mag in the two reddest excess sources, these sources could also have masses as low as . At the same time, a small fraction of the disks should be seen edge-on, and for these sources local extinction in the optically thick disk causes additional dimming of the -band flux. A circumstellar visual extinction of 10 mag corresponds to 1.7 mag in (Rieke & Lebofsky 1985), such that some of the excess sources could be intrinsically brighter with masses in excess of .
In summary, the -band luminosities of the excess population indicate that several A5V to B0V stars within a maximum mass range of feature disks in the Arches cluster.
3.2 Spectroscopic evidence for circumstellar disks
3.2.1 CO bandhead emission and evidence for disk rotation
-band spectra of 3 of the 24 -band excess sources are shown in Fig. 11. The red lines are the extracted spectra of the excess sources from the SINFONI data cubes, while the black spectra are bright stars located in the immediate vicinity of each excess source. All 3 excess sources display strong CO bandhead emission with the first and second overtones at 2.29m and 2.32m, respectively. The first two overtones are detected at high S/N ratios of 34-118, where the first overtone is always stronger by approximately a factor of two as compared to the second overtone emission.
CO bandhead emission in high-mass YSOs with spectral types O6-B5 are observed in NGC 3576 at ages below 1-2 Myr (Figuerêdo et al. 2002, Blum et al. 2004) and in the very young Myr cluster NGC 6618 in M17 (Hanson et al. 1997, Hoffmeister et al. 2006). There is increasing evidence that the CO bandhead emission originates in rotating disks. In agreement with previous disk models (Chandler et al. 1995, Bik & Thi 2004, and Blum et al. 2004), Bik et al. (2006) conclude that the CO bandhead emission is produced in the warm (1500-4500 K), dense, and optically thick region within a few AU from the central star. The column densities required to model the CO line profiles in high-resolution spectra, (Kraus et al. 2000, Bik & Thi 2004), suggest that CO molecules survive at these radii as a consequence of self-shielding (Bik & Thi 2004, and references therein). Blum et al. (2004) and Bik & Thi (2004) showed that excellent fits to the ro-vibrational CO 2-0 bandhead emission (m) are obtained with rotating disk models, which particularly well account for the slope of the blue wing of the CO overtones, as well as the redshifted peak. Wind models from stellar or disk winds around young, massive objects, on the other hand, predict a vertical blue edge to the overtone emission band and thus cannot account for the observed slow rise in the blue wing (see Kraus et al. 2000 for a detailed comparison of these scenarios). High-spectral resolution observations of the blue emission wing in the first CO overtone lent increasing support to the rotating disk interpretation. In particular, Blum et al. (2004) model the CO bandhead emission of four high-mass () YSOs as Keplerian disks originating in the inner 1 AU from the central star with rotation velocities between 25 and 260 km/s. Spectral models by Bik & Thi (2004) reveal that the CO bandhead emission originates in the inner parts of a thick accretion disk at radii 0.1-5 AU.
The source with the strongest CO bandhead emission (top spectrum in the right panel of Fig. 11) displays a slanted ascent in the blue wing of the first overtone. The slope in the blue wing is particularly evident in comparison with the steep drop of the CO absorption in the nearby background giant, where the envelope emission shows no signs of rotation. The shape of the blue wing is very similar to the Keplerian disks modelled in Bik & Thi (2004). Although the moderate spectral resolution prohibits the derivation of the rotational velocities of the Arches excess sources, all six detected bandheads are consistent with a slow increase in the blue wing. We therefore conclude that the CO bandhead emission originates in the optically thick inner parts of rotating circumstellar disks.
In addition to CO emission, two of the three excess source spectra display a weak Br absorption feature. Circumstellar disks in young OB associations typically show strong Br emission (e.g., Hanson et al. 1997, Bik et al. 2006).222Note that the more evolved Classical Be stars and B[e] supergiants also show near-infrared excess, yet are characterized by strong hydrogen emission lines. These objects are superluminous as compared to their main sequence B-type counterparts, while the excess sources in the Arches cluster are comparably faint. In particular, the gas around high-mass stars earlier than B3V is expected to be ionized by the EUV radiation from the central star. As indicated in the schematic model of a circumstellar disk around a massive protostar (Fig. 12, adopted from Bik et al. 2005), Br emission is expected from the inner disk rim as well as from the illuminated disk surface. The spectral types of the disk-bearing stars with spectra are therefore likely later than B3V.
The increasing evidence of rotating disks around high-mass stars indicates that late O and early B stars form via disk accretion in a similar fashion to their low-mass counterparts (where CO bandhead emission is also interpreted as evidence for thick accretion disks, e.g. Carr et al. 1993, Chandler et al. 1995), which has a profound impact on the paradigm of high-mass star formation.
3.3 Disk fraction and radial dependence
3.3.1 Disk fraction
With the conclusion that the excess sources in the Arches cluster are dense circumstellar disks, and the membership information from proper motions, we can estimate a robust disk fraction among the B-star population of the Arches cluster. Given that all 19 -band excess sources in the complete, mag, sample with precise proper motion information are cluster members, we have concluded in Sec. 3.1.1 on the basis of their exceptional colors that all 22 sources with -band excess and mag belong to the young Arches population. The main sequence population, on the other hand, is contaminated by foreground and background stars. Hence, we only consider proper motion members in both the excess and main sequence samples to determine the cluster disk fraction.
The -band completeness limit in the cluster core is the most stringent limitation for the detection of main sequence stars. The corresponding population of main sequence cluster members with mag detected in all three filters is additionally limited by the -band detection limit. Completeness limits of 13.5 - 14.5 mag imply that only early B-type stars with masses in excess of can be detected on the main sequence, where excess emission is absent. The stellar mass range indicated for the -band excess sources is therefore largely below the detection limit of diskless main sequence cluster stars, such that the reference main sequence sample is incomplete. The fraction of sources with -band excess (hereafter excess fraction), defined as the ratio of sources with -band excess over all cluster members with and without excess, , would yield an upper limit to the disk fraction. This limitation can be mitigated by not requiring main sequence stars to be detected in , which increases the main sequence sample from 216 detections to a total of 311 cluster members with mag and mag. The six excess sources falling into the main sequence color regime are excluded from the main sequence sample. Five stars are substantially bluer than the Arches main sequence and may be foreground interlopers which incidentally have similar proper motions. These stars with mag were also rejected. The remaining spread in color in the main sequence sample is caused by extinction variations. This selection leaves us with a main sequence reference sample of 300 sources.
Excluding the three excess sources without (reliable) membership information, and the two sources beyond the -band completeness limit in the core, mag, the comparison sample of excess sources as defined in Sec. 3.1.1, contains 19 stars, indicating a disk fraction of % among B-type stars in the Arches cluster.
3.3.2 Radial distribution of excess sources
As detailed in Sec. 1, the dense environment of a starburst cluster is likely to destroy disks more rapidly than low-density star-forming regions sparse in OB stars. This is particularly the case in the compact core of the cluster, where the exceptionally high density of more than could lead to significant destruction of disks in the immediate cluster center as compared to larger distances from the core.
With a total of 19 -band excess sources in the complete sample, we can begin to investigate the radial distribution of candidate disks in the Arches cluster. In Fig. 13, the histograms of main sequence cluster members with mag without excess (top solid line) and of members with -band excess (bottom solid line) are shown. Radial bins are chosen to contain similar total number counts to minimise systematic uncertainties. The relative fraction of excess sources with respect to main sequence members is labelled, along with the propagated uncertainty. In addition, the absolute number counts of main sequence members with and without excess are given. The right panel of Fig. 13 displays the excess fractions vs. radial distance from the Arches cluster center. The substantial uncertainties shown as solid lines originate from the low number of excess sources in each bin. The cluster center distance corresponds to the median of main sequence stars in each bin; the radial range covered is indicated by dotted lines. Despite the large statistical uncertainties, there is a strong indication that the disk fraction is significantly lower in the cluster core than at larger radii.
Before concluding that the excess fraction is depleted in the cluster core, incompleteness effects due to the higher stellar density have to be excluded as the source of the observed trend in the disk fraction. Artificial star simulations were carried out in the magnitude range mag to probe the completeness of the main sequence sample, and mag to test the disk sample for incompleteness effects. A maximum of 50 artificial stars were randomly inserted in the images to preserve the original stellar density. One-hundred such frames were created in each field, leading to a total of approximately 5000 artificial stars in the probed magnitude ranges. The results of these tests are shown in Fig. 14. The histograms (left) show the inserted (thin lines) and recovered source counts (thick lines) in and . The asterisks in the histograms show the faintest disk source in each of the three fields displayed. The right panel displays the recovery fractions vs. magnitude for and . The completeness fractions are above 85% in the outer fields east1 and halo, and drop to 80% in the cluster core in the faintest included magnitude bin, for and mag. The completeness fractions are comparable on the main sequence and in the disk sample. Only very few sources are actually located in these faint magnitude bins; in the most crowding-limited cluster core sample, only 10 out of 208 main sequence sources are found in the faint bin, such that the 20% correction adds a mere 2 sources to the core main sequence sample. Similarly, all disks in the cluster core are brighter than mag, although the simulation readily detects sources down to mag. As crowding is not affecting detections in the outer fields, the incompleteness effects are entirely negligible at larger radii, as expected. As a consequence, even when we account for incompleteness, the disk fractions at all radii do not change appreciably.
In conclusion, the disk fraction in the Arches cluster increases significantly from 2.7% in the cluster core, with pc, to 9.7% at pc.
4 Discussion
4.1 Disks in the Arches cluster
The finding of disks in the Arches B-star population is unexpected for two reasons. First, disk depletion depends on the UV radiation of the host star. The -band brightness of the disk-bearing stars suggests that the majority are B-type stars. As the characteristic UV evaporation timescale of a primordial disk around Herbig Be stars is less than 1 Myr (Alonso-Albi et al. 2009), a disk lifetime of 2.5 Myr for B-type stars implies that the disks had to be massive initially. Secondly, disk destruction is expected to be accelerated in a starburst cluster environment. The extreme UV radiation from numerous O-stars adds to the evaporation by the disk host star. At a density of , interactions cause additional tidal truncation especially of the extended outer disks (Olczak et al. 2006), which in turn enhances the exposure of the inner disk to the cluster radiation field. The detection of optically thick disks with substantial -band excesses close to the cluster center suggests that the disk-bearing sources have migrated into the sphere of influence of the central O-type stars only recently, or are viewed in projection toward the cluster center. The radial increase of the disk fraction toward larger cluster center distances evidences the influence of the radiation field and high stellar density in the cluster core on primordial disks. Speculatively, one can envision a scenario wherein disk-bearing stars migrate inward during the mass segregation process and once close to the cluster center lose their disks rapidly. Taking into account that some of the core sources might be in front of or behind the cluster center, the very low excess fraction of only 3% in the cluster core is already an upper limit to the disk fraction inside the core radius of 0.2 pc. The disk fraction of 10% for stars with (0.28 pc) in the same stellar mass range provides stringent evidence that the starburst cluster environment enhances the depletion of primordial disks as soon as their orbital motion moves disk-bearing stars close to the cluster center. In the future, the increasing proper motion accuracy might provide trajectories of these sources to understand their orbital motion in the cluster.
From observations of lower-mass star-forming regions, we might expect an increase in the disk fraction towards stars with later types, such as AFG stars. If the same processes dominated disk destruction in a starburst cluster, a substantial increase in the disk fraction in fields with deeper -band observations should be observed, which is not the case. For instance, in the leading field with a peak in the luminosity function of mag, the same number of 5 excess sources is observed as in the shallower east1 and core fields with peak luminosities of only 13.5 and 14.0 mag. If the disk fraction would mostly be determined by the UV evaporation from the B-type host stars, then the deeper detection limit in the leading field should yield a significantly larger fraction of disks than the shallower fields, especially when compared to the east1 field with similar stellar density. The fact that an increase in the disk fraction towards fainter stars seems not to be observed in the Arches cluster strengthens the interpretation that the starburst environment affects disk survival. It appears that stars later than B lose their disks more rapidly in a starburst cluster environment than in moderate star-forming regions, indicating that the influence of the ambient UV radiation field and encounters indeed shorten the disk survival timescale.
In Fig. 10, the Arches population is compared to disks from the most extensive Herbig Ae/Be survey of Hillenbrand et al. (1992). The Herbig Be star disks were shifted to the distance and foreground extinction of the Arches cluster. The Arches sources are systematically fainter than the primordial Group I star/disk systems in the Hillenbrand sample, which is the youngest group with ages of a few Myr. In addition, the Arches disks cover colors closer to the main sequence than primordial Herbig Be disks, while still displaying significantly larger excesses than the Group III sources with depleted disks in the Hillenbrand sample. Also included in the CMD are -band excess sources in NGC 3603 at an age of 1 Myr (Stolte et al. 2004, Harayama et al. 2008). The brightest disks in NGC 3603 are comparable in color and magnitude to the Arches sources. The difference between the disks in the Arches and NGC 3603, compared to the primordial disks studied by Hillenbrand et al. (1992), illustrates that the transition from primordial, optically thick dusty disks to evolved disks subject to evaporation and grain growth is a rapid process that happens at an age of approximately 1-2 Myr.
4.2 Comparison with other young, massive clusters
One of the best studied, nearby star-forming regions sufficiently massive to host O-type stars is the Orion Nebula Cluster (ONC) with a disk fraction of 78% in the predominantly low-mass population (Lada et al. 2000). The finding of significantly different disk fractions for high- and low-mass stars (80% for low-mass stars with , 42% for OBA stars) in this study corroborates the dependence of the disk depletion timescale on the mass of the central star. The ONC provides a very early stage of a massive cluster at an age of 1 Myr, and allows predictions of the effects of close encounters with the UV radiating O-star. Dynamical simulations of disk evaporation in the ONC suggest that, while outer disks are depleted, the inner disk is capable of surviving out to 10 AU in the immediate vicinity of the central O6 star C Ori (Scally & Clarke 2001). The possibility of survival of dense, inner disks around B-type stars up to ages of 10 Myr was also predicted theoretically from hydrodynamic simulations taking into account various levels of photoevaporation, disk-stellar wind interaction, mass loss from disk winds, and the evaporative depletion by nearby O stars (Richling & Yorke 2000, see Hollenbach et al. 2000 and Zinnecker & Yorke 2007 for reviews).
At an age of 2.5 Myr, the Arches cluster fills a rarely sampled gap between the very young UCHII regions and deeply embedded clusters and the more evolved open clusters. As one of the most massive young, compact star clusters in the Milky Way today, it is one of the rare loci where stars with masses above were formed. With a population of at least 125 O-type stars (Sec. 1), the cluster UV radiation field of photons s-1 is intense (Lang et al. 2001). When comparing the disk fraction in the Arches with moderate star-forming regions, where disk fractions are studied among lower to intermediate mass stars (), the major problem is to distinguish the effects of the mass dependence and the environment.
A comprehensive survey of Herbig Ae/Be stars in nearby OB associations was carried out by Hernández et al. (2005). In the six star-forming regions with ages 3-16 Myr, these authors find that only a small fraction, 0 - 5% of intermediate mass stars (), are in the Herbig Ae/Be phase, which they interpret as the fraction of intermediate-mass stars having retained dusty inner disks, in agreement with our findings above. From the comparison of disk frequencies around low () to intermediate mass stars, Hernández et al. (2005) conclude that at an age of 3 Myr, the fraction of disks around intermediate mass stars is ten times lower than around their low-mass counterparts.
In Fig. 15, we reproduce the disk fraction vs. age diagram for nearby star-forming regions from Haisch et al. (2001), including recent results on a variety of clusters, in addition to the Arches and NGC 3603 data points. The cluster properties and literature references are summarized in Table 6. At cluster ages similar to the Arches, the Orionis cluster at an age of 3 Myr displays a total thick disk fraction of % for all stars (including some brown dwarfs), but this fraction drops to % for stars with masses above (Herbig Ae/Be, Hernández et al. 2007). Especially this latter fraction for intermediate-mass stars is strikingly similar to the Arches excess fraction. The central 30 Doradus star-forming region with a mean age range of 2-3 Myr displays an -band excess fraction of % (Maercker & Burton 2005), with indications that even O-type to early B-type stars can retain their dense, inner disks for 2-3 Myr at least. The latter fraction is an upper limit to the disk fraction at 2-3 Myr, however, as the study by Maercker & Burton (2005) covers the extended star-forming region surrounding the central cluster, and objects along the star-forming ridges with ages younger than 1 Myr are included in the -band excess fraction. Despite being an upper limit, the 30 Dor disk fraction is significanly lower than expected from the disk fraction-age relation derived in nearby star-forming regions (Fig. 15). As the -band sample in 30 Dor is also dominated by early-type stars, the effect of the cluster environment and the disk host stars cannot be distinguished in this region.
At younger ages of 1-2 Myr, the massive star-forming regions NGC 3576, M17, and NGC 3603 provide templates at earlier evolutionary stages. In the more dispersed environment of NGC 3576, Maercker et al. (2006) find a cluster disk fraction of % with a strong decrease from % in the immediate cluster core to % at a cluster center distance of 6 pc. It is noteworthy that Figuerêdo et al. (2002) analyze the early B/late O-type star #48 in NGC 3576, and conclude on the basis of CO and H2 emission, along with the absence of stellar features, that the source is most likely a B1V star surrounded by a thick circumstellar disk or envelope, consistent with our interpretation of the Arches excess population. At an even younger age of less than 1 Myr, the young, massive cluster NGC 6618 at the center of the massive HII region M17 has recently been investigated in detail with regard to its population. Hoffmeister et al. (2006) find an -band excess fraction of 41% among a population of 201 M17 sources dominated by B-type stars. In medium-resolution spectroscopy, they find 9 stars with early B-type luminosities with CO emission features, and 7 or 78% of these CO emitters feature -band excesses. Interestingly, two objects also show Br and Pa in absorption. If we identify the M17 CO emission objects with the Arches -excess population, and hence with B-type stars retaining optically thick gaseous disks, both the low fraction of % -band excess sources and the detection of CO emission in all three of our excess sources with spectra is consistent with a more evolved counterpart of the younger M17 population. The denser and more hostile environment of the Arches cluster additionally causes the disk fraction to be substantially depleted as compared to the younger, and less dense, environment of M17.
At an age of 1 Myr, the compact, massive cluster NGC 3603 YC is most similar to the Arches cluster in its core density and total mass (see, e.g., Stolte et al. 2006 for a detailed comparison of the cluster properties). A disk fraction of % was measured in the central 1 pc for stars in the mass range (Stolte et al. 2004), and a lower fraction of 12% -band excess sources was observed among the main sequence OB star population in the radial range from 0.2 to 0.8 pc from seeing-limited observations. Using high-spatial resolution imaging, Harayama et al. (2008) recently resolved the central 0.4 pc of the NGC 3603 YC cluster core, and derived an -band excess fraction of % for the entire population with , and % for main sequence stars with only. The higher excess fraction in the cluster core is most likely a consequence of resolving the fainter excess population in the high-angular resolution -band observations. This disk fraction is substantially lower than the characteristic disk fraction of nearby 1-2 Myr star-forming regions (Fig. 15). In the disk-fraction vs. age diagram, the three densest clusters Arches, NGC 3603, and NGC 6618 (M17) display the lowest disk fractions in their respective age group. This is not an effect of the starburst cluster environment exclusively, as the disk fractions of Herbig Ae/Be stars in IC 348 and Ori are comparably low, suggesting that disk depletion is dominated by the stellar mass of the host star. The low disk fractions observed in all of these massive clusters among early-type stars is consistent with a more rapid depletion of disks around high-mass stars than lower-mass cluster members. There is increasing evidence that young, massive clusters comprised of a large population of OB-type stars have lower disk fractions than clusters dominated by low-mass stars. In Fig. 15, the massive clusters Arches, NGC 3603, 30 Dor, NGC 3576, NGC 6618, as well as Orionis all fall below the linear trend derived by Haisch et al. (2001). It is particularly striking that the four massive clusters where predominantly B-type stars are probed (including the Herbig Ae/Be data point for Ori), appear to follow the same fractional decrease in the disk fraction with age shifted to lower total disk fractions.
We thus conclude that the -band excess of the Arches sources is produced by remnants of massive accretion disks around mid to late B-type stars in a more evolved state than the CO and Br emission disks observed in the younger UCHII regions and star-forming clusters such as the Trapezium, M17, NGC 3576, NGC 2024 with ages Myr.
5 Summary
We report the detection of -band excess sources in the Galactic center Arches cluster. Out of 24 excess sources with mag, all 21 sources with precise proper motion measurements are proper motion members of the cluster. The CO bandhead emission detected in three sources with K-band spectroscopy identifies these sources as optically thick disks. The comparison with disk simulations in similarly young star-forming regions suggests that the CO emission and -band excess arise in the inner few AU from the central star. The -band magnitude range of these sources indicates that the sample consists of Herbig Be stars, possibly with a small contribution of early Herbig Ae stars.
From the complete sample of proper motion members with mag, we derive a disk fraction of % among B-type stars in the central Arches cluster. At the young cluster age of 2.5 Myr, this disk fraction is significantly lower than expected from the disk fraction-age relation found in star-forming regions with lower central density at ages 2-3 Myr. Even when compared to B-star samples in other massive star-forming clusters at similar ages, such as 30 Dor or NGC 2264, the dense Arches and Ori clusters feature the lowest disk fraction measured at this age. The disk fraction in the Arches cluster increases from % in the cluster core ( pc) to % at intermediate radii ( pc) and % outside the cluster center ( pc). The preferential depletion of disks in the cluster core evidences disk destruction by UV radiation, winds, and tidal encounters of massive stars. The comparison with the younger starburst cluster NGC 3603 and more moderate star-forming regions provides a strong observational indication that disks are more rapidly depleted in a starburst environment.
In the case of a very dense cluster such as the Arches the detection of a significant population of circumstellar disks nevertheless comes as a surprise. In the presence of on the order of 125 O-type stars contributing to the intense cluster radiation field, which ionizes the surrounding molecular clouds (Lang et al. 2001), disk destruction must be very efficient. The survival of disks over several Myr in such a dense cluster environment sheds new light on the emergence of debris disks around high-mass stars, and the possibility of forming, and detecting, planetary systems in dense, massive clusters.
Combining the lower total disk fraction observed in dense, massive clusters with the depletion of disks in the core of the Arches cluster as compared to larger radii (Sec. 3.3.2), provides strong indication that clusters with substantial OB star populations have lower disk fractions especially in the immediate environment of high-mass stars. These results suggest that the rate of disk depletion and thus the disk lifetime depend not only on the spectral type of the disk host stars, but also on the total cluster mass and density as an indicator for the ambient UV radiation field and the frequency of dynamical interactions with the massive OB stars specifically in the cluster cores.
Appendix A Galactic center calibration sources
The absolute zeropoint of the Arches core field observations was derived by observing the central (0.4 pc) around Sgr A during the same night as the cluster center. Detailed descriptions of the observing strategy can be found in Ghez et al. (2005), Hornstein et al. (2007), and Lu et al. (2009). Table A.1 lists the non-variable GC sources used as calibrators for the absolute zeropoint in the GC. These sources are identified in Fig. A.1 (see also Lu (2009) for the naming convention). The zeropoint calibration is detailed in Sec. 2.1.3. The foreground extinction to the central parsec, mag, is comparable to the foreground extinction toward the Arches. The advantage of this central reference field is that there are numerous calibration sources with comparably red colors as the Arches cluster stars.
Fig. A.2 shows the zeropoint derived from the combined image of 19 frames taken in the Galactic center observing sequence. The combined image yields a zeropoint of mag, while the individual frames yield a median zeropoint of mag. The zeropoint variations among the Arches individual images is significantly smaller with a standard deviation of only 0.039 mag, indicating that atmospheric conditions had equilibrated when the cluster was observed. Hence, a mean zeropoint between the combined Galactic center image and the individual frames of 23.300 was applied to the combined Arches core image. The zeropoint uncertainty is estimated to be mag due to atmospheric/temperature variations during the observing sequence.
| Name | Radius [“] | RA | DEC | refa | refa | refa | calb | calb | calb |
|---|---|---|---|---|---|---|---|---|---|
| IRS16C | 1.209 | 1.112 | 0.476 | 11.940 | 9.792 | 8.090 | 11.945 | 9.952 | 8.182 |
| IRS16NW | 1.178 | 0.000 | 1.178 | 12.080 | 10.061 | 8.452 | 12.080 | 10.197 | 8.445 |
| IRS33E | 3.121 | 0.673 | -3.047 | 12.260 | 10.948 | 8.545 | 12.136 | 10.269 | 8.492 |
| IRS29S | 2.028 | -1.818 | 0.901 | 13.310 | 11.262 | 9.710 | 13.579 | 11.338 | 9.600 |
| S1-23 | 1.701 | -0.896 | -1.446 | 13.980 | 11.854 | 10.003 | 13.861 | 11.743 | 9.961 |
| S3-2 | 3.036 | 2.981 | 0.575 | 14.060 | 12.027 | 10.480 | 13.874 | 12.111 | 10.528 |
| S2-8 | 2.109 | -1.949 | 0.806 | 13.770 | 12.148 | 11.070 | 13.971 | 12.223 | 10.886 |
| S3-5 | 3.106 | 2.896 | -1.123 | 14.430 | 12.140 | 10.132 | 14.246 | 12.032 | 10.024 |
| S3-10 | 3.471 | 3.299 | -1.080 | 13.610 | 12.327 | 10.650 | 13.699 | 12.116 | 10.725 |
| S3-19 | 3.169 | -1.557 | -2.760 | 13.890 | 12.470 | 10.560 | 13.863 | 12.018 | 10.517 |
| S1-20 | 1.615 | 0.372 | 1.571 | 15.000 | 12.596 | 10.822 | 15.102 | 12.765 | 10.829 |
| S1-22 | 1.686 | -1.608 | -0.508 | 14.650 | 12.693 | 10.947 | 14.657 | 12.646 | 10.868 |
| S4-129 | 4.224 | 3.633 | -2.155 | 12.744 | 10.420 | 14.468 | 12.208 | 10.489 | |
| S1-5 | 0.979 | 0.368 | -0.907 | 14.930 | 12.727 | 10.918 | 14.771 | 12.640 | 10.928 |
| S3-30 | 3.343 | 1.690 | -2.884 | 14.540 | 12.992 | 10.837 | 14.404 | 12.433 | 10.838 |
| S4-6 | 4.186 | 3.245 | -2.644 | 15.580 | 13.370 | 11.165 | 15.050 | 12.852 | 11.225 |
| S3-6 | 3.165 | 3.164 | 0.080 | 14.890 | 12.827 | 11.075 | 14.991 | 12.818 | 11.130 |
| S2-22 | 2.294 | 2.282 | -0.228 | 14.740 | 12.881 | 10.882 | 14.641 | 12.888 | 11.245 |
| S1-34 | 1.273 | 0.848 | -0.949 | 14.770 | 13.013 | 11.773 | 14.515 | 13.069 | 11.503 |
| S1-1 | 0.965 | 0.965 | 0.033 | 14.930 | 13.052 | 11.730 | 14.843 | 13.130 | 11.692 |
| S2-5 | 2.022 | 1.860 | -0.793 | 15.170 | 13.231 | 11.770 | 15.250 | 13.312 | 11.900 |
| S0-13 | 0.686 | 0.537 | -0.427 | 15.430 | 13.408 | 11.765 | 15.375 | 13.407 | 11.861 |
| S1-25 | 1.733 | 1.625 | -0.600 | 15.470 | 13.466 | 11.785 | 15.409 | 13.366 | 11.815 |
| S2-21 | 2.322 | -1.656 | -1.627 | 15.380 | 13.526 | 11.927 | 15.394 | 13.445 | 11.750 |
| S0-14 | 0.807 | -0.756 | -0.282 | 15.520 | 13.656 | 12.360 | 15.662 | 13.763 | 12.292 |
| S0-15 | 0.946 | -0.906 | 0.272 | 15.620 | 13.660 | 12.183 | 15.678 | 13.732 | 12.198 |
| S2-77 | 2.754 | -1.705 | -2.163 | 15.420 | 13.857 | 11.757 | 15.227 | 13.603 | 11.589 |
| S3-29 | 3.332 | 1.442 | -3.004 | 15.480 | 14.079 | 12.225 | 15.571 | 13.628 | 12.228 |
| S2-25 | 2.508 | 0.763 | -2.389 | 15.880 | 14.106 | 12.175 | 15.952 | 13.820 | 12.189 |
| S2-58 | 2.417 | 2.135 | -1.133 | 16.000 | 14.079 | 12.418 | 16.013 | 14.084 | 12.597 |
| S2-2 | 2.060 | -0.569 | 1.980 | 15.460 | 14.090 | 12.860 | 15.828 | 14.052 | 12.868 |
| S1-13 | 1.392 | -1.069 | -0.891 | 16.380 | 14.180 | 12.247 | 16.126 | 14.050 | 12.350 |
| S3-8 | 3.388 | 3.362 | -0.421 | 15.630 | 14.014 | 12.180 | 15.654 | 13.874 | 12.292 |
| S0-9 | 0.554 | 0.143 | -0.535 | 16.150 | 14.348 | 12.837 | 16.002 | 14.173 | 12.652 |
| S3-22 | 3.157 | -0.316 | -3.142 | 13.260 | 11.671 | 9.480 | 13.133 | 11.167 | 9.475 |
| S4-3 | 4.104 | 4.100 | 0.172 | 14.870 | 13.223 | 11.435 | 14.874 | 13.249 | 11.481 |
| S3-178 | 3.410 | -0.395 | -3.387 | 15.220 | 13.467 | 11.385 | 15.098 | 13.067 | 11.356 |
| S4-169 | 4.360 | 4.350 | 0.299 | 15.230 | 13.674 | 12.260 | 15.313 | 13.881 | 12.228 |
| S4-1 | 3.987 | 3.976 | -0.299 | 15.400 | 13.173 | 11.737 | 15.442 | 13.376 | 11.737 |
| S4-161 | 4.338 | 4.333 | -0.207 | 15.840 | 13.897 | 11.907 | 15.893 | 13.926 | 11.997 |
| S3-134 | 3.272 | -1.329 | -2.991 | 16.080 | 13.807 | 12.187 | 16.045 | 13.848 | 12.074 |
| S3-88 | 3.095 | -0.802 | -2.989 | 16.480 | 14.466 | 12.653 | 16.056 | 14.324 | 12.665 |
| S4-4 | 4.216 | 3.560 | -2.260 | 12.793 | 10.410 | 13.937 | 11.965 | 10.323 | |
| S3-13 | 3.843 | 3.729 | 0.927 | 13.578 | 11.847 | 15.855 | 13.566 | 11.940 |
a Columns 5-7 refer to reference magnitudes from earlier NGSAO observations in the central parsec, calibrated against photometry in Clénet et al. (2001, 2004) and Blum et al. (1996). b Columns 8-10 refer to photometry taken on 2006 May 21, and calibrated with respect to the reference magnitudes presented in columns 5-7. A comparison of calibrated and reference magnitudes is shown in Fig. A.2.
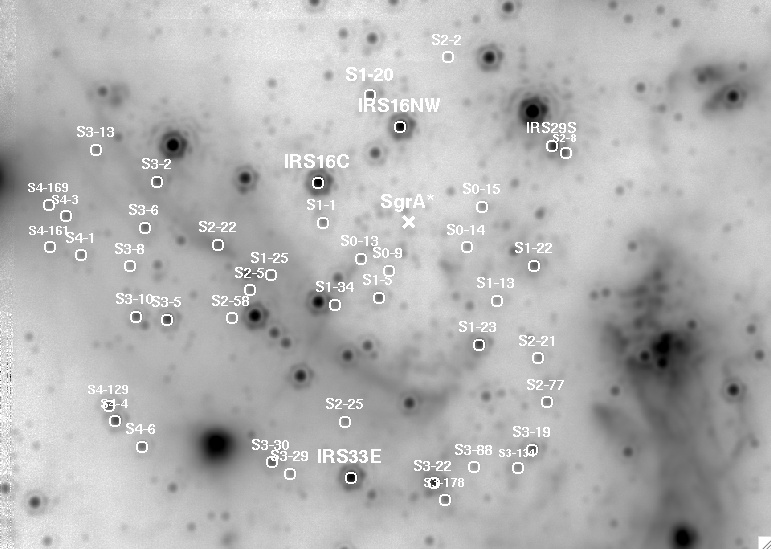
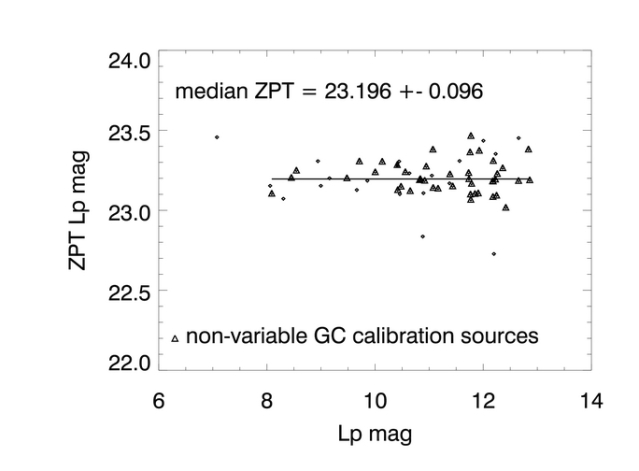
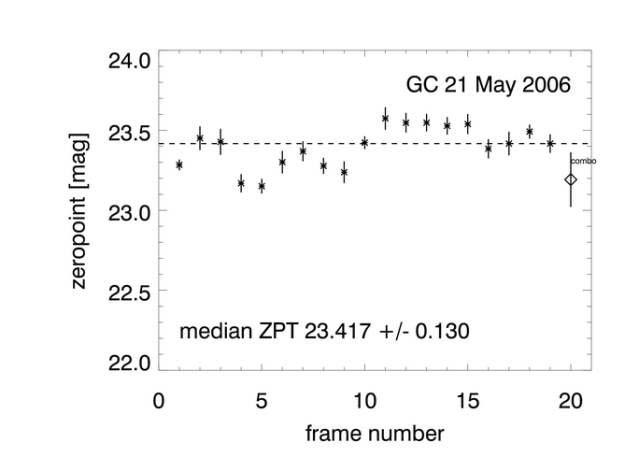
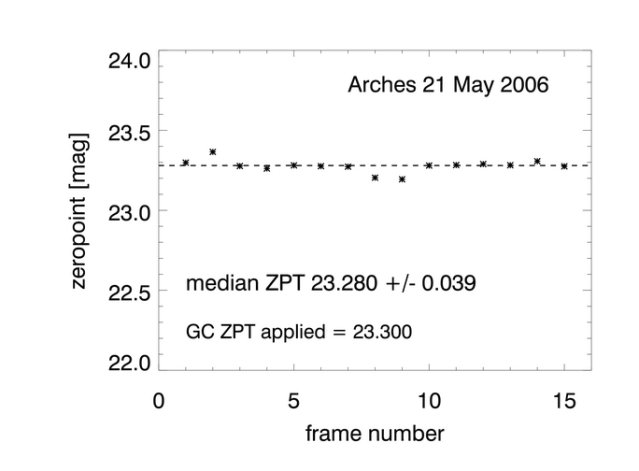
Appendix B Arches zeropoint calibration and -band extinction notes
The Arches -band observations were obtained with the Mauna Kea filter. While the GC high-resolution observations by Clénet et al. (2001) were obtained with the similar VLT filter (, ), earlier GC observations from Blum et al. (1996) used as calibration reference also by Clénet et al. (2001) were observed with the obsolete filter, which has a comparable width but lower central wavelength than (, DePoy & Sharp 1991, see also Simons & Tokunaga (2001) for filter definitions). Earlier extinction laws towards the central galaxy by Rieke & Lebofsky (1985) and Mathis (1990) were determined from the obsolete filter, while newer determinations make use of the Spitzer database, employing the IRAC band. Extrapolation of the standard extinction law reviewed in Mathis (1990) with a slope of yields vs. . The difference for the -band, on the other hand, is with vs. negligible, and the -band central wavelength and bandwidth did not change significantly.
values of the Arches -excess sources span a range from 23 to 28 mag with an average of 25.3 mag (Table 4). These extinctions were derived from the four nearest cluster members to each excess source, and are representative of the cluster population. With the above values for -band extinction, we expect stars with mag to be brighter in by mag with respect to , and sources with mag brighter in by 0.42 mag. The mean offset between the and filters for the median extinction of the GC calibration sources, for mag, is corrected by calibrating the Clénet et al. (2001) measurement with Blum et al. (1996) -band magnitudes. The residual, extinction dependent offset expected for Arches cluster members with mag and mag is therefore mag, which explains the offset of Arches cluster members from the standard extinction law in the two-color diagram, as discussed in Sec. 2.1.3. The range in extinctions in the cluster population mag corresponds to mag, which is within our uncertainties of mag. This offset would appear as a bend in the reddening track in the two-color diagram (see Stead & Hoare 2009 for a discussion on non-straight reddening tracks). This bend is not detectable given the photometric uncertainties discussed in Sec. 2.1.
Note that the -band calibration from GC sources, where the bulk offset between and was corrected, implies that the standard -band extinction law represents the proper extinction value of , which has been used accordingly. The value of extrapolated from the central wavelength of the filter yields a reddening track that is too flat given this -band calibration procedure.
References
- Alonso-Albi et al. (2009) Alonso-Albi, T., Fuente, A., Bachiller, R., et al. 2009, A&A, 497, 117
- Alves (2000) Alves, D. R. 2000, ApJ, 539, 732
- Armitage (2000) Armitage, P. J. 2000, A&A, 362, 968
- Bik & Thi (2004) Bik, A., Thi, W. F. 2004, A&AL, 427, 13
- Bik et al. (2005) Bik, A., Kaper, L., Hanson, M. M., Smits, M. 2005, A&A, 440, 121
- Bik et al. (2006) Bik, A., Kaper, L., Waters, L. B. F. M. 2006, A&A, 455, 561
- Blum et al. (1996) Blum, R. D., Sellgren, K., Depoy, D. L. 1996, ApJ, 470, 864
- Blum et al. (2004) Blum, R. D., Barbosa, C. L., Damineli, A., et al. 2004, ApJ, 617, 1167
- Boffin et al. (1998) Boffin, H. M. J., Watkins, S. J., Bhattal, A. S., et al. 1998, MNRAS, 300, 1189
- Brandl et al. (1998) Brandl, B., Sams, B. J., Bertoldi, F., et al. 1996, ApJ, 466, 254
- Carpenter (2001) Carpenter, J. M. 2001, AJ, 121, 2851
- Carr et al. (1993) Carr, John S., Tokunaga, Alan T., Najita, J. 1993, ApJL, 411, 37
- Cesaroni et al. (2007) Cesaroni, R., Galli, D., Lodato, G., et al. 2007, Conf. Proc., Protostars & Planets V, (Reipurth, Jewitt, Keil (eds.)), University of Arizona Press, 197
- Chandler et al. (1995) Chandler, C. J., Carlstrom, J. E., Scoville, N. Z. 1995, ApJ, 446, 793
- Clénet et al. (2004) Clénet, Y., Rouan, D., Gendron, E., et al. 2004, A&AL, 417, 15
- Clarke (2007) Clarke, C. J. 2007, MNRAS, 376, 1350
- Cotera et al. (1996) Cotera, A. S., Erickson, E. F., Colgan, S. W. J., et al. 1996, ApJ, 461, 750
- Crowther (2007) Crowther, P. A. 2007, ARA&A, 45, 177
- Dahm & Simon (2005) Dahm, S. E., Simon, T. 2005, AJ, 129, 829
- Dahm (2005) Dahm, S. E. 2005, AJ, 130, 1805
- Dahm & Hillenbrand (2007) Dahm, S. E., Hillenbrand, L. A. 2007, AJ, 133, 2027
- DePoy & Sharp (1991) DePoy, D. A., Sharp, N. L. 1991, AJ, 101, 1324
- Diolaiti et al. (2000) Diolaiti, E., Bendinelli, O., Bonaccini, D., et al. 2000, A&AS, 147, 335
- Espinoza et al. (2009) Espinoza, P., Selman, F. J., Melnick, J. 2009, A&A, accepted, astro-ph/0903.2222
- Fatuzzo & Adams (2008) Fatuzzo, M., Adams, F. C. 2008, ApJ, 675, 1361
- Figer et al. (1999) Figer, D. F., Kim, S. S., Morris, M., et al. 1999, ApJ, 525, 750
- Figer et al. (2002) Figer, D. F., Najarro, F., Gilmore, D., et al. 2002, ApJ, 581, 258
- Figueredo et al. (2002) Figuerêdo, E., Blum, R. D., Daminelli, A., Conti, P. S. 2002, AJ, 124, 2739
- Figueredo et al. (2005) Figuerêdo, E., Blum, R. D., Damineli, A., Conti, P. S. 2005, AJ, 129, 1523
- (30) Fruchter, A. S., Hook, R. N. 2002, PASP, 114, 144
- Ghez et al. (2005) Ghez, A. M., et al. 2005, ApJ, 635, 1087
- Ghez et al. (2008) Ghez, A. M. G., Salim, S., Weinberg, N. N., et al. 2008, ApJ, 689, 1044
- Grave & Kumar (2009) Grave, J. M. C., Kumar, M. S. N. 2009, A&A, 498, 147
- Haisch et al. (2000) Haisch, K. E., Jr.; Lada, E. A.; Lada, C. J. 2000, AJ, 120, 1396
- Haisch et al. (2001) Haisch, K. E., Jr., Lada, E. A., Lada, C. J. 2001, ApJL, 553, 153
- Hanson et al. (1996) Hanson, M. M, Conti, P. S., Rieke, M. J. 1996, ApJS, 107, 281
- Hanson et al. (1997) Hanson, M. M., Howarth, I. D., Conti, P. S. 1997, ApJ, 489, 698
- Harayama et al. (2008) Harayama, Y., Eisenhauer, F., Martins, F. 2008, ApJ, 675, 1319
- Hawarden et al. (2001) Hawarden, T. G., Leggett, S. K., Letawsky, M. B., et al. 2001, MNRAS, 325, 563
- Hernández et al. (2005) Hernández, J., Calvet, N., Hartmann, L, et al. 2005, AJ, 129, 856
- Hernández et al. (2007) Hernández, J., Hartmann, L, Megeath, T., et al. 2007, ApJ, 662, 1067
- Hillenbrand et al. (1992) Hillenbrand, L. A., Strom, S. E., Vrba, F. J., Keene, J. 1992, ApJ, 397, 613
- Hillenbrand (1997) Hillenbrand, L.A. 1997, AJ, 113, 1733
- Hoffmeister et al. (2006) Hoffmeister, V. H., Chini, R., Scheyda, C. M., et al. 2006, A&AL, 457, 29
- Hollenbach et al. (2000) Hollenbach, D. J., Yorke, H. W., Johnstone, D. 2000, Conf. Proc, Protostars and Planets IV (Mannings, boss, Russell (eds.)), Tucson: University of Arizona Press, 401
- Hornstein et al. (2007) Hornstein, S. D., Matthews, K., Ghez, A. M., et al. 2007, ApJ, 667, 900
- Kim et al. (2006) Kim, S. S., Figer, D. F., Kudritzki, R. P., Najarro, F. ApJL, 653, 113
- Kraus et al. (2000) Kraus, M., Krügel, E., Thum, C., Geballe, T. R. 2000, A&A, 36, 158
- Lada & Lada (1995) Lada, E.A., Lada, C.J. 1995, AJ, 109, 1682
- Lada et al. (2000) Lada, C. J., Muench, A. A., Haisch, K. E., Jr., et al. 2000, AJ, 120, 3162
- Lada et al. (2006) Lada, C. J., Muench, A. A., Luhman, K. L., et al. 2006, AJ, 131, 1574
- Lang et al. (2001) Lang, Cornelia C., Goss, W. M., Morris, M. 2001, AJ, 121, 2681
- Lejeune & Schaerer (2001) Lejeune, T., Schaerer, D. 2001, A&A, 366, 538
- Lu (2009) Lu, J. R., Orbits and Origins of Young Stars at the Galactic Center, 2008, Ph. D. Thesis, UCLA
- Lu et al. (2009) Lu, J. R., Ghez, A. M., Hornstein, S. D., et al. 2009, ApJ, 619, 1463
- Maercker & Burton (2005) Maercker, M., Burton, M. G. 2005, A&A, 438, 663
- Maercker et al. (2006) Maercker, M., Burton, M. G., Wright, C. M. 2006, A&A, 450, 253
- Martins et al. (2008) Martins, F., Hillier, D. J., Paumard, T., et al. 2008, A&A, 478, 219
- Mathis (1990) Mathis, J. S. 1990, ARA&A, 28, 37
- Meyer et al. (1997) Meyer, M. R., Calvet, N., Hillenbrand, L. A. 1997, AJ, 114, 288
- Najarro et al. (2004) Najarro, F., Figer, D. F., Hillier, D. J., Kudritzki, R. P. 2004, ApJL, 611, 105
- Natta et al. (2001) Natta, A., Prusti, T., Neri, R., et al. 2001, A&A, 371, 186
- Olczak et al. (2008) Olczak, C., Pfalzner, S., Eckart, A. 2008, A&A, 488, 191
- Pflazner et al. (2006) Pfalzner, S., Olczak, C., Eckart, A. 2006, A&A, 454, 811
- Richling & Yorke (1997) Richling, S., Yorke, H. W. 1997, A&A, 327, 317
- Richling & Yorke (2000) Richling, S., Yorke, H. W. 2000, ApJ, 539, 258
- Rieke & Lebofsky (1985) Rieke, G. H., Lebofsky, M. J. 1985, 288, 618
- Scally & Clarke (2001) Scally, A., Clarke, C. 2001, MNRAS, 325, 449
- Sherry et al. (2004) Sherry, W. H., Walter, F. M., Wolk, S. J. 2004, AJ, 128, 2316
- Simons & Tokunaga (2002) Simons, D. A., Tokunaga, A. 2002, PASP, 114, 169
- Stead & Hoare (2009) Stead, J. J., Hoare, M. G. 2009, MNRAS, 400, 731
- Stolte et al. (2002) Stolte, A., Grebel, E. K., Brandner, W., Figer, D. F. 2002, A&A, 394, 459
- Stolte et al. (2004) Stolte, A., Brandner, W., Brandl, B., et al. 2004, AJ, 128, 765
- Stolte et al. (2005) Stolte, A., Brandner, W., Grebel, E. K., Lenzen, R., Lagrange, A.-M. 2005, ApJL, 628, 113
- Stolte et al. (2006) Stolte, A., Brandner, W., Brandl, B., Zinnecker, H. 2006, AJ, 132, 253
- Stolte et al. (2008) Stolte, A., Ghez, A. M. G., Morris, M., et al. 2008, ApJ, 675, 1278
- Takeuchi et al. (2005) Takeuchi, T., Clarke, C. J., Lin, D. N. C. 2005, ApJ, 627, 286
- Thompson et al. (2001) Thompson, D., Egami, E., Sawicki, M. 2001, NIRC2 pre-ship review, available at: http://www2.keck.hawaii.edu/inst/nirc2/preship_testing.pdf
- van Dam et al. (2006) van Dam, M. A., Le Mignant, D., Bouchez, A. H., et al. 2006, PASP, 118, 310
- Wizinowich et al. (2006) Wizinowich, P. L., Le Mignant, D., Bouchez, A. H., et al. 2006, PASP, 118, 297
- Zinnecker & Yorke (2007) Zinnecker, H., Yorke, H. W. 2007, ARA&A, 45, 481
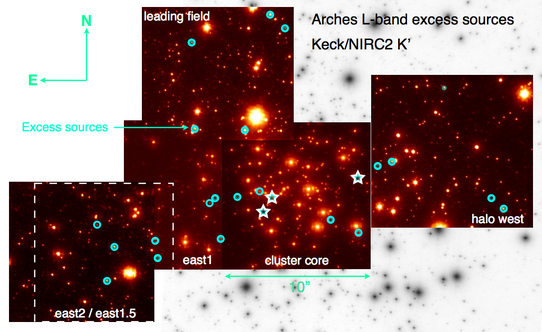
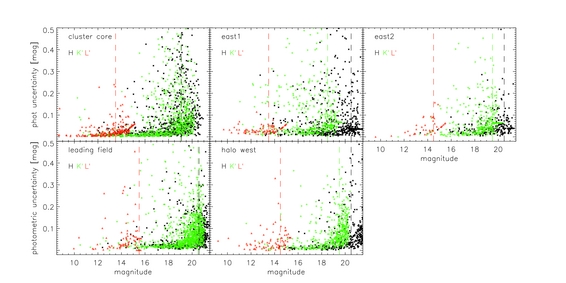
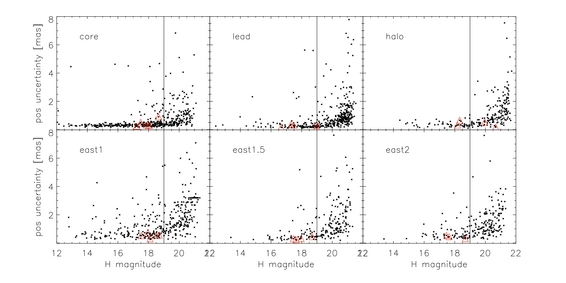
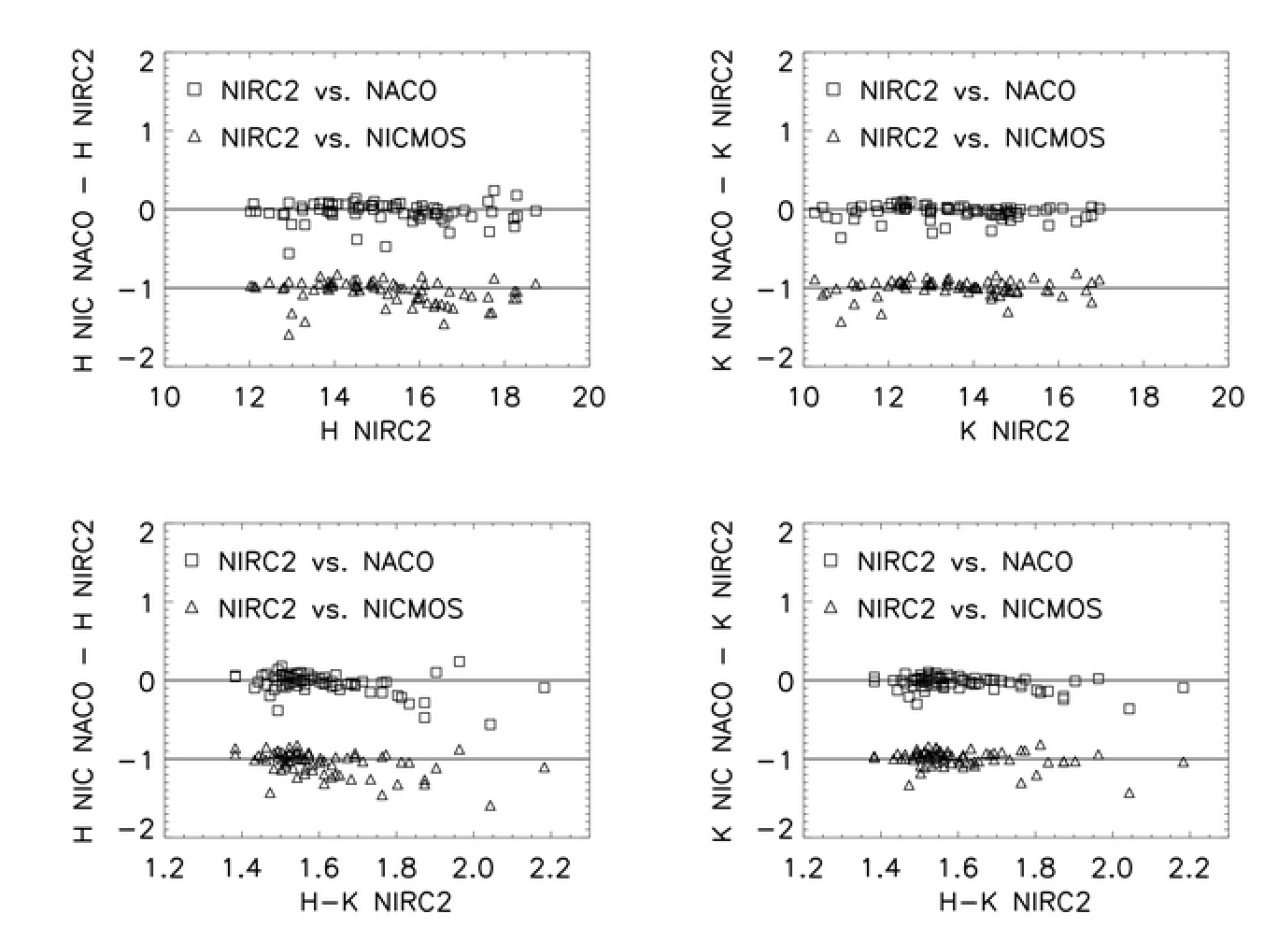
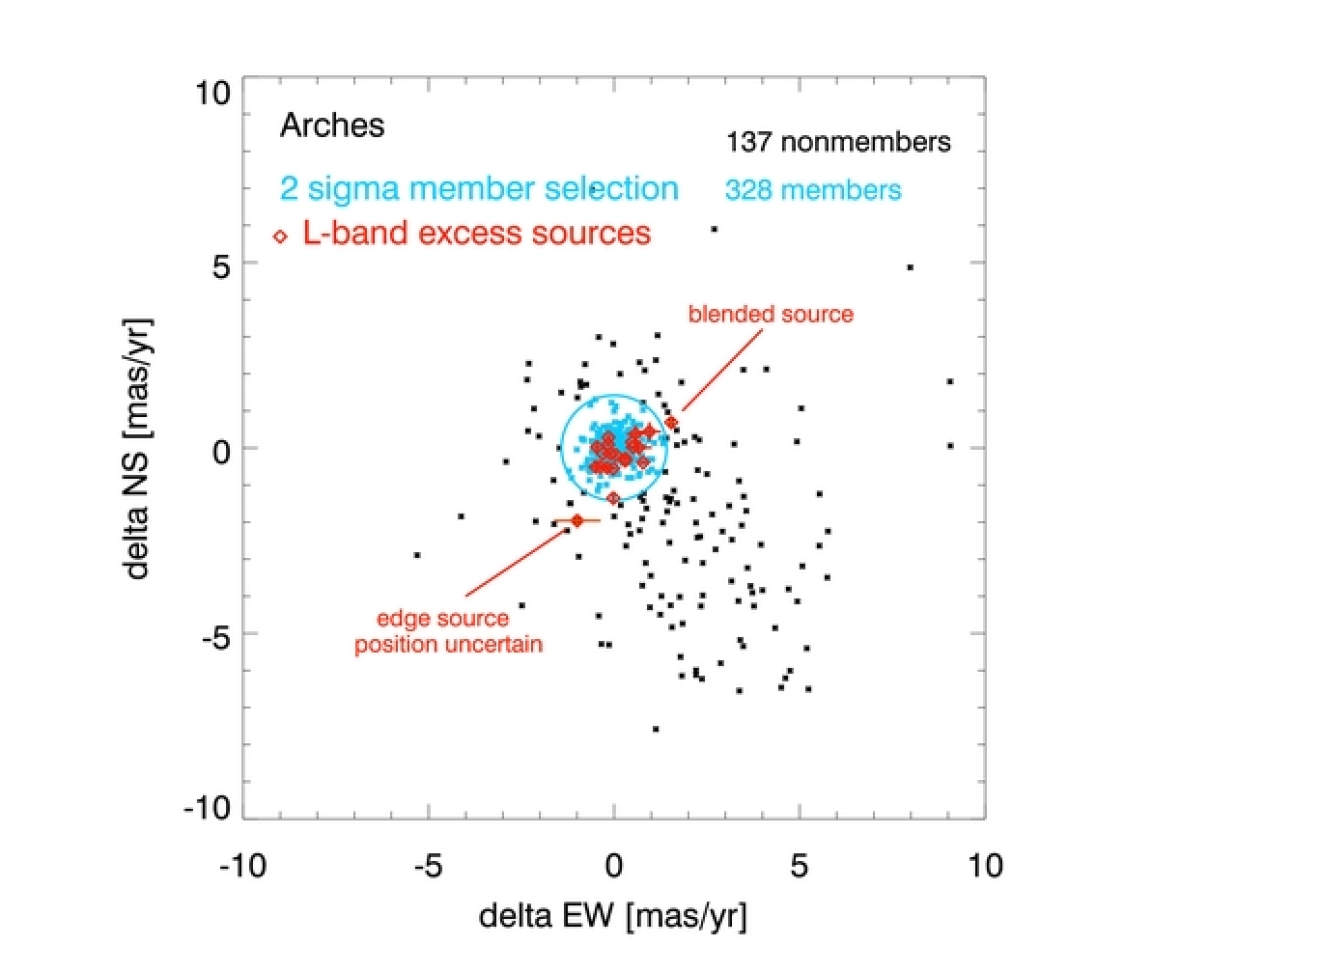
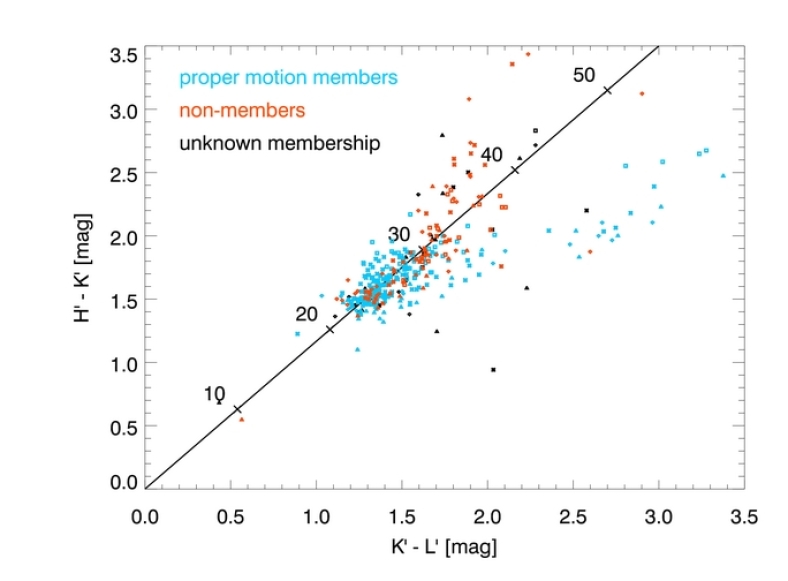
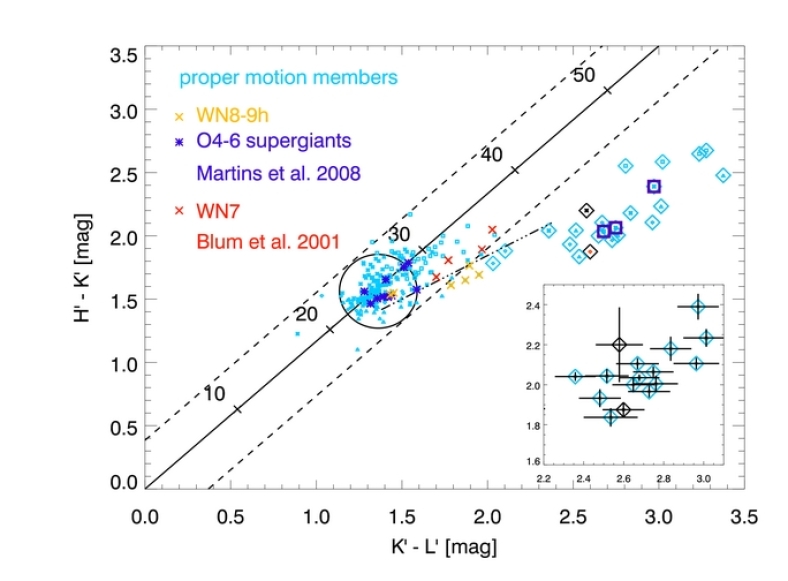
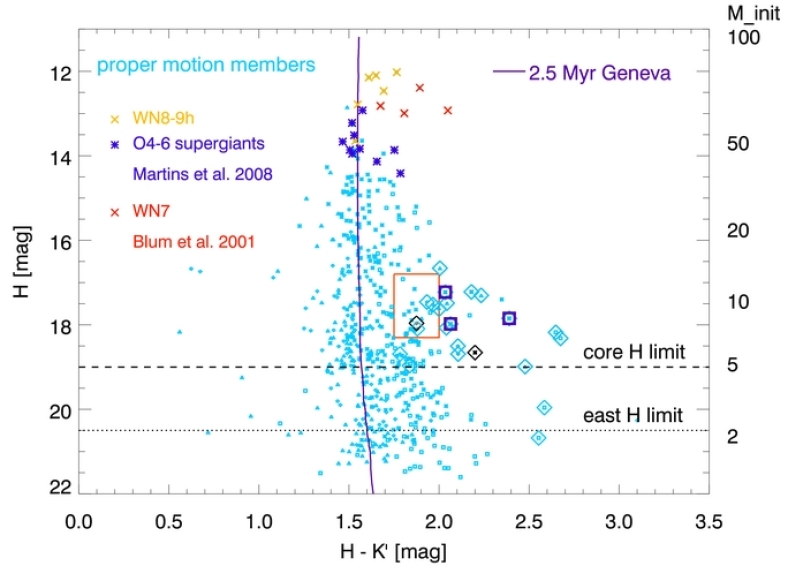
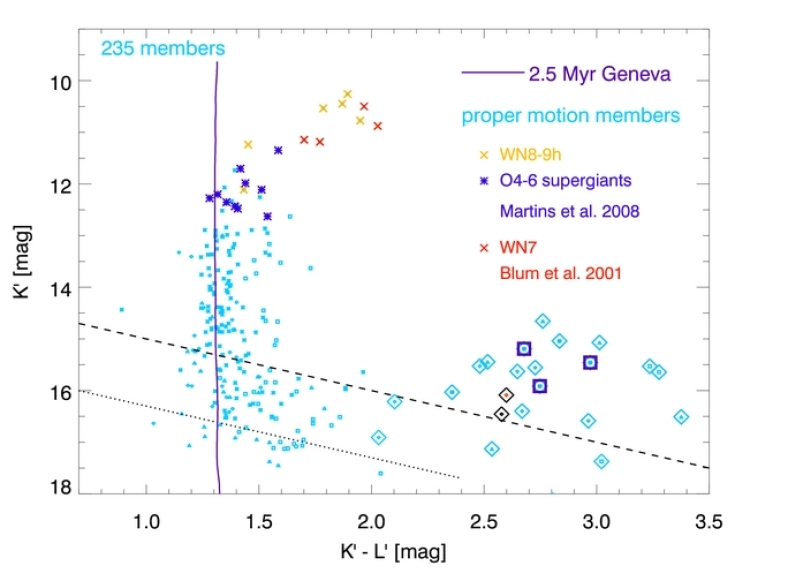
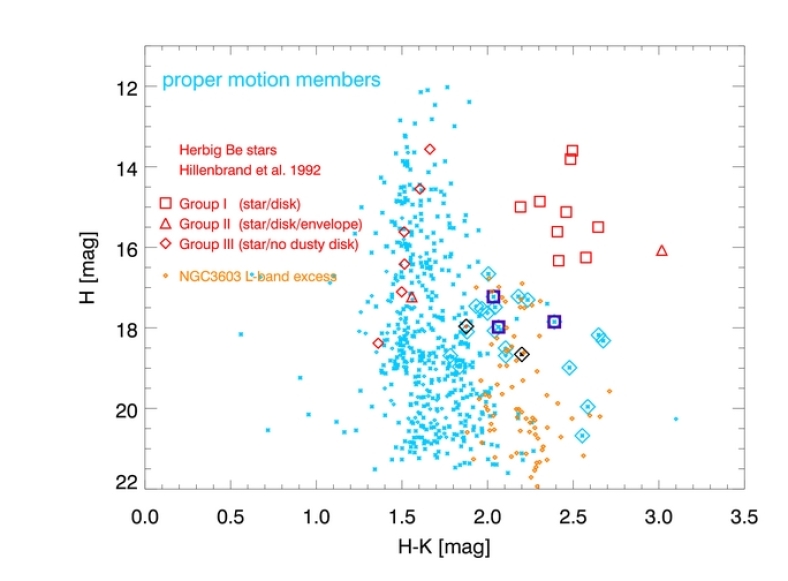
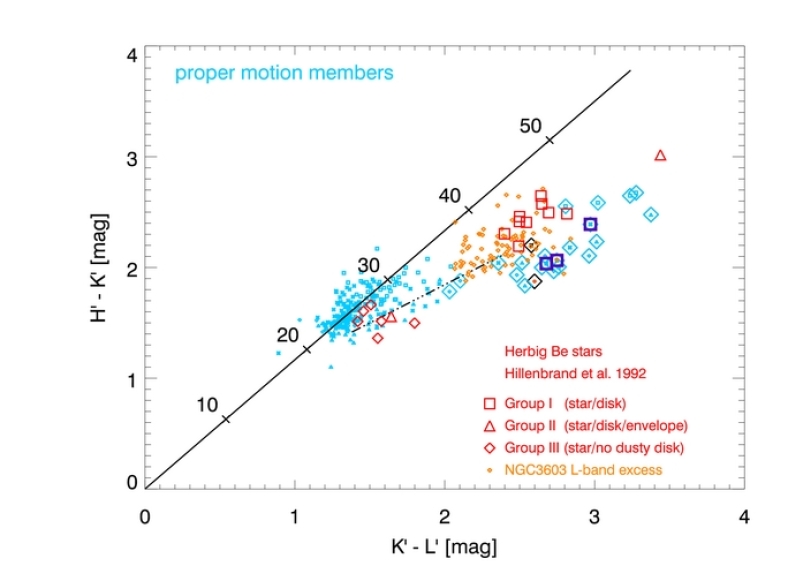
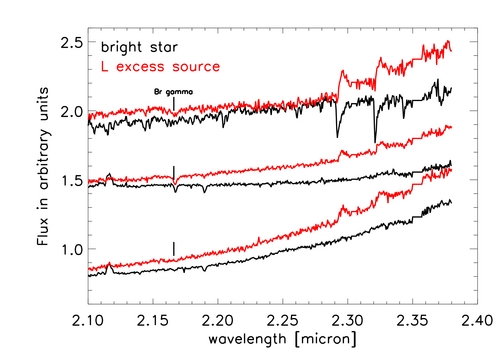
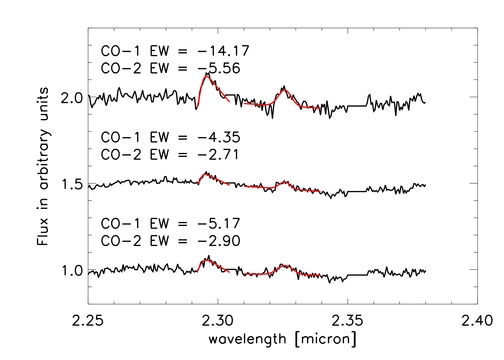
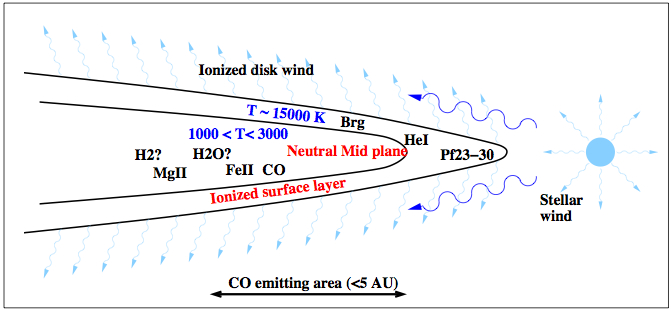
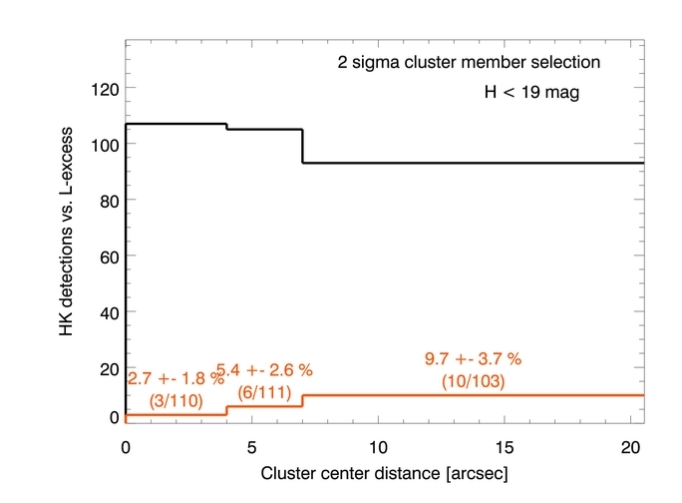
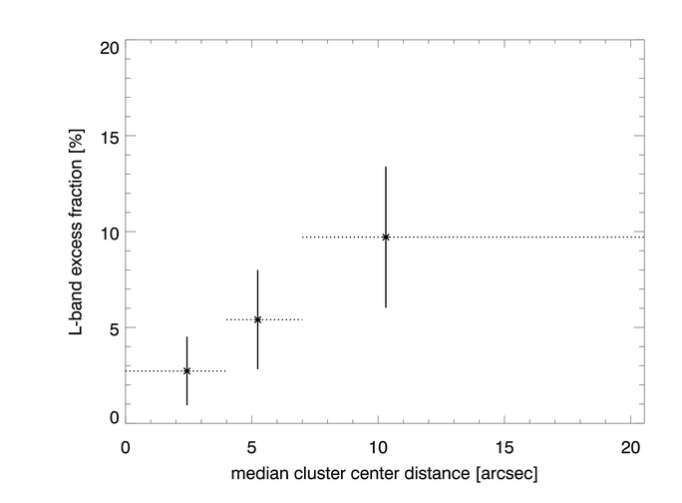
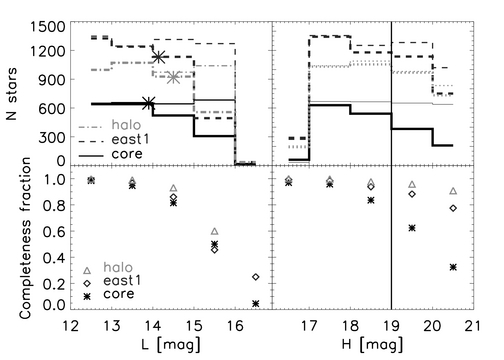
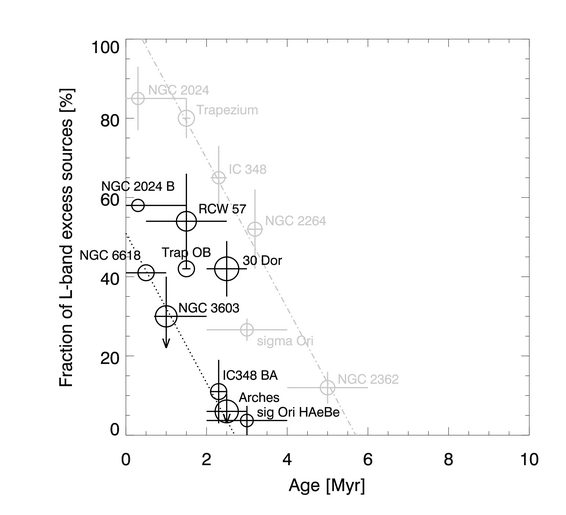
| Field | RA | DEC | RA1 | DEC1 | tip-tilt star2 | distance to TTS |
| core | 17:45:50.540 | -28:49:20.07 | 1.681 | -2.190 | 425 | 10.369 |
| east1 | 17:45:51.060 | -28:49:20.07 | 8.620 | -2.190 | 425 | 17.200 |
| east1.53 | 17:45:51.600 | -28:49:24.40 | 15.826 | 2.140 | 401 | 18.149 |
| east2 | 17:45:51.740 | -28:49:24.28 | 17.694 | 2.020 | 401 | 16.352 |
| lead | 17:45:50.960 | -28:49:11.72 | 7.286 | -10.540 | 425 | 18.998 |
| halo | 17:45:49.720 | -28:49:16.87 | -9.261 | -5.390 | 425 | 5.603 |
1 Positional offsets in right ascension and declination are given in arcseconds, relative to the brigthest source in the cluster core (see Fig. 3), RA 17:45:50.42, DEC -28:49:22.3. The cluster center is located at RA 17:45:50.54, DEC -28:49:19.8. 2 Tip-tilt star identification numbers are given as extension from GSC2.2:S222122222, located at 425: RA = 17:45:49:78, 17:45:22.3, 401: 17:45:52.93, -28:49:28.13. 3 The intermittent field east1.5 mostly overlaps with field east2, as well as a small section of field east1, to provide proper motion membership in the area not covered by the NACO field.
| Keck/NIRC2 imaging | |||||||||||
| Date | Field | Filter | [s] | coadds | [s] | FWHM [mas] | Strehl1 | PSF size3 [pix] | LF peak2 | ||
| 2006 May 21 | core | H | 10 | 6 | 15 | 15 | 900 | 63.2 | 0.17 | 100 | 19.0 |
| core | L’ | 0.5 | 60 | 15 | 15 | 450 | 79.4 | 0.64 | 47 | 14.0 | |
| east1 | L’ | 0.5 | 60 | 16 | 16 | 480 | 81.3 | 0.58 | 40 | 13.5 | |
| GC5 | L’ | 0.5 | 60 | 19 | 19 | 570 | 81.4 | 0.38 | 100 | 12.0 | |
| 2006 July 18 | core | K’ | 3 | 10 | 52 | 36 | 1080 | 56.0 | 0.22 | 100 | 19.5 |
| east1 | H | 10 | 6 | 16 | 14 | 840 | 67.4 | 0.10 | 80 | 20.5 | |
| east1 | K’ | 3 | 10 | 15 | 10 | 300 | 65.0 | 0.15 | 90 | 18.5 | |
| east2 | H | 20 | 3 | 15 | 13 | 780 | 71.3 | 0.08 | 70 | 20.5 | |
| east2 | K’ | 3 | 10 | 15 | 15 | 450 | 59.3 | 0.22 | 75 | 19.5 | |
| east2 | L’ | 0.5 | 60 | 17 | 17 | 510 | 79.2 | 0.69 | 40 | 14.5 | |
| 2007 June 21 | leading | K’ | 3 | 10 | 42 | 40 | 1200 | 56.0 | 0.38 | 80 | 20.5 |
| halo west | K’ | 3 | 10 | 28 | 26 | 780 | 53.7 | 0.38 | 80 | 19.5 | |
| 2008 July 1 | leading | H | 10 | 3 | 29 | 29 | 870 | 58.7 | 0.20 | 100 | 20.5 |
| leading | L’ | 0.5 | 60 | 53 | 53 | 1590 | 80.8 | 0.55 | 80 | 15.5 | |
| halo west | H | 10 | 3 | 23 | 23 | 690 | 50.5 | 0.23 | 100 | 20.5 | |
| halo west | L’ | 0.5 | 60 | 39 | 39 | 1170 | 78.8 | 0.76 | 80 | 14.5 | |
| east1.5 | K’ | 3 | 10 | 22 | 21 | 630 | 68.0 | 0.29 | 100 | 19.5 | |
| VLT/SINFONI integral-field spectroscopy | |||||||||||
| 2006 May-July | core | HK | 300 | 24 | - | 7200 | - | 135 | - | - | - |
1 FWHM and Strehl values are estimated from the averaged PSF image derived for each frame. 2 The peak of the luminosity function indicates the completeness in each filter on each field. 3 The PSF size is the diameter of the PSF extracted with starfinder and used to perform PSF fitting across each field (see Sec. 2.1). 4 Frames for the combined image were selected on the basis of the FWHM and the AO performance. For observing sequences with less than 20 frames, all frames with AO correction are included in the final image, while for sequences with more than 20 frames selection based on the FWHM in each image was possible (see Sec. 2 for details). 5 GC refers to the Galactic center data set used for calibration.
| field | calibration field | ||||||
|---|---|---|---|---|---|---|---|
| [mag] | [mag] | [mag] | |||||
| core2 | 0.010 | 56 | 0.009 | 64 | 0.100 | - | NACO/NIRC2 core |
| Galactic center zeropoint | |||||||
| east1 | 0.012 | 100 | 0.012 | 72 | 0.100 | 31 | core |
| east1.5 | - | - | 0.022 | 22 | - | core | |
| east2 | 0.024 | 17 | 0.023 | 103 | 0.101 | 6 | core, east1.5 |
| lead | 0.019 | 29 | 0.017 | 29 | 0.107 | 7 | core |
| halo | 0.010 | 107 | 0.006 | 228 | 0.101 | 30 | NACO, core |
1 Number of calibration sources available. In the core data, the Galactic center zeropoint was applied (see Appendix B). 2 The core zeropoint was derived from the NACO central region, pixels (NIRC2) to minimise anisoplanatic and -kinetic effects. The core zeropoint was derived from the Galactic center standard field, all adjacent fields were calibrated with respect to the core field. The standard deviation in photometric residuals after calibration is given as the zeropoint uncertainties. The uncertainty is the zeropoint variation during the GC observing sequence in the core field, and the variation between calibration sources is taken into account for the surrounding fields.
| ID | RA | DEC1 | Spectra | |||||||
|---|---|---|---|---|---|---|---|---|---|---|
| [”] | [”] | [mag] | [mag] | [mag] | [mag] | [mag] | [mag] | [mag] | ||
| 1 | 5.852 | 2.239 | 17.220 | 0.059 | 15.040 | 0.011 | 12.205 | 0.103 | ||
| 2 | 3.328 | 2.113 | 17.227 | 0.014 | 15.192 | 0.009 | 12.514 | 0.100 | Sp | |
| 3 | -2.948 | 3.563 | 17.848 | 0.064 | 15.458 | 0.010 | 12.486 | 0.103 | Sp | |
| 4 | 3.947 | 1.106 | 17.979 | 0.025 | 15.915 | 0.010 | 13.167 | 0.100 | Sp | |
| 5 | -0.963 | 0.526 | 18.071 | 0.019 | 16.030 | 0.011 | 13.672 | 0.101 | ||
| 6 | -2.993 | -0.440 | 18.656 | 0.178 | 16.456 | 0.058 | 13.878 | 0.103 | ||
| 7 | 7.064 | -0.835 | 17.521 | 0.022 | 15.555 | 0.018 | 12.828 | 0.104 | ||
| 8 | 11.637 | -2.263 | 17.962 | 0.022 | 16.087 | 0.020 | 13.488 | 0.103 | ||
| 9 | 7.470 | 2.160 | 18.502 | 0.014 | 16.397 | 0.024 | 13.728 | 0.104 | ||
| 10 | 7.850 | 1.769 | 18.095 | 0.020 | 16.215 | 0.016 | 14.112 | 0.102 | ||
| 11 | 11.772 | -0.970 | 18.691 | 0.023 | 16.585 | 0.017 | 13.622 | 0.113 | ||
| 12 | 14.877 | -1.496 | 17.459 | 0.038 | 15.526 | 0.023 | 13.045 | 0.102 | ||
| 13 | 15.480 | -4.183 | 17.630 | 0.026 | 15.630 | 0.023 | 12.982 | 0.102 | ||
| 14 | 5.329 | 7.119 | 16.659 | 0.032 | 14.654 | 0.024 | 11.893 | 0.107 | ||
| 15 | 3.512 | 15.159 | 17.303 | 0.031 | 15.069 | 0.032 | 12.056 | 0.110 | ||
| 16 | 8.788 | 7.212 | 17.487 | 0.029 | 15.443 | 0.017 | 12.927 | 0.107 | ||
| 17 | 9.011 | 13.247 | 18.987 | 0.020 | 16.509 | 0.026 | 13.133 | 0.108 | ||
| 18 | 2.435 | 14.149 | 18.965 | 0.035 | 17.128 | 0.029 | 14.593 | 0.132 | ||
| 19 | -12.619 | 1.492 | 18.177 | 0.026 | 15.529 | 0.013 | 12.293 | 0.101 | ||
| 20 | -5.101 | 4.691 | 18.318 | 0.013 | 15.643 | 0.020 | 12.366 | 0.103 | ||
| 21 | -4.151 | 4.383 | 19.958 | 0.018 | 17.373 | 0.044 | 14.351 | 0.102 | ||
| 22 | -11.824 | 2.234 | 20.676 | 0.021 | 18.123 | 0.009 | 15.317 | 0.116 | ||
| 23 | 16.215 | 0.249 | 18.690 | 0.025 | 16.907 | 0.025 | 14.875 | 0.111 | ||
| 24 | 4.240 | 2.615 | 17.366 | 0.051 | 15.607 | 0.012 | 13.527 | 0.104 |
1 Positional offsets in right ascension and declination are given in arcseconds, relative to
the brigthest source in the cluster core (see Fig. 3), RA 17:45:50.42, DEC -28:49:22.3.
The cluster center is located at RA 17:45:50.54, DEC -28:49:19.8.
2 The visual extinction is estimated as an average of the extinction of the 4 nearest
main sequence ( mag)
cluster members using a Rieke & Lebofsky 1985 extinction law.
| ID | RA | DEC1 | SpT | Ref.2 | ||||||
|---|---|---|---|---|---|---|---|---|---|---|
| [”] | [”] | [mag] | [mag] | [mag] | [mag] | [mag] | [mag] | |||
| 1 | 0.000 | 0.000 | 12.023 | 0.030 | 10.258 | 0.179 | 8.364 | 0.100 | WN8-9h | 1 |
| 2 | 1.936 | 4.725 | 12.097 | 0.044 | 10.447 | 0.090 | 8.577 | 0.101 | WN8-9h | 1 |
| 3 | 0.664 | 2.764 | 12.145 | 0.021 | 10.535 | 0.079 | 8.749 | 0.100 | WN8-9h | 1 |
| 4 | -0.419 | 1.048 | 12.465 | 0.013 | 10.772 | 0.021 | 8.822 | 0.100 | WN8-9h | 1 |
| 5 | 3.381 | -0.302 | 12.819 | 0.014 | 11.144 | 0.011 | 9.443 | 0.100 | WN7/OIf* | 2,3 |
| 6 | 1.348 | 1.620 | 12.925 | 0.013 | 11.349 | 0.014 | 9.763 | 0.100 | O4-6If* | 1 |
| 7 | -1.893 | 5.057 | 12.992 | 0.025 | 11.185 | 0.025 | 9.414 | 0.100 | WN7 | 2 |
| 8 | 4.522 | 8.055 | 12.390 | 0.023 | 10.497 | 0.030 | 8.530 | 0.108 | - | - |
1 Positional offsets in right ascension and declination are given in arcseconds, relative to the brigthest source in the cluster core (see Fig. 3), RA 17:45:50.42, DEC -28:49:22.3. The cluster center is located at RA 17:45:50.54, DEC -28:49:19.8. 2 References for spectral types: 1 - Martins et al. 2008; 2 - Blum et al. 2001; 3 - Figer et al. 2002
| Name | location | dist | age | disk fraction | mass range | Ref | ||||
| kpc | Myr | pc | all | OB(A) stars | ||||||
| Starburst clusters | ||||||||||
| Arches | GC | 8000 | - | 1,2,3,4 | ||||||
| Quintuplet | GC | 8 | - | - | - | - | - | 5 | ||
| NGC 3603 YC | SP | 6-7 | 1 | 0.2 | 6,7 | |||||
| Westerlund 1 | SP | 52000 | - | - | - | 8 | ||||
| R 136/30 Dor | LMC | 50 | 2-3 | 0.24 | - | 9,10 | ||||
| Young clusters | ||||||||||
| ONC/Trap | SP | 0.43 | 0.3-1 | 0.2 | 80 | 42 | 11,12 | |||
| NGC 2024 | SP | 0.46 | 0.3-1 | 200 | - | 58 | 12 | |||
| Ori | SP | 0.5 | 2.5-3 | 225 | 1.6 | 4 | 13, 14 | |||
| NGC 3576/RCW 57 | SP | 2.8 | - | - | 15, 16 | |||||
| M 17/NGC 6618 | SP | 2.1 | 0.3-1 | - | 62 | 41 | 17 | |||
| NGC 2264 | SP | 0.8 | 3.2 | - | - | - | 12, 18 | |||
| IC 348 | SP | 0.3 | 2-3 | 208 | 0.1 | 19, 20 | ||||
| NGC 2362 | SP | 1.5 | 5 | 500 | - | - | 0.0 | 21, 22 | ||
1 - Espinoza et al. 2009; 2 - Stolte et al. 2005; 3 - Najarro et al. 2004; 4 - Figer et al. 1999a; 5 - Figer et al. 1999b; 6 - Harayama et al. 2008; 7 - Stolte et al. 2004; 8 - Brandner et al. 2008; 9 - Brandl et al. 1996; 10 - Maercker & Burton 2005; 11 - Hillenbrand & Hartmann (1998); 12 - Haisch et al. (2000,2001); 13 - Hernández et al. 2007; 14 - Sherry et al. 2004; 15 - Figuerêdo et al. 2002; 16 - Maercker et al. 2006; 17 - Hoffmeister et al. 2006; 18 - Dahm & Simon 2005; 19 - Lada et al. 2006; 20 - Lada & Lada 1995; 21 - Dahm 2005; 22 - Dahm & Hillenbrand 2007
| ID | field | RA | DEC | baseline | member | excess | ||||||||||
|---|---|---|---|---|---|---|---|---|---|---|---|---|---|---|---|---|
| [ ” ] | [ ” ] | [ ” ] | [ ” ] | mag | mag | mag | mag | mag | mag | years | mas/yr | mas/yr | ||||
| 1 | core | 0.000 | 0.000 | 0.0010 | 0.0001 | 12.023 | 0.030 | 10.258 | 0.179 | 8.364 | 0.100 | 4.33 | -0.551 | 0.046 | 1 | 0 |
| 2 | core | 1.936 | 4.725 | 0.0013 | 0.0013 | 12.097 | 0.044 | 10.447 | 0.090 | 8.577 | 0.101 | 4.33 | -0.597 | -0.115 | 1 | 0 |
| 3 | core | 0.664 | 2.764 | 0.0004 | 0.0004 | 12.145 | 0.021 | 10.535 | 0.079 | 8.749 | 0.100 | 4.33 | -0.069 | 0.023 | 1 | 0 |
| 4 | core | -0.419 | 1.048 | 0.0003 | 0.0002 | 12.465 | 0.013 | 10.772 | 0.021 | 8.822 | 0.100 | 4.33 | 0.000 | 0.345 | 1 | 0 |
| 5 | core | 3.381 | -0.302 | 0.0003 | 0.0001 | 12.819 | 0.014 | 11.144 | 0.011 | 9.443 | 0.100 | 4.33 | -0.092 | -0.184 | 1 | 0 |
| 6 | core | 1.348 | 1.620 | 0.0005 | 0.0002 | 12.925 | 0.013 | 11.349 | 0.014 | 9.763 | 0.100 | 4.33 | -0.368 | -0.161 | 1 | 0 |
| 7 | core | -1.893 | 5.057 | 0.0003 | 0.0003 | 12.992 | 0.025 | 11.185 | 0.025 | 9.414 | 0.100 | 4.33 | 0.092 | 0.368 | 1 | 0 |
Note. — The full table is available in the online version of the journal.