Near-infrared thermal emission from TrES-3b: a Ks-band detection and an H-band upper limit on the depth of the Secondary Eclipse**affiliation: Based on observations obtained with WIRCam, a joint project of CFHT, Taiwan, Korea, Canada, France, at the Canada-France-Hawaii Telescope (CFHT) which is operated by the National Research Council (NRC) of Canada, the Institute National des Sciences de l’Univers of the Centre National de la Recherche Scientifique of France, and the University of Hawaii.
Abstract
We present H and Ks-band photometry bracketing the secondary eclipse of the hot Jupiter TrES-3b using the Wide-field Infrared Camera on the Canada-France-Hawaii Telescope. We detect the secondary eclipse of TrES-3b with a depth of 0.133% in Ks-band (8) - a result in sharp contrast to the eclipse depth reported by de Mooij & Snellen. We do not detect its thermal emission in H-band, but place a 3 limit on the depth of the secondary eclipse in this band of 0.051%. A secondary eclipse of this depth in Ks requires very efficient day-to-nightside redistribution of heat and nearly isotropic reradiation, a conclusion that is in agreement with longer wavelength, mid-infrared Spitzer observations. Our 3 upper-limit on the depth of our H-band secondary eclipse also argues for very efficient redistribution of heat and suggests that the atmospheric layer probed by these observations may be well homogenized. However, our H-band upper limit is so constraining that it suggests the possibility of a temperature inversion at depth, or an absorbing molecule, such as methane, that further depresses the emitted flux at this wavelength. The combination of our near-infrared measurements and those obtained with Spitzer suggest that TrES-3b displays a near isothermal dayside atmospheric temperature structure, whose spectrum is well approximated by a blackbody. We emphasize that our strict H-band limit is in stark disagreement with the best-fit atmospheric model that results from longer wavelength observations only, thus highlighting the importance of near-infrared observations at multiple wavelengths in addition to those returned by Spitzer in the mid-infrared to facilitate a comprehensive understanding of the energy budgets of transiting exoplanets.
Subject headings:
planetary system – stars: individual: TrES-3 – techniques: photometric – eclipses – infrared: stars1. Introduction
Near-infrared secondary eclipse observations of hot Jupiters from the ground is a relatively new field. After a series of non-detections and increasingly more sensitive upper limits using photometry (Snellen 2005; Snellen & Covino 2007; Deming et al. 2007) and spectroscopy (Richardson et al. 2003; Knutson et al. 2007), the field has been reinvigorated by a series of successful ground-based, photometric detections. Examples include: a 6 detection in Ks-band of TrES-3b using the William Herschel Telescope (WHT; de Mooij & Snellen 2009), a 4 detection in z’-band emission of OGLE-TR-56b using Magellan and the Very Large Telescope (VLT; Sing & Lopez-Morales 2009), a 5 detection at 2.1 with the VLT (Gillon et al., 2009), a 8 detection in the Ks-band of CoRoT-1b using the Apache Point observatory (APO; Rogers et al. 2009), and a 5 detection of WASP-12b’s z’-band emission also using the APO (Lopez-Morales et al., 2010). From our own program we were able to report a 5 detection of thermal emission from the hot Jupiter TrES-2b in Ks-band (Croll et al., 2010a) using the Wide-field InfraRed Camera (WIRCam) on the Canada-France-Hawaii Telescope (CFHT).
Near-infrared measurements of the thermal emission of hot Jupiters are crucial to our understanding of the dynamics and radiative transfer in the atmospheres of these exotic worlds as these measurements sample their blackbody peaks. Such near-infrared measurements, when combined with secondary eclipse detections longwards of 3 with Spitzer, enable us to characterize these planets’ pressure-temperature profiles and better understand their energy budgets. Specifically they facilitate an estimate of the bolometric luminosity of these planets’ dayside emission (Barman, 2008), leading to a more complete understanding of how the planets reradiate the incoming stellar flux and advect this heat from the day to nightside at various depths and pressures.
One of the most favourable targets for ground-based measurements is the transiting hot Jupiter TrES-3b. It circles a G-type star in a 31 hour orbit (O’Donovan et al., 2007). It is exposed to relatively high stellar insolation, with an incident flux of , and is thus a member of the hottest and mostly highly irradiated class (pM-class) of hot Jupiters according to the Fortney et al. (2008) theory. Its high equilibrium temperature (1650 ; assuming isotropic reradiation, and a zero Bond albedo) in combination with its relatively favourable planet-to-star radius ratio (0.166; Sozzetti et al. 2009), makes it a compelling target for thermal emission measurements.
Thermal emission from this target has already been measured with Spitzer in the four IRAC (Fazio et al., 2004) channels (Fressin et al., 2009). Their best-fit eclipes are consistent with a circular orbit, and Fressin et al. (2009) place a 3 limit on the eccentricity, , and argument of periastron, , of cos 0.0056. Despite the high incident stellar irradation for this target, their secondary eclipse measurements are best-fit with an atmospheric model that efficiently redistributes heat. Also, as the 4.5 eclipse depth is less than the 3.6 depth, this suggests that this planet does not harbour a temperature inversion, as we are seeing water in absorption rather than emission at 4.5 . This is surprising, because highly irradiated hot Jupiters, such as TrES-3b, were expected to experience temperature inversions due to absorption of the incoming stellar flux from gaseous TiO/VO in a hot stratosphere (Hubeny et al., 2003; Fortney et al., 2006; Burrows et al., 2007; Fortney et al., 2008).
In the near-infrared, de Mooij & Snellen (2009) have reported a detection of TrES-3b’s thermal emission in Ks-band using the LIRIS instrument on the WHT. The depth of their best-fit secondary eclipse was 0.241 0.043%, and this result argued in favour of very bright dayside emission and very inefficient redistribution of heat to the nightside of this planet, in sharp disagreement to the Spitzer results from longer wavelengths. However, the authors noted residual systematic noise during the ingress of the secondary eclipse that resulted in a deep, slightly eccentric best-fit eclipse. For these reasons we felt follow-up observations were warranted to confirm their measured eclipse depth.
A bright secondary eclipse in the near-infrared is reasonable, as simplified one-dimensional, radiative transfer models (Hubeny et al., 2003) suggest that one can expect hot Jupiters without temperature inversions to display increased thermal emission in the near-infrared. This makes intuitive sense as the decreased output in the mid-infrared allows the planet to shine more brightly at shorter wavelengths. On the other hand, near-infrared observations are expected to probe atmospheric layers that are more homogenized than the layers probed by longer wavelength observations. This is because the JHK near-infrared spectral bands occur at minima in the opacity of water where one should be able to see deeper into a planet’s atmosphere than one can see in the mid-infrared with Spitzer (Seager et al., 2005; Fortney et al., 2008; Burrows et al., 2008a). JHK-band observations should then probe higher pressure () atmospheric layers. At higher pressures it is expected that the radiative time-scale (how quickly the planet reradiates the incident stellar flux; ) will become of similar order to the advective timescale (how quickly the planet advects the heat to the nightside of the planet; ) leading to a more homogenized atmospheric layer (Seager et al., 2005; Fortney et al., 2008). The reradiative timescale is thought to be proportional to pressure: (Showman & Guillot, 2002), where is the temperature, is the specific heat capacity, is the Stefan-Boltzmann constant, and is the gravitational acceleration of the planet. The advective timescale, on the other hand, is thought to be approximated by the radius of the planet, , divided by the horizontal windspeed, : /U (Showman & Guillot, 2002). For these reasons, as one probes higher pressure atmospheric layers, should increase, and become of similar order to ; this has been confirmed by 3D models (Showman et al., 2009). For the near-infrared JHK bands we therefore may expect more efficient heat redistribution and that the near-infrared emission may be depressed, as the depths we probe may be more homogenized than the upper atmospheres of these planets. This behavior is difficult to capture for a 1D radiative-equilibrium model that assumes an average day-side temperature or planet-wide conditions. For these reasons near-infrared observations are crucial to inform our understanding of the underlying physics that govern hot Jupiter radiative transfer and atmospheric dynamics.
Here we present observations bracketing TrES-3b’s secondary eclipse using WIRCam on CFHT. We report a 8 detection of its Ks-band thermal emission of 0.133% and place a 3 upper limit on its thermal emission in H-band of 0.051%. We do not find that this planet radiates brightly in the near-infrared, as our Ks-band measurement and our H-band upper limit argue in favour of very efficient day-to-nightside redistribution and nearly isotropic reradiation of heat. These results are in clear contrast to the de Mooij & Snellen (2009) result, although we explain that under different assumptions their result is consistent with our own. Our H-band limit is so constraining that it suggests that the layer of the atmosphere probed by this wavelength is very well homogenized and that there may be a temperature inversion deep in this planet’s atmosphere, or that the emitted flux is depressed at this wavelength due to a wide absorption band near 1.6 .
2. Observations and data reduction


We observed the secondary eclipse of TrES-3 (=10.608, =10.655) on two occasions with WIRCam on CFHT (Puget et al., 2004). On 2009 June 3 we observed TrES-3 using a Ks-band filter and on 2009 June 6 we observed it again using an H-band filter. Both observations were taken under photometric conditions and lasted for 3.1 hours for our Ks observations and 2.8 hours for our H-band observations, evenly bracketing the predicted secondary eclipse. On both occasions numerous reference stars were also observed in the 21x21 arcmin field of view of WIRCam. The telescope was defocused to 1.0mm, resulting in the flux of our target star being spread over a ring 13 pixels in diameter (4″) on our array. We used “stare” mode on CFHT where the target star is observed continuously without dithering for the duration of the observations.
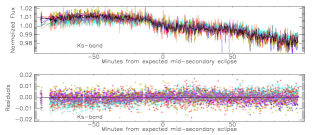
We used 5-second exposures for our Ks-band observations. The effective duty cycle after accounting for readout and for saving exposures was 33%. Following the observations we noted significant drifts in the centroid of the stellar point-spread-function (PSF) of TrES-3 as well as other stars on the chip (Figure 1 top panels).
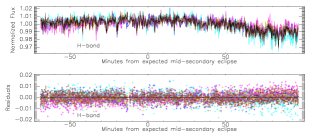
For our H-band observations, and subsequent observations in our program, to counteract these drifts we initiated a corrective guiding “bump” before every image cube to ensure that our target star fell as often as possible on or near the original pixel. Following this corrective “bump” the drifts on the chip were significantly reduced (Figure 1 bottom panels). To counteract the extra overheads that this “bump” induced, we observed in “cubes” of multiple images in each FITS files. Thus, for our H-band observations we obtained data-cubes each containing twelve 5-second exposures. The effective duty cycle after accounting for readout and for saving exposures was 43%.
For both sets of data the images were reduced and aperture photometry was performed on our target star and all unsaturated, reasonably bright reference stars on the WIRCam array as discussed in Croll et al. (2010a). Exceptions include that we do not modify the shape of the annulus used to calculate the sky aperture, and that we do not correct the flux of our targets for the x or y position of the centroid of the stellar PSF. We used an aperture with a radius of 11 pixels for our Ks-band photometry, and an aperture with a radius of 10.5 pixels for our H-band photometry. To estimate the residual background flux for both sets of photometry we used an annulus with an inner radius of 18 pixels and an outer radius of 28 pixels. We tested larger and smaller apertures in increments of 0.5 pixels, and confirmed that these sizes of apertures returned optimal photometry.
For our H-band photometry pixels in the annulus produced by our defocused target star occassionally saturated, and were removed in the preprocessing step; similar saturation issues were noted with some of our reference stars as well. It was difficult to account for the discrepancy in flux that resulted from these saturated pixels at the precision required for these observations; thus observations in which a pixel near our target star were saturated were excluded from the resulting analysis. 62 of our 718 H-band observations (8.6% of the total) were cut as a result of this step. Saturation was not an issue in the 740 exposures for our Ks-band photometry.


As with our previous near-infrared CFHT/WIRCam photometry (Croll et al., 2010a), the resulting light curves displayed significant, systematic variations in intensity (see the top panels of Figure 2), possibly due to changes in atmospheric transmission, seeing and airmass, guiding errors and/or other effects. These variations in the flux of our target star were then corrected by normalizing the flux of the target star by 9 reference stars in Ks-band and 10 in H-band using the method discussed in Croll et al. (2010a). This method entails using the reference stars that showed the smallest deviation from the target star outside of the expected secondary eclipse to correct the flux of our target star. As a result of these corrections (and the removal of a linear-trend with time for the sake of this comparison only), the point-to-point scatter of our data outside of occultation improved from a root-mean-square of 13.810-3 to 1.6010-3 in Ks and 5.910-3 to 0.8410-3 in H per 60 seconds (Figure 2). We should note that we are still well above the predicted photon noise RMS limit of 3.710-4 for Ks-band, and 2.710-4 for H-band per 60 seconds. We set the uncertainty on our measurements as the RMS of the out of eclipse photometry after the removal of a linear-trend with time. We also bin our out-of-eclipse photometry following the above reduction and compare it to the one-over-the square-root of the number of binned points expectation for gaussian noise. Although our Ks-band data scales down near this limit, our H-band data displays systematics that result in the data scaling down marginally above this limit (Figure 3). This suggests that there is an extra systematic in our H-band photometry that merits further investigation.
3. Analysis

| Parameter | MCMC Ks-band | “Residual permutation” | MCMC H-band | “Residual permutation” | Bootstrap |
|---|---|---|---|---|---|
| Solution | Ks-band solution | Solution | H-band solution | H-band solution | |
| reduced | 1.044 | 1.037 | 1.131 | 1.123 | 1.128 |
| (%) | 0.133 | 0.132 | -0.002 | 0.011 | -0.003 |
| 3 upper limit on (%) | 0.185 | 0.154 | 0.047 | 0.045 | 0.051 |
| ()aaWe account for the increased light travel-time in the system (Loeb, 2005). | 3.4 | 3.6 | 0.0bbBy assumption. | -0.0bbBy assumption. | -0.4bbBy assumption. |
| (HJD-2440000) | 14985.9542 | 14985.9543 | 14989.8703bbBy assumption. | 14989.8703bbBy assumption. | 14989.8701bbBy assumption. |
| 0.00212 | 0.00211 | 0.00032 | 0.00010 | 0.00029 | |
| () | -0.025 | -0.025 | -0.005 | -0.004 | -0.005 |
| aaWe account for the increased light travel-time in the system (Loeb, 2005). | 0.5020 | 0.5021 | 0.5002bbBy assumption. | 0.5002bbBy assumption. | 0.0000bbBy assumption. |
| 0.0029 | 0.0030 | 0.0000bbBy assumption. | -0.0000bbBy assumption. | -0.0003bbBy assumption. | |
| () | 1731 | 1727 | n/a | n/a | n/a |
| 3 upper limit on () | 1887 | 1799 | 1635 | 1622 | 1658 |
| 0.303 | 0.300 | n/a | n/a | n/a | |
| 3 upper limit on f | 0.429 | 0.354 | 0.242 | 0.234 | 0.255 |
Similarly to a number of our near-infrared photometric data-sets taken with CFHT/WIRCam (Croll et al., 2010a, b), our Ks-band photometry following the reduction exhibited an obvious background trend, , with a near-linear slope. The H-band photometry also displayed a less obvious background trend. Although these trends could be intrinsic to TrES-3, the frequency with which we find such background trends with our other near-infrared photometric data-sets suggests that they are systematic in origin. We thus fit both data-sets independently with a secondary eclipse model and a linear background of the form:
| (1) |
where is the time interval from the beginning of the observations. As in Croll et al. (2010a) we fit for the best-fit secondary eclipse and background using Markov-Chain Monte Carlo methods (Christensen et al. 2001; Ford 2005; described for our purposes in Croll 2006). We use a 5106 step MCMC chain. We fit for , , the depth of the secondary eclipse, , and the mid-eclipse phase, . We also quote the offset that the eclipse occurs later than the expected eclipse center, 111we take into account the 22 delay due to light travel-time in the system [Loeb 2005], as well as the best-fit mid-eclipse heliocentric (UTC) julian date, . We use the Mandel & Agol (2002) algorithm without limb darkening to generate our best-fit secondary eclipse model. We obtain our stellar and planetary parameters for TrES-3 from Sozzetti et al. (2009).
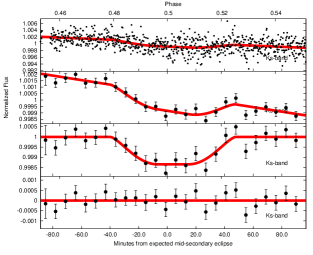
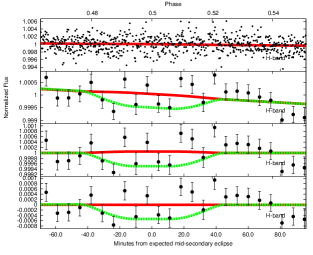
The results from these fits for the Ks and H-band photometry are presented in Table 1. The best-fit secondary eclipse models are presented in Figure 4. The phase dependence of the best-fit secondary eclipse for our Ks-band photometry is presented in Figure 5. For our H-band photometry we are unable to detect the secondary eclipse. Thus for our H-band analysis that follows we artificially restrict the eccentricity of TrES-3b to 0, and thus we do not fit for the eclipse phase, .
To determine the effect of systematic noise in the derived eclipse parameters we also fit our data using the “residual-permutation” method (Winn et al., 2009), described for our purposes in Croll et al. (2010a). For our H-band data we also perform 8000 iterations of a boot-strap method that randomly scrambles the residuals and refits the data. The results from all these methods are presented in in Table 1. For our Ks-band data, as the “residual permutation” and the MCMC analyses result in similar unncertainties we quote the MCMC errors for the rest of the paper. For our H-band data, the boot-strap method returns the most conservative upper limit, and we thus quote this limit for the rest of the paper. We also present this 3 upper-limit on the eclipse depth in Figure 4.
We note that for our Ks-band data specifically we also explored a quadratic expression for the background term, : , where is also a fit parameter. A background of this term returned similar eclipse parameters to that of our linear background fit, and thus we quote our linear background MCMC fit henceforth.
4. Discussion

The depth of our best-fit secondary eclipse in Ks-band is 0.133%, with a reduced of 1.044. We discuss the implications of this detection combined with the other thermal emission constraints for this system in 4.1. In H-band we are unable to detect the secondary eclipse and discuss the implications of this in 4.2. We then compare these observations to atmospheric models in 4.3, and discuss the future prospects for this system in 4.4.
4.1. TrES-3b’s Ks-band thermal emission
Our Ks-band best-fit secondary eclipse is consistent with a circular orbit; the offset from the expected eclipse center is: = 3.4 minutes (or at a phase of =0.5020). This corresponds to a limit on the eccentricity and argument of periastron of = 0.0029, or a 3 limit of 0.0101. Our result is consistent with the more sensitive cos limits reported by Fressin et al. (2009) from the secondary eclipse detections at the four Spitzer/IRAC wavelengths. Our result therefore supports the conclusion of Fressin et al. (2009) that the “puffed-up” radius of TrES-3b is unlikely to be due to tidal damping of the orbital eccentricity.
A secondary eclipse of 0.133% corresponds to a Ks-band brightness temperature of = 1731 assuming a stellar effective temperature of = 5650 75 (Sozzetti et al., 2009). This compares to an equilibrium temperature 1650 assuming isotropic reradiation, and a zero Bond albedo.
We should note that our Ks-band detection is discrepant from the de Mooij & Snellen (2009) Ks-band detection of 0.241 0.043%. Our measurement is approximately half of their value, and is discrepant by more than 2. The best explanation for this discrepancy is the impact of systematic uncertainties for observations in the near-infrared; de Mooij & Snellen (2009) specifically mention several discrepant points at the beginning of their best-fit eclipse that both increase the depth of their eclipse and lead to an eccentric eclipse center ( = 0.4958 0.0027). If the planet is assumed to have zero eccentricity, in accordance with the Spitzer results and our own, and these discrepant points are excluded, then the resulting best-fit eclipse is: = 0.1740.046% (Ernst de Mooij & Ignas Snellen, personal communication). Thus our two measurements are consistent within 1 under these assumptions. Any remaining variation between our two eclipse depths is likely statistical in nature, or could be due to eclipse variability between our observations and theirs. The difference in our two eclipse depths would necessitate a change in the brightness temperature of only 100.
Our Ks-band secondary eclipse depth, when combined with the secondary eclipse depths at the Spitzer/IRAC wavelengths from Fressin et al. (2009) and the de Mooij & Snellen (2009) reanalyzed eclipse depth quoted above, is consistent with a range of Bond albedos, , and efficiencies of the day to nightside redistribution of heat on this presumably tidally locked planet (Figure 6). We parameterize the level of redistribution from the day to nightside by the reradiation factor, , following the Lopez-Morales & Seager (2007) definition, which relates the dayside temperature of the planet, to the stellar effective temperature (), stellar radius (), and semi-major axis of the planet (): = , in the absence of any intrinsic flux (which for hot Jupiters is much smller than the absorbed and reradiated stellar flux). From a theoretical perspective, one expects that the total reradiation factor, , of a hot Jupiter’s atmosphere should fall between isotropic reradiation (=), and no redistribution (=; Burrows et al. 2008b). For reference = denotes redistribution and reradiation from the dayside-face only. However, the reradiation factors of individual atmospheric layers may fall well below or above these levels, as in this case simply relates the properties of the system (, , and ) to the brightness temperature of the atmospheric layer probed by that wavelength of observations.
For our Ks-band observations, if we assume a Bond albedo near zero, consistent with observations of other hot Jupiters (Charbonneau et al., 1999; Rowe et al., 2008) and with model predictions (Burrows et al., 2008a), we find a reradiation factor of = 0.303 from our Ks-band eclipse photometry only, indicative of relatively efficient advection of heat from the day-to-nightside at this wavelength. Our Ks-band reradiation factor, , is consistent with the reradiation factor that results from combining our eclipse depth with that of the Spitzer/IRAC depths and the de Mooij & Snellen (2009) measurement quoted above. The best-fit total reradiation factor, , that results from a analysis of all the eclipse detections for TrES-3b (and thus excluding our H-band limit) assuming a zero Bond albedo is = 0.301.
Another way of parameterizing this redistribution is by comparing the bolometric dayside luminosity, , of the hot Jupiter to its nightside bolometric luminosity, . Simply by following elementary thermal equilibrium calculations one can deduce that TrES-3b should display a total bolometric luminosity of = 12.510-5, assuming it is in thermal equilibrium with its surroundings and has zero Bond albedo. For our = 0.301 blackbody model the dayside luminosity is = 7.510-5, suggesting that 60% of the incident heat on this planet is reradiated by the dayside, leaving 40% to be advected to the nightside.
4.2. An uppper-limit on TrES-3b’s H-band thermal emission
In H-band we are able to place a 3 upper-limit on the depth of the secondary eclipse of 0.051%. The 3 upper limit on the H-band brightness temperature is 1658 , a limit nearly as low as the equilibrium temperature of TrES-3b (1650) assuming a zero Bond albedo and isotropic reradiation. The associated reradiation factor for the atmospheric layer probed by our H-band observations is 0.255. Presuming that our limit does not suffer from systematic effects that we have not accounted for, the H-band brightness temperature of TrES-3 is remarkably low.
One possibility to explain the less-luminous dayside emission (weak H-band flux) of TrES-3b is that the albedo of TrES-3b is significantly non-zero, as has been conjectured for a number of hot Jupiters by Cowan & Agol (2010). If this conjecture is true for this planet then the observed thermal emission is not due to the planet reradiating nearly isotropically, but due to inefficient redistribution of heat after a significant fraction of the light is reflected (the allowed parameter space in the right-half of Figure 6). As mentioned above, a significantly non-zero albedo has been ruled out for all other hot Jupiters for which in-depth investigations have been performed. Nonetheless TrES-3b remains an attractive target for optical, reflected light observations.
More likely possibilites to explain the reduced H-band emission are that we are probing an atmospheric depth of TrES-3b that is well-homogenized, or that we are seeing a wide absorption band near this wavelength that is depressing the observed flux. Simplified one-dimensional atmospheric models (Fortney et al., 2008) suggest that we should be seeing deeper in the atmosphere in H-band than in Ks. Our measurements, taken at face value, imply that the atmosphere is modestly colder deeper down – that is, we are seeing a small temperature inversion deep in the atmosphere (and thus at a depth much greater than the temperature inversions seen by others in the Spitzer/IRAC bands). Perhaps this inversion is due to efficient homogenization at high pressures where the advectime timescale may be of similar order to the radiative timescale (Fortney et al., 2008). Alternatively, for the absorption band possibility, there could be a strong opacity source that is blocking our anticipated H-band opacity window, and we are actually seeing high in the atmosphere (low ) where the gas is colder. We find the former explanation compelling, but also explore the latter possibility of an additionial opacity source and a wide absorption band.
One possibility for a chemical that could be causing such absorption is methane, which has an absorption band at around 1.7 , which could, in principle, shave off flux from the red edge of the planet’s H-band flux. Such an absorption feature was recently detected in the emission spectrum of HD 209458 from the dayside of this planet (Swain et al., 2009), and was attributed to methane. For comparison, the L-type brown dwarfs, which reach down to 1350 K (Cushing et al., 2008; Stephens et a., 2009), show no evidence for methane in the near-infrared, but the T-type spectral class below 1350 K shows methane absorption in the near-infrared - indeed, that is the definition of the new spectral class. Due to the planet’s relatively high temperatures, detectable methane in the atmosphere of TrES-3b is not expected from considerations of equilibrium chemistry (Lodders & Fegley, 2002) or non-equilibrium chemistry including vertical mixing (Saumon et al., 2007). Photochemical models of hot Jupiter atmospheres show that methane is also readily destroyed by the incident stellar flux (Zahnle et al., 2009). However, these various chemical models are not yet verified for hot Jupiters, so methane absorption cannot be excluded at this time. If methane is present in a large enough quantity to suppress the H-band flux, it would significantly affect the opacities and thus the emitted flux at other wavelengths as well, particularly at 3.3 and 8 m, thus affecting conclusions on the efficiency of day-to-nightside redistribution and the presence or lack thereof of a temperature inversion for this planet. We encourage further modelling to explore this possibility.
4.3. Comparisons to atmospheric models
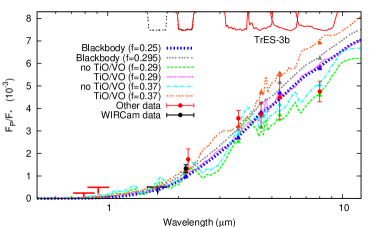
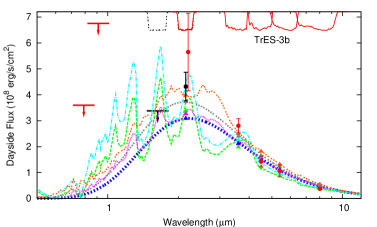
We compare the depth of our Ks-band eclipse, and our H-band 3 upper-limit on the eclipse depth, to a series of planetary atmosphere models in Figure 7. We include the Spitzer/IRAC eclipse depths reported by Fressin et al. (2009), the revised de Mooij & Snellen (2009) eclipse depth reported above, and the limits on thermal emission and reflected light at shorter wavelengths of Winn et al. (2008). This comparison is made qualitatively as well as quantitatively by integrating the models over the WIRCam H & Ks bandpasses as well as the Spitzer/IRAC channels and the WHT/LIRIS Ks-bandpass, and calculating the of the thermal emission data compared to the models. We specifically exclude and then include our H-band upper limit, and , respectively, as this upper limit is difficult to reconcile with the below models.
For the data longwards of 2 the eclipse depths are relatively well-fit by blackbody models featuring an isotropic reradiation factor (=; blue dotted line; =19.0), or our best-fit reradiation value (; grey dotted-line; =16.6). These models have dayside temperatures of 1650 and 1728, respectively. Blackbody models that fit the wavelength range between 2 and 7 , overpredict the 8 flux compared to the Spitzer/IRAC eclipse depth at this wavelength. We thus also compare these thermal emission measurements to a series of one-dimensional, radiative transfer, spectral models (Fortney et al., 2005, 2006, 2008) with different reradiation factors that specifically include or exclude gaseous TiO/VO into the chemical equilibrium and opacity calculations. In these models when TiO/VO are present in gaseous form in the upper atmosphere they act as absorbers at high altitudes and lead to hot stratospheres and temperature inversions (Hubeny et al., 2003). We present models with reradiation factors of =0.29, and =0.37, both with and without TiO/VO. Both the models with TiO/VO display temperature inversions. The brighter of these two inverted atmosphere models (=0.37; orange dotted line) is a close match to our own Ks-band point, but is generally too hot for the Spitzer wavelengths and is thus demonstrably inconsistent with the data (=29.1). The fainter of these two models with TiO/VO (=0.29; magenta dotted line) is a reasonable fit to some wavelengths, but is marginally discrepant from the Spitzer 8.0 point (=18.4). The models without temperature inversions are superior to those with inversions at 2.0 and longer. The best-fit model is the =0.37 model without TiO/VO (cyan dot-dashed line; =5.6), which provides a quantitatively and qualitatively better fit than the =0.29 model (green dashed line; =16.1). The differences are most obvious in the 3.6 channel, but the model better predicts the other bands as well. This thus suggests that a model without a temperature inversion with modest day-to-nightside redistribution provides an excellent fit to the measured eclipse depths at 2.0 and longwards.
However, the preceeding discussion completely ignored our strict H-band upper limit. This is appropriate if the low level of emitted flux at this wavelength is due to an absorption band from a species that we do not include, or do not include at the correct concentrations, in our model atmosphere. Nonetheless, we calculate the of our models including the H-band limit, . For reference, the predicted H-band flux from our best-fit blackbody model is 0.051%, a value we are able to exclude nearly at 3. The of our former best-fit model (=0.37 without TiO/VO) becomes much worse (=21.1), because our non-inverted atmospheric model predicts elevated flux in H-band (actually the higest flux in H-band of any of the models we present). The hottest model with the temperature inversion (=0.37 with TiO/VO) remains a poor fit (=39.7), but the cooler models (=0.29) with and without TiO/VO are nearly statistically indistinguishable from our best-fit model (=25.6 with TiO/VO, and =25.7 without TiO/VO). Our blackbody models actually provide very similar fits to these models, as these simple models predict much lower emission in H-band, consistent with our strict upper-limit (=26.8 for our blackbody model with =, and =28.7 for our blackbody model with =0.301). If the pressure-temperature profile of the atmosphere is more nearly isothermal than predicted by models, then the differences between emission peaks and troughs will be muted, leading to more blackbody-like emission spectrum – we find this explanation compelling for TrES-3b.
4.4. Future prospects
Our near-infrared observations of this planet’s secondary eclipse clearly show the need for multi-wavelength observations to develop a complete understanding of the energy budgets of hot Jupiters. In addition, detections of secondary eclipses in multiple near-infrared bands for multiple planets opens the door of a comparitive study of hot Jupiters and brown dwarfs at similar , to better understand how heating from above, versus heating from below, affects the temperatures and chemistry of these objects. We will shortly reconfirm or improve upon our H-band upper limit by observing TrES-3b in this band again, to continue to facilitate a greater understanding of this planet’s reradiation, and advection of heat at various depths and pressures in its exotic atmosphere.
References
- Barman (2008) Barman, T.S. 2008, ApJ, 676, L61
- Burrows et al. (2007) Burrows, A. et al. 2007, ApJ, 668, L171
- Burrows et al. (2008a) Burrows, A. et al. 2008a, ApJ, 682, 1277
- Burrows et al. (2008b) Burrows, A. et al. 2008b, ApJ, 678, 1436
- Christensen et al. (2001) Christensen, N. et al. 2001, Classical Quantum Gravity, 18, 2677
- Charbonneau et al. (1999) Charbonneau, D. et al. 1999, ApJ, 522, L145
- Cowan & Agol (2010) Cowan, N. & Agol, N.B. 2010, astro-ph/1001.0012
- Croll (2006) Croll, B. 2006, PASP, 118, 1351
- Croll et al. (2010a) Croll, B. et al. 2010a, ApJ, accepted, astro-ph/1005.3027.
- Croll et al. (2010b) Croll, B. et al. 2010b, AJ, submitted April 29 2010.
- Cushing et al. (2008) Cushing, M.C. et al. 2008, ApJ, 678, 1372
- de Mooij & Snellen (2009) de Mooij, E.J.W. & Snellen, I.A.G. 2009, A&A, 493, L35
- Deming et al. (2007) Deming, D. et al. 2007, MNRAS, 378, 148
- Fazio et al. (2004) Fazio, G.G. et al. 2004, ApJS, 154, 10
- Ford (2005) Ford, E.B. 2005, AJ, 129, 1706
- Fortney et al. (2005) Fortney, J.J., et al. 2005, ApJ, 627, L69
- Fortney et al. (2006) Fortney, J.J., et al. 2006, ApJ, 642, 495
- Fortney et al. (2008) Fortney, J.J., et al. 2008, ApJ, 678, 1419
- Fressin et al. (2009) Fressin, F. et al. 2009, astro-ph/0909.5221
- Gillon et al. (2009) Gillon, M. et al. 2009, A&A, astro-ph/0905.4571
- Hauschildt et al. (1999) Hauschildt, P.H. et al. 1999, ApJ, 512, 377
- Hubeny et al. (2003) Hubeny, I. et al. et al. 2003, ApJ, 594, 1011
- Knutson et al. (2007) Knutson, H. et al. 2007, PASP, 119, 616
- Lodders & Fegley (2002) Lodders, K. & Fegley, B. 2002, Icarus, 155, 393
- Loeb (2005) Loeb, A. 2005, ApJ, 623, L45
- Lopez-Morales & Seager (2007) Lopez-Morales, M. & Seager, S. 2007, ApJ, 667, L191
- Lopez-Morales et al. (2010) Lopez-Morales, M. et al. 2010, astro-ph/0912.2359
- Mandel & Agol (2002) Mandel, K. & Agol, E. 2002, ApJ, 580, L171
- O’Donovan et al. (2007) O’Donovan, F.T. et al. 2007, ApJ, 663, L37
- Puget et al. (2004) Puget, P. et al. 2004, SPIE, 5492, 978
- Richardson et al. (2003) Richardson, L. J., Deming, D., & Seager, S., 2003, ApJ, 597, 581
- Rogers et al. (2009) Rogers, J.C. et al. 2009, astro-ph/0910.1257
- Rowe et al. (2008) Rowe, J. F et al. 2008, ApJ, 689, 1345
- Saumon et al. (2007) Saumone, D. et al. 2007, ApJ, 656, 1136
- Seager et al. (2005) Seager, S. et al. 2005, ApJ, 632, 1122
- Showman et al. (2009) Showman, A.P. et al. 2009, ApJ, 699, 564
- Showman & Guillot (2002) Showman, A.P. & Guillot, T. 2002, A&A, 385, 166
- Sing & Lopez-Morales (2009) Sing, D.K. & Lopez-Morales, M. 2009, A&A, 493, L31
- Snellen (2005) Snellen, I.A.G. 2005, MNRAS, 363, 211
- Snellen & Covino (2007) Snellen, I.A.G. & Covino, E. 2007, MNRAS, 375, 307
- Sozzetti et al. (2009) Sozzetti, A. 2009, ApJ, 691, 1145
- Swain et al. (2009) Swain, M. 2009, ApJ, 704, 1616
- Stephens et a. (2009) Stephens, D.C. et al. 2009, ApJ, 702, 154
- Todorov et al. (2010) Todorov, K. et al. 2010, ApJ, 708, 498
- Winn et al. (2008) Winn, J. N et al. 2008, AJ, 136, 267
- Winn et al. (2009) Winn, J. N et al. 2009, ApJ, 693, 794
- Zahnle et al. (2009) Zahnle, K., Marley, M.S., & Fortney, J.J. 2009, ApJ submitted, arXiv:0911.0728.