Tracing the Hercules stream around the Galaxy
Abstract
It has been proposed that the Hercules stream, a group of co-moving stars in the Solar neighborhood offset from the bulk of the velocity distribution, is the result of resonant interactions between stars in the outer disk and the Galactic bar. So far it has only been seen in the immediate Solar neighborhood, but the resonance model makes a prediction over a large fraction of the Galactic disk. I predict the distribution of stellar velocities and the changing Hercules feature in this distribution as a function of location in the Galactic disk in a simple model for the Galaxy and the bar that produces the observed Hercules stream. The Hercules feature is expected to be strong enough to be unambiguously detected in the distribution of line-of-sight velocities in selected directions. I identify quantitatively the most promising lines of sight for detection in line-of-sight velocities using the Kullback-Leibler divergence between the predictions of the resonance model and an axisymmetric model; these directions are at . The predictions presented here are only weakly affected by distance uncertainties, assumptions about the distribution function in the stellar disk, and the details of the Galactic potential including the effect of spiral structure. Gaia and future spectroscopic surveys of the Galactic disk such as APOGEE and HERMES will be able to robustly test the origin of the Hercules stream and constrain the properties of the Galactic bar.
1 Introduction
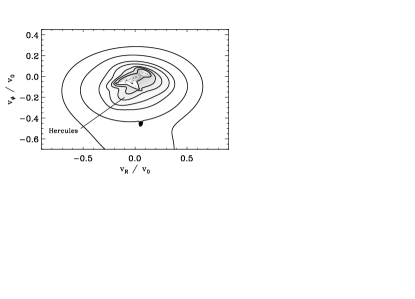
The velocity distribution of nearby stars contains various large overdensities of co-moving stars that cannot be explained as the vestiges of clumpy star formation (e.g., Bovy & Hogg, 2010). In particular, the Hercules moving group, a group of stars significantly offset from the bulk of the observed velocity distribution (e.g., Dehnen, 1998; Bovy et al., 2009b, see Figure 1), displays a wide range of ages and metallicities (Blaauw, 1970; Raboud et al., 1998; Caloi et al., 1999; Bensby et al., 2007; Bovy & Hogg, 2010). A compelling model has the Hercules stream originating through resonant interactions of stars in the outer disk with the bar in the central region of the Galaxy (Dehnen, 2000; Fux, 2001), but there is no confirmation of this picture beyond the locally observed stellar kinematics that it was proposed to explain. An investigation of the Hercules members’ color–magnitude diagram found no evidence for any significant metallicity anomaly with respect to other local stars (Bovy & Hogg, 2010), even though such a difference should be expected as the Hercules stars originate from a few kiloparsec toward the Galactic center where the average metallicity is higher than in the Solar neighborhood. The absence of the predicted metallicity anomaly could potentially be explained, e.g., through radial mixing (Sellwood & Binney, 2002), but it is clear that chemodynamical modeling of the Galactic disk is not currently up to the task of separating out these effects (e.g., Samland & Gerhard, 2003; Roškar et al., 2008).
Here I propose that a robust and unambiguous test of the bar-resonance model for the Hercules stream is a search for the distinct pattern it predicts as we trace the velocity distribution of stars near the Solar radius around the Galaxy. Gaia is in a good position to have the final word on this, but I also show that the Hercules feature can be detected in the line-of-sight velocity distribution in selected directions on the sky. Clear signatures are predicted to be detectable in regions a few kiloparsec from the Sun, allowing for a clean verification of the bar-resonance model for the Hercules stream.
2 Methodology
To simulate the effect of the bar on stellar orbits near the Solar circle, we follow the approach of Dehnen (2000). For each fixed position in the Galaxy, we evaluate the velocity distribution function at values for the radial—toward the Galactic center—and tangential—in the direction of Galactic rotation—velocity by backward-integrating these velocities in the Galactic potential to obtain the intial orbit before bar formation. We posit that at this epoch the old stellar disk was in a steady-state that can be described by a simple distribution function that is a function of the energy and angular momentum of the orbit alone. It follows from the collisionless Boltzmann equation that the value of the velocity distribution at the present position and velocity is equal to that of the steady-state distribution function before bar formation evaluated at the initial position and velocity—or, equivalently, at the initial orbit since the initial distribution function is time-independent.
Since the Hercules stream is only apparent in the planar motions in the disk (e.g., Bovy et al., 2009b), we only consider a two-dimensional model for the Galaxy. We use a simple power-law rotation curve to model the axisymmetric Galactic potential
| (1) |
where is the distance from the Sun to the Galactic center. For most of the simulations below we specify this model further to a flat rotation curve (). The model for the bar is given by the following potential
| (2) |
Here is the pattern speed of the bar and is the bar radius, which is fixed to be 80 percent of the bar’s corotation radius. The bar is grown smoothly during a time , always set to half of the total integration time in what follows, using the prescription
| (3) |
A comparison of the local velocity distribution obtained by using this simple bar potential with that resulting from the more realistic one of Gardner & Flynn (2010) shows that this simple potential is sufficient to model the bar’s influence on stellar orbits in the outer disk.
For the distribution function of the stellar disk before bar formation, we use a Dehnen distribution function (Dehnen, 1999a) given by
| (4) |
where , , and are the radius, angular momentum, and angular frequency, respectively, of the circular orbit with energy . Using the procedure given in 3.2 of Dehnen (1999a), we choose the and functions such that they reproduce a disk with exponential surface density and velocity dispersion profiles
| (5) |
to an accuracy of a fraction of a percent at all radii. Our fiducial model for the distribution function has = /3 and = 3, and such that .
As shown by Dehnen (1999b, 2000), the model described above with the Sun at = 0.9—where is the radius at which a circular orbit is in the outer Lindblad resonance with the bar—at a current angle of 25∘ with the bar, with a bar strength , and integrating for four bar periods, reproduces the Hercules feature in the local velocity distribution while agreeing with other photometric and kinematical observations of the bar (e.g., Binney, Gerhard, & Spergel, 1997; Bissantz & Gerhard, 2002; Cole & Weinberg, 2002; Shen et al., 2010). In what follows, unless indicated otherwise, we fix all of the parameters of the model at these fiducial values. All velocities are always considered to be with respect to their local standard of rest in the absence of a bar.
3 The full planar velocity distribution in the disk
Dehnen (2000) only simulated the velocity distribution at the position of the Sun for various combinations of the model parameters defined in the previous Section. Nevertheless, his results on how the velocity distribution at the Sun changes with the angle between the Sun-Galactic center line and the bar could also be interpreted as showing the velocity distribution on the Solar circle for different Galactocentric azimuths, fixing the bar angle. In this way, these simulations can make predictions for what we might find when we study the velocity distribution in regions beyond those probed by the Hipparcos mission (ESA, 1997).
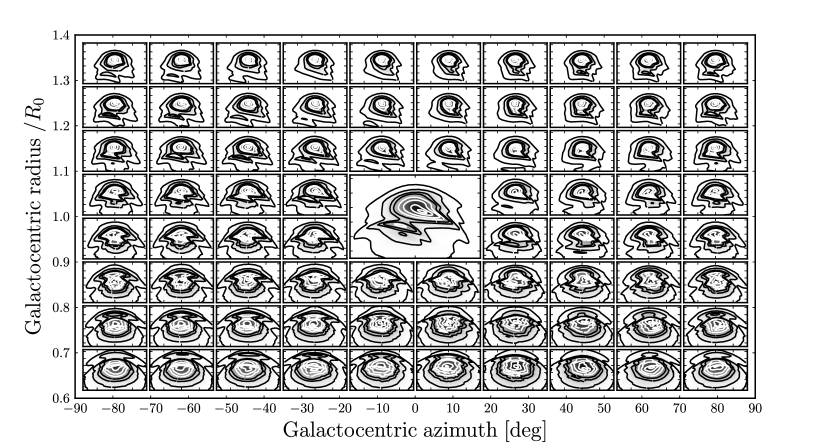
In Figure 2, I present the predictions for the two-dimensional velocity distributions near the Solar circle for the full 360∘ range in Galactocentric azimuth for the fiducial model from 2. Only the range is shown here, since the barred Galaxy is symmetric with respect to rotations through 180∘; the predictions for the other side of the Galaxy can be obtained from those shown by shifting the azimuths by 180∘. The predicted velocity distributions on the Solar circle are not shown here, but they can be inferred from Figure 2 in Dehnen (2000).
It is clear from this Figure that we can trace the Hercules stream going around the Galaxy and when looking further in toward the Galactic center or further out. Furthermore, the effect of the bar is not confined to a narrow range in radii, but rather the effects of the bar and especially its outer Lindblad resonance are felt through a large range of radii (0.6 ). These effects are strong and robust predictions of the bar-origin model for the Hercules stream. This is especially the case in regions beyond the Solar radius. There the Hercules feature can be found significantly removed from the bulk of the velocity distribution, which might be severely shaped at all locations by the processes that create the pattern of low-velocity moving groups in the local velocity distribution (the main mode in Figure 1). As I discuss below, Gaia will be able to verify these predictions.
4 Line-of-sight velocity distributions
Rather than wait for a comprehensive survey of the Galactic disk that measures the full phase-space position of a large number of stars by measuring proper motions, we can ask whether a targeted survey of line-of-sight velocities in selected regions of the Galaxy could detect a clear signature of the Hercules feature? The Hercules feature stands out in the velocity distribution most in its tangential velocity. On the Solar circle near the Sun the line-of-sight velocity is almost entirely this Galactocentric tangential velocity, so we would expect to see at least a hint of the Hercules stream in the line-of sight.
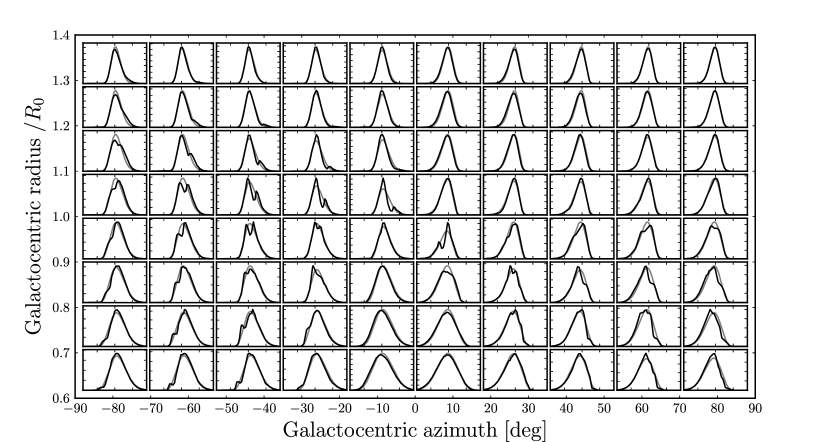
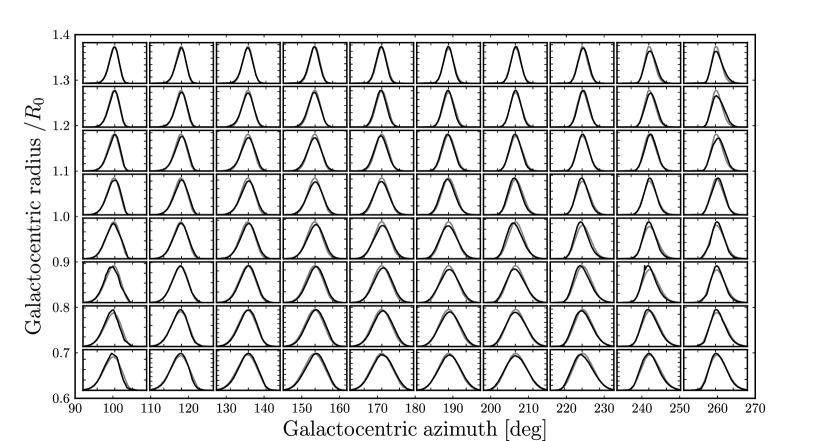
In Figure 3 I show the predicted line-of-sight velocity distributions in various locations near the Solar circle all around the Galaxy, obtained by integrating the full two-dimensional velocity distribution over the velocity component perpendicular to the line of sight. This Figure is no longer symmetric with respect to shifts of 180∘ in azimuth, since the line-of-sight direction breaks this symmetry. The gray curve is the line-of-sight distribution we would observe if the targeted stars were in a steady state in an axisymmetric potential with a Dehnen distribution function (equation [4]). Both line-of-sight velocity distributions are normalized to have equal mass since I assume that our knowledge of the Galaxy and the tracer population will not be good enough that we can test predicted differences in the absolute number of stars at a given location between the axisymmetric and the bar-resonance predictions. These differences are also largely a function of the particular form and parameters of the distribution function that we choose to represent the stellar disk before bar formation.
The prospects to detect the Hercules feature are quite good on our side of the Galaxy. The Hercules feature is especially strong in the line-of-sight velocity distribution for Galactic longitudes . This is because of the fortunate coincidence that for those lines-of-sight we see velocities in the direction along which the Hercules streams separates most from the bulk of the velocity distribution (see Figure 2) and that at these azimuths the Hercules stream is at the furthest distance from the rest of the velocity distribution. We see hardly any effect of the bar on the line-of-sight velocity distributions on the other side of the Galaxy (). On that side we mostly see the Galactocentric radial velocity in the line-of-sight, in which the Hercules feature does not separate clearly from the bulk of the stars. Even though upcoming surveys such as APOGEE have the ability to probe the other side of the Galaxy, for the purposes of detecting the Hercules stream this is uninteresting as it does not show up in the line-of-sight velocity distribution there.
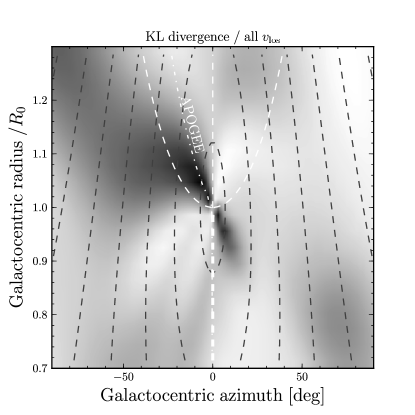
To further analyze the directions to target to best see the Hercules feature in the line-of-sight velocities, I have calculated the line-of-sight velocity distribution on a 100 by 20 grid in Galactocentric azimuth and radius. As a measure of the difference between the bar-resonance model and the steady-state, axisymmetric model, I have calculated the Kullback-Leibler divergence between these predicted distributions (e.g., Mackay, 2003)
| (6) |
where, in this case, is the line-of-sight velocity, is the predicted distribution for the bar-origin model of the Hercules stream, and is the axisymmetric prediction. The Kullback-Leibler divergence is only one among many possible choices to quantify the difference between two probability distributions. It can be interpreted as the expected weight of evidence for the prediction by the bar-resonance model over the fully axisymmetric prediction that can be expected from each sampled star. As such, locations with the maximal Kullback-Leibler divergence are those in which the Hercules feature stands out most prominently in the line of sight.
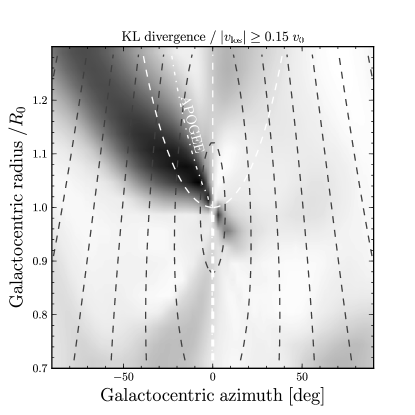
The result of this analysis is shown in Figure 4. I present results both using the full line-of-sight velocity distributions and only considering the part of the distribution at . As is clear from Figure 1, the local velocity distribution contains many more features than the Hercules stream. These features are mostly contained to the main mode of the velocity distribution . Observations indicate that these features are also the result of dynamical interactions (e.g., Bovy & Hogg, 2010; Sellwood, 2010), albeit with spiral arms rather than the bar. Therefore, we can expect these or similar features to be present in the velocity distribution at other locations in the Galaxy as well, and thus, if the effect of the Hercules stream occurs close to the center of the bulk of the velocity distribution, it might be hard to disentangle from the other dynamical effects at play. However, these additional dynamical effects will be much less important for velocities . Figure 4 shows that there are many locations, mostly at , where the Hercules stream is clearly offset from the bulk of the velocity distribution and should be unambiguously detectable.
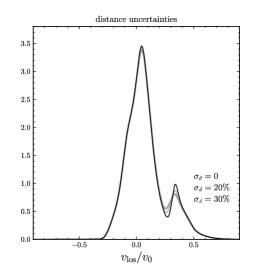
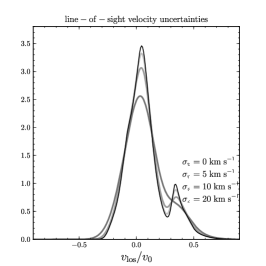
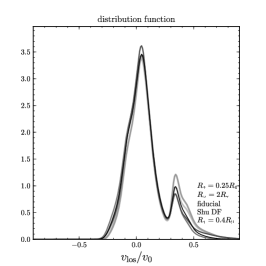
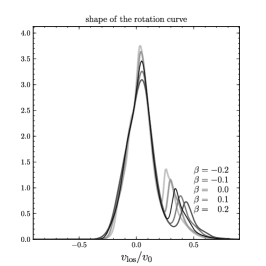
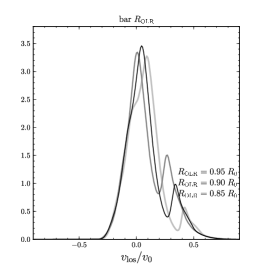
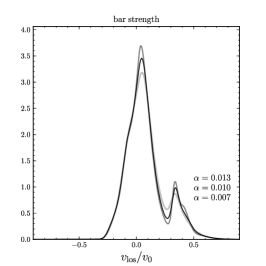
Finally, in Figure 5 I show the influence of various nuisance and dynamical parameters on the predicted line-of-sight velocity distribution for the most promising region that is more than 3 kpc away. We see in this Figure that the effect of distance and realistic line-of-sight velocity uncertainties is negligible. The exact shape and parameters of the stellar distribution function also only minimally affect the predicted line-of-sight velocity distribution. Changing the scale length within its current uncertainty changes the prediction only in the amplitude of the effect: The Hercules stream is more prominent for shorter scale lengths since then there are relatively more stars in the inner Galaxy that are brought to the Solar circle by the interaction with the bar. Using a Shu distribution function (Shu, 1969) instead of the Dehnen distribution function also gives very similar predictions. Changing the axisymmetric potential by adjusting the shape of the rotation curve shifts the peak as expected (see Dehnen, 2000), but the Hercules feature nevertheless remains detectable. The properties of the bar itself, e.g., its pattern speed through or its strength , change the predicted pattern, but they do not significantly alter the prospects for detection.
5 Discussion
The discussion in the previous sections shows that the bar-origin paradigm for the Hercules moving group makes strong predictions about how the Hercules feature should show up when we probe the velocity distribution in parts of the Galaxy far removed from the Solar neighborhood. In order to most strongly test the bar origin for the Hercules moving group it is best to extrapolate this picture far from the Solar neighborhood and look at regions further than a few kpc removed. Gaia’s parallaxes, proper motions, and mission-averaged line-of-sight velocities for dwarfs nearby and giants at distances greater than a few kpc will allow the full two-dimensional velocity distribution to be confronted with the predictions of Figure 2 (see below). However, the final Gaia catalog will only be available around 2020.
The predicted line-of-sight velocity distributions in the previous section show that the bar-origin theory for the Hercules moving group can be tested with line-of-sight velocities alone. At distances greater than a few kpc this will mean observing giants to trace the velocity distribution. Large, planned spectroscopic surveys with line-of-sight velocity uncertainties less than 1 km s-1 can test the predictions made in this paper in the next few years (see below). These surveys will not need to observe many stars to test the predictions laid out here: Drawing samples from the predicted velocity distribution in Figure 5 shows that about 500 stars suffice to distinguish the bar-origin model from the axisymmetric prediction (based on a KS test with ). Since large distance uncertainties do not affect the prediction very much (see Figure 5), these stars can even be sampled throughout a volume of 500 pc or more. These spectroscopic surveys will also obtain detailed elemental abundances for their target stars, so they would also allow for a more detailed analysis of the abundances of stars in the Hercules stream (following, e.g., Bensby et al., 2007; Bovy & Hogg, 2010), which could shed more light on radial mixing in the Galactic disk.
The last two panels of Figure 5 show that the predicted line-of-sight velocity distribution depends strongly on the dynamical parameters of the bar. Changing the pattern speed of the bar through shifts the predicted distribution and in particular the location of the Hercules feature. While this shift at a particular location is degenerate with the shift due to the uncertainty in the local circular velocity, results from various locations can be combined to break this degeneracy and the local circular velocity is also already quite well constrained (e.g., Bovy et al., 2009a). Changing the strength of the bar changes the relative heights of the two main peaks in the predicted velocity distribution. However, the main peak of the velocity distribution might not be as simple as the one predicted here due to other dynamical effects. Integrated measures, such as the number of stars in the main peak and the number of stars in the Hercules feature, could mitigate this somewhat. While predicting actual constraints would involve detailed simulations of the expected data, it is clear that constraints on the dynamical properties of the bar can be derived from the experiment proposed in this paper.
5.1 Gaia
The astrometric Gaia mission will measure the parallaxes and proper motions of up to one billion stars, most of which will be disk stars (Perryman et al., 2001). With parallax and proper motion accuracies down to 10 as and mission-averaged line-of-sight velocity uncertainties smaller than 10 km s-1 for many stars to 17th magnitude, Gaia will be able to probe the kinematics of the disk out to several kpc in all directions (Katz et al., 2004; Bailer-Jones, 2008). Crucially, it will provide large samples of giants in many of the promising regions in Figure 2, with velocity measurements accurate enough to verify the predictions laid out in this paper. This will also allow the dynamical properties of the bar to be tightly constrained, something that will be hard for Gaia to do using direct observations of the bulge due to the large extinction toward the Galactic center (Robin et al., 2005).
5.2 Radial velocity surveys
Since the extinction in the optical bandpasses is rather large in the directions identified as promising in Figure 4 ( mag toward ; Marshall et al., 2006), spectroscopic surveys in the near-infrared such as APOGEE are the best option for seeing the Hercules feature in the line-of-sight direction. The range of Galactic longitudes that APOGEE can target along the disk is and its expected line-of-sight uncertainties are about 0.5 km s-1 (SDSS-III Project Description111Available at http://sdss3.org/collaboration/description.pdf .). From Figure 4 this longitude limit is right on the edge of where we might hope to detect the Hercules feature. The Hercules bump in the direction is about half as strong as in Figure 5, but remains as a clear signature of the bar. As before, about 500 stars a few kpc away are enough to detect the Hercules feature. Since APOGEE is expected to start taking data in 2011 and to finish operations before the first Gaia data release, APOGEE could potentially trace the Hercules stream around the Galaxy before Gaia does.
Another planned spectroscopic survey is HERMES (Freeman et al., 2010). While operating in the optical, it expects to survey hundreds of thousands of giants in the inner Galaxy, many as far as 6 kpc away, with line-of-sight velocity uncertainties less than 1 km s-1 (K. Freeman, private communication). Since HERMES operates from the Southern hemisphere it can observe the most promising directions in Figure 4 and, like APOGEE, detect the Hercules feature before Gaia.
References
- Bailer-Jones (2008) Bailer-Jones, C. A. L., 2008, in IAU Symp. 254, The Galaxy Disk in Cosmological Context, ed. J. Andersen, J. Bland-Hawthorn, & B. Nordström, (Dordrecht: Kluwer), 475
- Bensby et al. (2007) Bensby, T., et al., 2007, ApJ, 655, L89
- Binney, Gerhard, & Spergel (1997) Binney, J. J., Gerhard, O., & Spergel, D. N., 1997, MNRAS, 288, 365
- Bissantz & Gerhard (2002) Bissantz, N. & Gerhard, O., 2002, MNRAS, 330, 591
- Blaauw (1970) Blaauw, A., 1970, in IAU Symp. 38, ed. W. Becker & I. Kontopoulos (Dordrecht: Reidel), 199
- Bovy & Hogg (2010) Bovy, J. & Hogg, D. W., 2010, ApJ, 717, 617
- Bovy et al. (2009a) Bovy, J., Hogg, D. W., & Rix, H.-W., 2009a, ApJ, 704, 1704
- Bovy et al. (2009b) Bovy, J., Hogg, D. W., & Roweis, S. T., 2009b, ApJ, 700, 1794
- Caloi et al. (1999) Caloi, V., et al., 1999, A&A, 351, 925
- Cole & Weinberg (2002) Cole, A. A. & Weinberg, M. D., 2002, ApJ, 574, L43
- Dehnen (1998) Dehnen, W., 1998, AJ, 115, 2384
- Dehnen (1999a) Dehnen, W., 1999a, AJ, 118, 1201
- Dehnen (1999b) Dehnen, W., 1999b, ApJ, 524, L35
- Dehnen (2000) Dehnen, W., 2000, AJ, 119, 800
- ESA (1997) ESA, 1997, The Hipparcos and Tycho Catalogues (ESA SP-1200; Noordwijk: ESA)
- Freeman et al. (2010) Freeman, K., Bland-Hawthorn, J., & Barden, S., 2010, AAO Newsletter, 117, 9
- Fux (2001) Fux, R., 2001, A&A, 373, 511
- Gardner & Flynn (2010) Gardner, E. & Flynn, C., 2010, MNRAS, 405, 545
- Katz et al. (2004) Katz, D., et al., 2004, MNRAS, 354, 1223
- Mackay (2003) Mackay, D. J. C., 2003, Information theory, inference, and learning algorithms (Cambridge University Press)
- Marshall et al. (2006) Marshall, D. J., et al., 2006, A&A, 453, 635
- Perryman et al. (2001) Perryman, M. A. C., et al., 2001, A&A, 369, 339
- Raboud et al. (1998) Raboud, D., et al., 1998, A&A, 335, L61
- Robin et al. (2005) Robin, A. C., et al., 2005, A&A, 430, 129
- Roškar et al. (2008) Roškar, R., et al., 2008, ApJ, 684, L79
- Samland & Gerhard (2003) Samland, M. & Gerhard, O. E., 2003, A&A, 399, 961
- Sellwood (2010) Sellwood, J. A., 2010, MNRAS, 409, 145
- Sellwood & Binney (2002) Sellwood, J. A. & Binney, J.J., 2002, MNRAS, 336, 785
- Shen et al. (2010) Shen, J., et al., 2010, ApJ, 720, L72
- Shu (1969) Shu, F. H., 1969, ApJ, 158, 505