Herschel-PACS spectroscopy of the intermediate mass protostar NGC7129 FIRS 2 ††thanks: Herschel is an ESA space observatory with science instruments provided by European-led Principal Investigator consortia and with important participation from NASA
Abstract
Aims. We present preliminary results of the first Herschel spectroscopic observations of NGC7129 FIRS2, an intermediate mass star-forming region. We attempt to interpret the observations in the framework of an in-falling spherical envelope.
Methods. The PACS instrument was used in line spectroscopy mode (R=1000-5000) with 15 spectral bands between 63 and 185 m. This provided good detections of 26 spectral lines seen in emission, including lines of H2O, CO, OH, O I, and C II.
Results. Most of the detected lines, particularly those of H2O and CO, are substantially stronger than predicted by the spherical envelope models, typically by several orders of magnitude. In this paper we focus on what can be learned from the detected CO emission lines.
Conclusions. It is unlikely that the much stronger than expected line emission arises in the (spherical) envelope of the YSO. The region hot enough to produce such high excitation lines within such an envelope is too small to produce the amount of emission observed. Virtually all of this high excitation emission must arise in structures such as as along the walls of the outflow cavity with the emission produced by a combination of UV photon heating and/or non-dissociative shocks.
Key Words.:
Stars: formation - ISM: molecules1 Introduction
The common paradigm for the formation of low mass stars includes the spherical infall of a cloud core, the formation of a disk with a protostar at its centre, and a bipolar outflow emitted from the inner region of this disk/protostar structure. Large (R 10,000 AU), low temperature (T 20 K) envelopes, which are often approximated to be nearly spherical (Terebey, Shu, and Cassen terebey84 (1984)) are observed around young low mass stars and dominate the observed sub-millimeter emission (Shirley et al shirley00 (2000)). Recent observations show additional structures, possibly hot outflow cavity walls heated by UV photons (van Kempen et al vankempen09 (2009)) and shocks (Gianninni et al giannini99 (1999), van den Ancker et al vandenancker00 (2000), Nisini et al nisini02 (2002), Arce et al arce07 (2007), van Kempen et al vankempen10 (2010)). Our understanding of the formation of high mass stars is not so mature, although it is clear that there are some significant differences between the low mass and high mass formation mechanisms, including the fact that massive stars are predominantly born in clusters where interactions between stars are important in the formation mechanism. Low mass stars likely form in clusters too, but their early evolution may be unaffected by neaerby stars until when the first high mass star forms in their vicinity. Then the formation process for the low mass stars probably changes dramatically and perhaps even ceases. The many unanswered questions about these mechanisms include: is there a continuum of properties between the low and high mass young stellar object; where is the boundary between low mass and high mass stars; do these “intermediate mass (IM)” stars form singly or in clusters?
The scarcity of IM stars has made answering such questions difficult. High mass stars are also rare in the vicinity of the Sun but their high luminosities make it possible to detect and study them at much larger distances. Intermediate mass protostars are usually defined as those Young Stellar Objects (YSOs) with bolometric luminosities between 75 L⊙ and L⊙, although both the lower and upper limits of this range vary slightly from one author to another. There are no examples of well-studied very young protostars (e.g. Stage 0/Class 0) with luminosities within this range within 400 parsecs of the Sun. There are a handful of such objects with distances between 400 and 1500 pc, which are individually identified and not confused in larger OB associations.
The recent launch of the ESA Herschel Space Observatory (Pilbratt et al pilbratt (2010)) provides us with an opportunity to study IM stars with previously unavailable molecular probes. The Water In Star forming regions with Herschel (WISH) Key Program uses emission from water and other key molecules to probe the conditions in a variety of star forming regions.
At a distance of parsecs (Shevchenko & Yakubov, shevchenko (1989)), NGC 7129 FIRS2 is the most distant of the objects in the WISH intermediate mass sub-program. FIRS2 contains a 5 M⊙ protostar and has a luminosity of 500 L⊙ and a hot core (Fuente et al fuente01 (2001), 2005a ). As a very young YSO it was expected that the structures dominant in this object would be those of the earliest, infalling, stage of the formation process. There is no evidence for a large, well-developed disk as one would expect to find in an older YSO. On the other hand, a well-developed quadrupolar outflow (due to the superposition of two bipolar outflows), has been found very close to the protostar (Fuente et al, fuente01 (2001)), indicating that some evolution past the collapsing spherical envelope stage has occurred.
A recent analysis of a number of IM YSOs included NGC7129 FIRS2 (Crimier et al crimier (2010)). This analysis models the objects as spherical envelopes, includes all available far infrared (Spitzer) and submillimeter (JCMT and IRAM) brightness measurements. The best-fit model found by Crimier et al (crimier (2010)) has an envelope mass of 50 M⊙, an optical depth at 100 m of 2.3, an inner radius of 100 AU and an outer radius of 18,600 AU. The temperature at the inner envelope radius is 300 K and this falls to 100 K at a radius of 373 AU where the H2 density is cm-3. The density varies as a power-law with index 1.4.
We use this model as a starting point for understanding the observations described here. We present a first look at NGC7129 FIRS2, the youngest known IM YSO, with the PACS instrument (Poglitsch et al poglitsch (2010)) on the Herschel Space Observatory. The high excitation lines accessible with the instrument should provide the best probe available of the warmest, innermost regions.
2 Observations
The PACS instrument was used to obtain data for this project during the Herschel Science Demonstration Phase on October 26, 2009. The pointed line-scan mode was used to obtain data in two scans (Obs ID 1342186321 and 1342186322). Data were reduced using HIPE v2.4 and then analyzed using IDL. The relative and absolute spectral response functions are based on ground calibrations and corrected for in-flight observations by dividing fluxes below and above 100 m by 1.3 and 1.1, respectively 111From internal PACS-ICC results. The continuum levels were found to vary from band to band but only a simple polynomial function was required to remove this baseline emission. The noise levels also varied from band to band, but a typical value was 0.3 Jy with 0.01 m channel widths in the bands between 100 m and 180 m independent of scan or receiver, which corresponds well to the noise levels predicted in HSPOT, the Herschel Science Planning and Observing Tool. The spectral resolution is 3,000 at 63.2 m but varies from 1000 to 4000 over the wavelength range used here.. The PACS spectra are imaged in 55 pixels, with each pixel subtending 9.4′′ by 9.4′′ , with no gaps between the pixels. For wavelengths shortward of 110 m this (9.4′′ ) is the effective resolution but the psf is significantly larger than the pixels at longer wavelengths such that at 200 m only 40% of the light of a well-centred point source falls on the central pixel. The central pixel was positioned at the coordinates of the central interferometer continuum peak at (J2000). While there is still an uncertainty in the flux calibration of approximately 50%, this does not have a significant impact on the first analysis of this object as presented here.
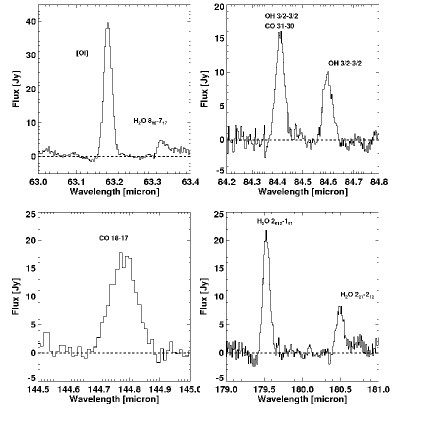
Table 1 lists 27 lines that were detected, including two pairs of blended lines. The fluxes given are measured only in the central pixel. The list of detections include 9 water lines (plus one blended with a CO line), 9 unblended CO lines, 3 OH lines (plus one blended with a CO line), and 2 [OI] lines. The rest wavelengths, upper level energies as well as the integrated line fluxes measured in the central PACS pixel are provided in Table 1. A number of spectra from these observations are shown in Figure 1. Note that the line width is essentially all due to the instrument spectral resolution. Five of these water lines were covered with ISO LWS but only upper limits were detected (Crimier et al crimier (2010)). In all five cases the LWS limits are a factor of ten or more greater than the detections listed here, with typical limits of W m-2.
In addition to the lines listed in Table 1 there is also a detection of the [CII] line at 158 m and numerous faint lines that can not be measured well until the calibration of PACS improves. [C II] 158 m emission is detected across the entire PACS field-of-view. The other emission lines in Table 1 come from a compact region, consistent with being smaller than the resolution of the instrument. This [CII] emission is likely not directly related to the YSO but instead arises from the much larger NGC 7129 nebula itself and will not be discussed further in this paper.
| Species | Transition | Eu | Int. Flux | |
|---|---|---|---|---|
| m | K | W m-2 | ||
| H2O | o 212-101 | 179.5 | 114.1 | 241 |
| o 221-212 | 180.5 | 194.1 | 120 | |
| o 221-110 | 108.0 | 194.1 | 295 | |
| o 303-212 | 174.6 | 196.8 | 227 | |
| p 313-202 | 138.5 | 204.7 | 194 | |
| p 404-313 | 125.4 | 319.5 | 113 | |
| o 414-303 | 113.5 | 323.5 | 596a𝑎aa𝑎ablended with CO (23-22) | |
| p 322-211 | 90.0 | 296.8 | 113 | |
| o 423-312 | 78.7 | 432.2 | 308b𝑏bb𝑏bEdge effect may have increased the flux | |
| o 818-707 | 63.3 | 1070.7 | 66 | |
| OH | 1/2-3/2 | 79.1 | 181 | 209 |
| 1/2-3/2 | 79.2 | 181 | 182 | |
| 3/2,7/2-3/2,5/2 | 84.4 | 291 | 290c𝑐cc𝑐cblended with CO (31-30) | |
| 3/2,7/2-3/2,5/2 | 84.6 | 291 | 181 | |
| OI | - | 63.2 | 227.7 | 802 |
| - | 145.5 | 326.6 | 50d𝑑dd𝑑dvery uncertain | |
| CO | 14-13 | 186.0 | 580.5 | 368 |
| 16-15 | 162.8 | 751.7 | 336 | |
| 18-17 | 144.8 | 945.0 | 308 | |
| 22-21 | 118.6 | 1397.4 | 273 | |
| 24-23 | 108.8 | 1656.5 | 173 | |
| 29-28 | 90.2 | 2400.0 | 153 | |
| 30-29 | 87.2 | 2564.8 | 246 | |
| 32-31 | 81.8 | 2911.2 | 144 | |
| 33-32 | 79.4 | 3092.5 | 112 |
3 Discussion
The CO lines detected in these observations are all lines characteristic of very hot regions. CO 33-32 for instance, arises from a level at an energy equivalent to 3093 K, and is not likely to be strong unless the excitation temperature is in excess of 1000 K. The typical excitation temperatures for the other species detected here are not as high and so, for this paper, we focus on the CO lines and only briefly discuss the other observed lines. We first examine our original idea for the dominant structure in NGC7129 FIRS2: that this YSO is very young and therefore is dominated by a spherical envelope. Is the gas, as traced by the most readily observed molecule, CO, compatible with the hypothesis of an infalling spherical envelope that can be fitted to the dust through SED modelling? We show that this idea is untenable in the face of the data obtained and described here. We are led to examine non-spherical geometries to explain these observations. There we examine details of the physical and radiative structure around intermediate mass protostars that could prove valuable in understanding star formation.
3.1 CO from a spherical protostellar envelope
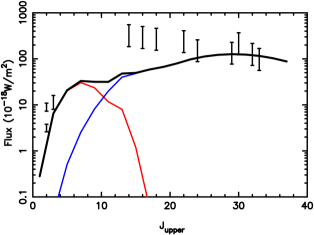
The envelope model used in the analysis by Crimier et al (crimier (2010)) provides a reasonable starting point for comparison to these new observations. The envelope in their model extends to 18,600 AU or 14′′ at the distance of this object, close to the beam-size of these observations. Crimier et al (crimier (2010)) do not make predictions for the CO lines and so we have reproduced their model envelopes and used the RATRAN radiative transfer code (Hogerheijde & van der Tak hogerheijde (2000)) to estimate the strength of the CO line emission. The model results are plotted in Figure 2 as a red line showing the integrated line strength versus the upper level rotation . The CO line emission observed by PACS is shown on the same plot, indicated by data points with error bars showing the 50% uncertainties in the measured fluxes.
Also shown in Figure 2 are three data points from low-J CO, integrated over a 20 arcsec wide aperture. Two CO =2-1 data points are given (from Fuente, private communication), the lower one for the velocity range of -11 to -9 km/s that may be appropriate for the envelope, and the upper one for the entire range over which emission is detected (-20 to 0 km/s) appropriate to the outflow. Although we present the -11 to -9 km/s ambient cloud velocity value it should be noted that no peak is seen in the map in this velocity range. The CO =3-2 data point is integrated over velocities from -14 to -6.5 km/s (Miskolczi et al, miskolczi01 (2001) and most of the emission is from the outflow - indeed it is not clear that any envelope emission is present in the maps shown. A measurement of CO J=1-0 was also made from published interferometry images but the flux was too low to appear on this plot. Single dish observations of this line show no source at this position, as with the CO J=2-1. It is not surprising that this low-J CO does not fit the spherical envelope as it likely arises from the outflow.
The structure in the model fit around is due to two effects: the lines are optically thick below that point; and also we use a constant beam size of 20′′ for and use the actual Herschel beam size at higher .
The predicted CO emission from the envelope for is many orders of magnitude below the observed emission. This is not surprising as the volume within the protostellar envelope that exceeds 100 K is very small, with a radius of less than 400 AU. This radius corresponds to approximately 0.3′′ at the distance of NGC7129. With a typical Herschel beamsize of 10′′ for the CO lines, this hot region fills a small fraction (less than ) of the beam area. We explored other possible spherical envelope models using similar constraints to the Crimier et al (crimier (2010)) model. None of these alternate models have successfully produced a significant amount of CO emission in lines.
3.2 CO from other components within the YSO
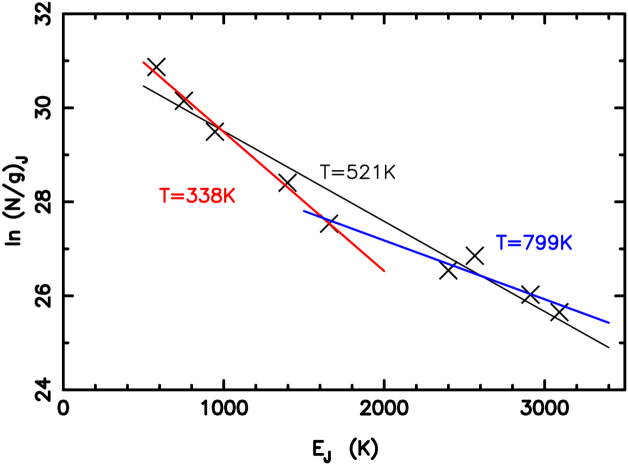
A quick analysis to gain some insight into the origin of the high- CO lines is to make a Boltzmann plot (shown as Figure 3 in on-line materials). A single temperature LTE component (best fit at 521K) did not fit well but two components, at temperatures of 338 K and 799 K, gave a satisfactory fit. However temperatures up to 1300 K were found to be consistent within the uncertainties in the data.
One possible source of the high- CO lines is a hot core. However, the size of such a hot core at the distance of N7129 is small. This hot core is equivalent to the hot inner part of the envelope described above: the size of any such core is very small (0.72” 0.52”) and has an upper temperature limit of 890 K (Fuente et al 2005a ), and thus the CO emission will be much too small to account for this emission.
A cavity within the envelope, presumably carved by the observed outflow, heated by UV photons could present a larger hot (T a few 100 K) area within the beam of the PACS observations (Spaans et al. 1995 spaans95 (1995), van Kempen et al. vankempen09 (2009)) Burton et al burton90 (1990) show that strong UV emission in clumpy photodissociation models can produce significant high-J CO emission but in virtually all of their models the mid-J CO lines are several orders of magnitude stronger than the high-J CO lines, unlike what we see in this object. However one of their models, the low UV field, high density, “high temperature solution” (there are two possible solutions) can produce high-J lines nearly as strong as the mid-J lines. The Burton et al models also predict very much stronger emission in lines near J=10-9, providing a test of whether or not this model applies to this object.
While UV heated cavity walls can likely produce the mid- CO line emission that we see (see the similar case for HH46, van Kempen et al vankempen10 (2010)), the highest- CO lines probably require still hotter (T 1,000 K) gas and we suggest that this gas is heated by non-dissociative shocks. Here we use the more general RADEX code (van der Tak et al vandertak07 (2007)) to model CO emitting slabs at the temperatures and densities which other studies have shown are appropriate for these mechanisms. A detailed analysis to explain the CO that considers many other issues will be carried out in a future paper.
Figure 2 shows the results of one such model (blue line). We present this as an illustration of how this CO emission can arise and stress this is not a fit to the data. Plotted in Figure 2 are the results from a RADEX model of the CO emission from a plane parallel slab with a kinetic temperature of 1100 K, an H2 density of cm-3, and a CO column density of cm-2. This temperature is similar to the one derived towards low-mass protostars by Neufeld et al neufeld09 (2009). The line width (10 km/s) does not affect the result at these low optical depths (typically in these CO lines). Note that, as with the envelope model, the emission is integrated over a beamsize of 15′′ for ; a beam area appropriate to the diffraction limited Herschel beam, is used up to . However for the higher lines (that do not appear in the envelope model) the PACS beam of 9.4′′ is used. The mass contained within the beam, assuming a CO abundance of , is negligible (of order M⊙).
3
This slab model provides a reasonable and simple first iteration fit to the observed CO fluxes. The highest- CO lines provide an excellent match between the observed and predicted fluxes. The observed fluxes of the mid- lines are much greater than the modeled fluxes, by a factor of eight for the first of these lines (=14-13). We have not found a single CO component that can match the observed flux from these three lines without simultaneously producing significantly too much flux in highest lines. It appears likely that at least two separate components are required within the current plane-parallel slab geometry in order to match all of the observed lines. With further calibration of the PACS instrument, the uncertainties in the observed line strengths are expected to diminish. As well, this source will be observed with HIFI as part of the WISH project. If the mid- CO lines observed are from shocks then HIFI observations should resolve the lines and show them to be broad. A more detailed consideration of the structure within the protostellar envelope will be best undertaken once these additional data and calibrations are available.
We defer a detailed discussion of the other molecules detected to future papers. The H2O data listed in this paper will be combined with recently obtained HIFI data in one of these future papers.
4 Conclusions
The principal result of these new observations by PACS is that the unexpected strength of the observed high excitation (high-) CO lines requires high temperatures as well as relatively high densities to be present in the immediate vicinity of NGC 7129 FIRS2. We have found a single component plane parallel hot slab can produce a reasonable fit to the highest- CO observations but a more complex solution is necessary to fit all the lines simultaneously, especially the mid- lines. This hot component may represent a UV photon heated inner wall of the outflow cavity or may be related to shocks associated with the outflow itself. In the future it may be possible to model all the CO emission using a self-consistent 2-D geometric shock and UV heating model as has been used in the interpretation of the observations of the low mass protostar HH46 (van Kempen et al vankempen10 (2010)), where similar highly excited CO emission is seen. HIFI observations will provide the higher spectral resolution needed to trace the kinematics of these structures.
Acknowledgements.
We thank Bruno Merin, Jeroen Bouwman, and Bart VandenBussche of the PACS ICC for all of their help with the data reduction. JC and AF thank theo Spanish MCINN for funding support under program CONSOLIDER INGENIO 2010 ref: CSD2009-00038, and JC, under programs AYA2006-14786 and AYA2009-07304. A portion of this research was performed at the Jet Propulsion Laboratory, California Institute of Technology, under contract with the National Aeronautics and Space Administration. This program is made possible thanks to the HIFI guaranteed time program and the PACS instrument builders. HIFI has been designed and built by a consortium of institutes and university departments from across Europe, Canada and the United States under the leadership of SRON Netherlands Institute for Space Research Groningen, The Netherlands and with major contributions from Germany, France, and the US. Consortium members are: Canada: CSA, U.Waterloo; France: CESR, LAB, LERMA, IRAM; Germany: KOSMA, MPIfR, MPS; Ireland: NUI Maynooth; Italy: ASI, IFSI-INAF, Osservatorio Astrofisico di Arcetri-INAF; Netherlands: SRON, TUD; Poland: CAMK, CBK; Spain: Observatorio Astronomico Nacional (IGN), Centro de Astrobiologia (CSIC-INT); Sweden: Chalmers University of Technology - MC2, RSS & GARD, Onsala Space Observatory, Swedish National Space Board, Stockholm University - Stockholm Obseratory; Switzerland: ETH Zurich, FHNW; USA: Caltech, JPL, NHSC.References
- (1) Arce, H.G., Shepherd, D., Gueth, F., et al, 2007, in Protostars and Planets V, ed. B. Reipurth, D. Jewitt, & K. Keil, 245
- (2) Burton, M.G., Hollenbach, D.J., & Tielens, A.G.G.M. 1990, ApJ, 365, 620
- (3) Crimier, N., Ceccarelli, C., Alonso-Albi, T., et al 2010, A&A, in press,
- (4) Fuente, A., Neri, R., Martin-Pintado, J., et al 2001, A&A, 366, 873
- (5) Fuente, A., Rizzo, J.R., Caselli, P., Bachiller, R., & Henkel, C. A&A, 433, 535
- (6) Fuente, A., Neri, R. & Caselli, P. 2005, A&A, 444, 481
- (7) Gianninni et al 1999, A&A, 346, 617
- (8) Hogerheijde, M. & van der Tak, F.F.S. 2000, A&A, 362, 697
- (9) Ivezic, Z., Nenkova, M., & Elitzur, M. 1999, User Manual for DUSTY, University of Kentucky Internal Report
- (10) Kaufman, M.J., Wolfire, M.G., Hollenbach, D.J., & Luhman, M.L., 1999, Ap.J.,
- (11) Miskolczi, B., Tothill, N.F.H., Mitchell, G.F., & Matthews, H.E. 2001, ApJ, 560, 841
- (12) Neufeld, D., Nisini, B., Giannini, T. et al 2009, ApJ, 706, 170
- (13) Nisini et al, 2002, ApJ, 574, 246
- (14) Pilbratt et al, 2010, A&A, this volume
- (15) Poglitsch et al, 2010, A&A, this volume
- (16) Shevchenko, V.S. and Yakubov, S.D. 1989, Soviet Astronomy, 66, 718
- (17) Shirley, Y.L., Evans, N.J., Rawlings, J.M.C., & Gregerson, E.M. 2000, ApJS, 131, 249
- (18) Spaans, M., Hogerheijde, M.R., Mundy, L.G., & van Dishoeck, E.F. 1995, ApJ, 455, 167
- (19) Terebey, S., Shu, F.H., and Cassen, P. 1984, ApJ, 286, 529
- (20) van den Ancker, 2000, A&A, 355, 194
- (21) Van der Tak, F.F.S., Black, J.H., Schöier, F.L., et al., 2007, A&A, 468, 617
- (22) van Kempen, T.A., van Dishoeck, E.F., Guesten, R., et al., 2009, A&A, 501, 633
- (23) van Kempen, T.A., Kristensen, L., Herzceg, G., et al., 2010, A&A, this volume