New Evidence for a Black Hole in the Compact Binary Cygnus X-3
Abstract
The bright and highly variable X-ray and radio source known as Cygnus X-3 was among the first X-ray sources discovered, yet it remains in many ways an enigma. Its known to consist of a massive, Wolf-Rayet primary in an extremely tight orbit with a compact object. Yet one of the most basic of parameters - the mass of the compact object - is not known. Nor is it even clear whether its is a neutron star or a black hole. In this Paper we present our analysis of the broad-band high-energy continua covering a substantial range in luminosity and spectral morphology. We apply these results to a recently identified scaling relationship which has been demonstrated to provide reliable estimates of the compact object mass in a number of accretion powered binaries. This analysis leads us to conclude that the compact object in Cygnus X-3 has a mass greater than thus clearly indicative of a black hole and as such resolving a long-standing issue. The full range of uncertainty in our analysis and from using a range of recently published distance estimates constrains the compact object mass to lie between and . Our favored estimate, based on a 9.0 kpc distance estimate is with the error margin of 3.2 solar masses. This result may thus pose challenges to shared-envelope evolutionary models of compact binaries, as well as establishing Cygnus X-3 as the first confirmed accretion-powered galactic gamma-ray source.
1 Introduction
The bright X-ray binary source known as Cygnus X-3 (herein Cyg X-3) was discovered over 40 years ago by Giacconi et al. (1967), and has been the subsequent focus of extensive study. It nonetheless remains enigmatic in that the nature of the compact object; a neutron star or black hole has not been unambiguously determined, its high-amplitude intensity and spectral variations in the X-ray and radio bands are not well understood, and its low-amplitude and featureless power-density spectrum does not resemble other known neutron star or black hole X-ray binaries, e.g. McCollough et al. (1999). Many of these unique attributes are due to the nature of the donor star, widely believed to be a Wolf Rayet (WR) star, e.g. van Kerkwijk (1992) . It is also the strongest radio source among X-ray binaries, with a quiescent flux mJy, a flux of 0.1 Jy flaring to several Jy in high-activity states. It has recently been detected in the 0.1-1-GeV domain with the Fermi Gamma-Ray Space Telescope (Abdo et al.,, 2009) and is thus among a small number of gamma-ray bright X-ray binaries. Its orbital period of 4.8 hours is typical for a low-mass binary, but its WR donor star could have a mass upwards of 30 M⊙, thus making it an extremely tight binary system, all the more so if the compact star is a black hole.
Distance estimates to Cyg X-3 range from 7.2 to 9.3 kpc; see details in Ling, Zhang & Tang (2009). Here we adopt the distance of 9 kpc, inferred from dust-halo scattering measurements (Predehl et al., 2000) however, we consider the full range of these distance determinations in evaluating the uncertainty of our result. Such a large distance means that it is viewed thorough many magnitudes of visual extinction. It is in addition likely to be enshrouded in the dense wind environment of the WR donor star. This combination of high local and Galactic line-of-sight column densities has rendered the usual photometric and spectroscopic techniques for deriving a binary solution intractable, and as a result, no reliable mass estimate for the compact has emerged. The local absorption has also limited conclusions based on X-ray spectroscopy, which may be further complicated by the presence of a synchrotron component associated with the radio and gamma-ray emission and the effects of Compton downscattering. While hard-to-soft spectral transitions suggestive of a black hole binary are evident, e.g. Hjalmarsdotter et al. (2009) they cannot always be easily reconciled within the context of familiar black-hole low-hard to high-soft state transition patterns, nor do they resemble neutron-star Z or atoll source spectral behavior. No pulsations are detected, which would be a clear signature of a magnetized neutron star, however, it is possible that pulsed (radio or X-ray) emission could be present in the system but unobservable due to the effects of dense ambient plasma. It is noted that this type of scenario has been proposed and is considered credible in explanation of another radio-loud, gamma-ray-bright X-ray binary LSI +61 303.
Previous estimates of the compact object mass based on a variety of methods have been attempted, but the results tend to be highly uncertain. For example Schmutz, Geballe and Schild (1996) employing IR spectroscopy obtained a likely mass in the range of with a best estimate of . Hanson, Still and Fender (2000) constructed a radial velocity curve from which derive a mass function of , which leads to a blackhole mass of less than but could still accommodate a neutron star depending on the true value of the binary inclination. Vilhu et al. (2009) assess orbital modulation of X-ray emission lines and find a most likely compact object masses between 2 and while Hjalmarsditter et al. (2008) estimate a black hole based on interpretation of color-luminosity diagrams.
Our approach involves a multi-epoch spectral analysis and assessment of the inferred parameters. Shaposhnikov & Titarchuk (2009) and Titarchuk & Seifina (2009), hereafter ST09 and TS09 respectively established well defined correlations between certain temporal and spectral parameters. Furthermore, these correlation curves observed in different sources exhibited differing patterns for different binaries, but that the variety of those patterns was limited, and thus scalable. Recently, the application of this method was extended to study of an another class of X-ray source, the ULX NGC 5408 X-1 (Strohmayer and Mushotzky 2009). That study resulted in tangible evidence for the existence of an intermediate mass object in that system.
The ubiquitous nature of these correlations led to the suggestion that the underlying physical processes leading to the observed variability properties are closely tied to the Comptonizing media. Furthermore, they vary in a well defined manner as the source makes a transition between spectral states. The fact that the same correlations are seen in many sources, which vary widely in both luminosity (and thus presumably with mass accretion rate) and spectral state, suggests a common set of underlying physical conditions. TS09 showed that in GRS 1915+105 the photon index monotonically increases with disk mass accretion rate, followed by saturation. The radio luminosity does not correlate with low frequency quasi-periodic oscillations or X-ray luminosity for the entire range of spectral states, from low-hard to high-soft through intermediate.
In this Paper we present the results of a broad-band multi-epoch spectral analysis of Cyg X-3, applied to a novel approach for compact object mass determination, using photon indexdisk mass accretion rate correlation first implemented by ST09. We compiled a data base of some 35 observations of Cyg X-3, primarily from the RXTE satellite, applied similar modeling methods, and studied the inferred parameter interdependencies. From the results of that analysis, we have applied the scaling laws derived in ST09 deriving an estimate of the compact object mass, which we find to be consistent with a black hole.
In §2 we briefly discuss our methodology for mass-determination, which is described in detail elsewhere. In §3 we describe our database compilation and analysis techniques, in §4 we present our results, draw comparison to similar results previously calibrated from objects with independent mass estimates, and in §5 we summarize our conclusions.
2 Data Analysis and Modeling
2.1 Data Selection
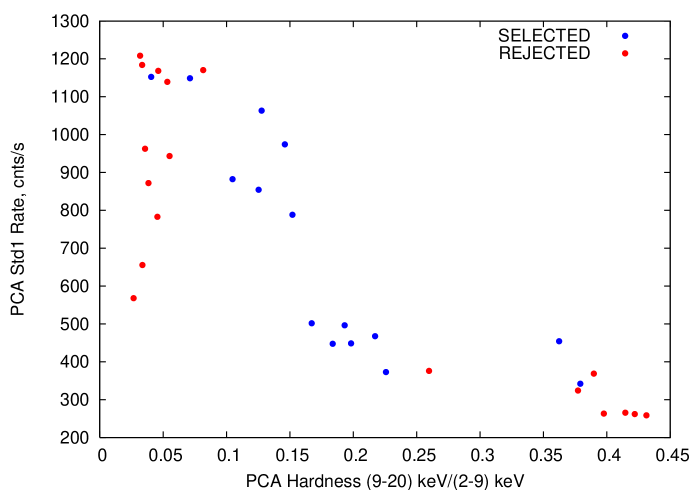
We extracted data from the HEASARC archives covering an approximately 9-year span starting at modified Julian day 50319 (where MJD=JD-2,400,000.5). RXTE was our primary database, but we also examined several epochs of INTEGRAL and BeppoSAX coverage as well, but ultimately chose to use the RXTE data almost exclusively in our final mass-estimation analysis. Some 35 spectra were examined, spanning a large range of hardness and intensity variations. Figure 1 depicts the distribution of these data in hardness-intensity space. As is well known, Cyg X-3 undergoes extreme spectral evolution the full range of which cannot be represented by a single model, e.g. Hjalmarsdotter et al. (2009). As we describe in detail in the next section, we found satisfactory fits to our model for the subset of the data which were not at the extreme range of Figure 1, i.e the very hard and very soft states of the system.
The data reduction and analysis was performed using current HEADAS software release (version 6.7) and the RXTE instrumental response file release in 2009, August. For our spectral analysis we use the PCA Standard-2 data mode and the Standard Archive HEXTE Mode. Standard dead time correction was applied to all spectra. Spectra were modeled using the XSPEC analysis package. We used approximate energy intervals of 3.0-30.0 keV and 20.0-200.0 keV for the PCA and HEXTE data correspondingly, although depending on the spectral and intensity state in question additional channel selection cuts were made as warranted. A systematic error of 1 percent was assumed to account for uncertainty of the absolute instrumental calibration. The stated uncertainties on spectral model parameters were calculated using 1- confidence interval.
2.2 Model Fitting
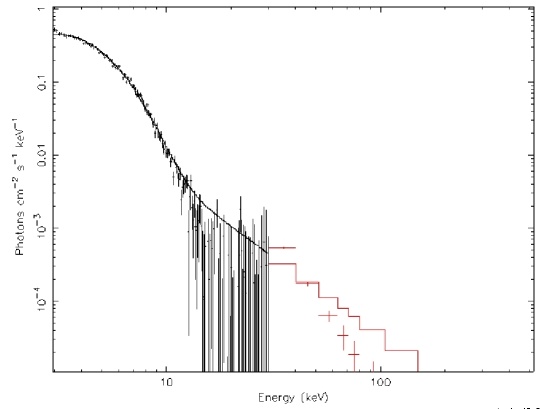
We examined each individual observation applying our spectral fitting model which we describe below. We note that in many instances, we were simply unable to achieve a satisfactory fit to the data. The complex variations of the local absorption are likely the underlying issue here, as has been pointed out by others; see e.g. Zdziarski et al. (2009). This is consistent at least with Figure 1, where the subset of the data we ultimately selected for our mass-determination analysis is depicted. The hardness-intensity space is roughly divided there into extreme-soft, moderate, and extreme hard spectral regimes. In the latter, the effects of Comptonization from the ambient plasma or from electron populations associated with a collimated outflow or with coronal electrons lead to spectral hardening. For the extreme soft case the hard powerlaw is very poorly constrained (or undetected). An example is depicted in Figure 2, which is based on an INTEGRAL observation. We note that although the soft-X-ray detector on INTEGRAL, JEM-X, is much less sensitive than the RXTE PCA, the IBIS hard X-ray detector is superior in the hard X-ray regime. Clearly the hard-powerlaw is not reliably determined. Furthermore, with the bolometric luminosity is strongly skewed to the keV regime, uncertainties in the flux and spectral shape due to absorption are substantial.
We do however obtain satisfactory fits to our model for a subset of about half of the observations studied. In these cases the reduced statistics are of order unity resulted and meaningful constraints on the key parameters of our model were achieved. These data are represented in the hardness-intensity space by the blue points in Figure 1, which span a range of about 0.1-0.35 in hardness defined by the ratio of PCA counts in the bands. The rationale for this selection is as follows. The extreme soft-state spectra cannot be used for index-mass accretion rate correlation. As noted, this is because these emergent spectra are a result of reprocessing of the emitted spectra in the optically thick cloud covering the central source. In this case, the entirety of information on the nature of the central source is lost. In the extreme hard-state case, we speculate that an additional Comptonization component associated with plasma ambient to the central accretion flow contributes to a hardening and curvature of the continuum above a 10 keV. This is counter to the basic converging inflow scenario we propose. The specific data sets included in our mass-determination analysis, along with the the inferred spectral parameters are enumerated in Table 1.
Our spectral model, consists of so called, the bulk-motion Comptonization (BMC) model; see Titarchuk, Mastichiadis & Kylafis (1997), hereafter TMK97, convolved with model corrections for (Galactic plus local) absorption, Fe Kα emission and absorption edge, and an exponential cutoff. The BMC model is a convolution an input thermal spectrum having normalization and color temperature with a Green’s function encoding the Comptonization process which is a broken power law. This approach is applicable to any type of Comptonization process The generic shape of a Comptonization Green function is a broken power law which is followed by exponential cutoff at energies higher than the kinetic energy of matter and it is independent of the type of Comptonization process, e.g. bulk or thermal. An example of our model fitted to the data is depicted in Figure 3.
As an aside note, this Green’s function technique is well suited to the analysis of a wide variety of problems, and has been applied for example to a description of the income distribution in financial analysis by Titarchuk, Laurent & Shaposhnikov (2009). The normalization is a ratio of the source luminosity to the square of the distance. The spectral index parameter of the model has been found to correlate approximately linearly with the normalization up to a saturation level, typically about 2.22.8, after which it flattens. For various sources the same effect is seen in photon index vs. quasi-periodic oscillation frequency (see ST09). Furthermore, the self-similar nature of an ensemble of observations can be related by scaling laws.
The resulting spectra are characterized by the inferred parameters related to the Comptonized fraction as and to a spectral index . There are several advantages of using the BMC model with respect to the more common approach, i.e. the application of an additive combination of a blackbody/multi-color-disk plus power-law/thermal Comptonization. First, by its nature, it is applicable to the general case of photon energy gain through not only thermal Comptonization but also via dynamic (bulk) motion Comptonization (see Shaposhnikov & Titarchuk, 2006, for details). Second, the BMC spectral shape has an appropriate low energy curvature, which is not the case with a simple additive power law. This is essential for a correct representation of the lower energy spectrum. This can lead for example to inaccurate column values and thus produce an non-physical component “conspiracy” involving the high-energy spectral cutoff and spectral-index parameterizations. Specifically, when a multiplicative component comprised of an exponential cutoff is combined with our model, the E-fold energies are in the expected range of greater than 20 keV. When it is applied to an additive model including a powerlaw, the cutoff can often extend below 10 keV, resulting in unreasonably low values for the inferred photon index. As a result, the implementation of such phenomenological models makes it much harder to correctly identify the spectral state of the source, which is a central task of our study. Additionally, a more important property of the model, is that it self-consistently calculates the normalization of the “seed” spectral component, which is expected to be a robust mass accretion rate indicator. We further note that the Comptonized fraction is properly evaluated by the BMC model.
3 Index Saturation and Black Hole Mass Determination
3.1 Basic Physical Motivation
We considered the Cyg X-3 spectra approximately resembling the galactic black-hole low-hard state (LHS) and intermediate state (IS) for the basis of our study; see e.g. McClintock & Remillard (2006). We note that only a small part of the disk emission component is seen directly. The energy spectrum is dominated by a Comptonization component very often approximated by a power law at energies above keV. To calculate the total normalization of the “seed” blackbody disk component we model the spectrum using the model described in the previous section. As detailed in section 2, we argue that the disk emission normalization calculated using this approach produces a more robust correlation than that one obtains using additive models.
3.2 Detailed Physical Interpretation
The presence of index saturation in various black-hole -ray binaries - Cyg X1, GRO J165540, GRS 1915105, GX3394, H 1743322, 4U 154347, and XTE J1650500 has been demonstrated previously (ST07, ST09, TS09). The self-similar evolutionary tracks of those analyses have led to black hole (BH) mass estimates which are generally in good agreement with dynamical determinations. The basic idea involves a Compton-scattering cloud. Its scale, temperature and optical depth regulate the nature of the emergent spectrum. We postulate that such a cloud is a natural consequence of an adjustment from a Keplerian flow to a turbulent, innermost sub-Keplerian boundary near the central compact object. This barrier ultimately leads to the formation of a transition layer between these regions. This interpretation predicts two phases or states dictated by the photon upscattering produced in the transition layer: (1) an optically thin and very hot (50 keV) medium producing photon upscattering via thermal Comptonization; the photon spectrum index for this state is dictated by gravitational energy release and Compton cooling in an optically thin shock near the adjustment radius; (2) an optically thick and relatively cool medium ( keV); the index for this state, 2.1 is determined by soft-photon upscattering and photon trapping in converging flow into the BH. Details are presented in ST09 and references therein.
3.3 Scaling Method
The scaling technique is based on the empirical correlation patterns observed during spectral transitions which effectively form a one-parameter space; the mass of the BH defines a specific correlation curve (ST07, ST09). After scalable state transition episodes are identified for two sources, the correlation pattern - for a reference transition is parameterized in terms of the analytical function in Eq. 1. By fitting this functional form to the correlation pattern, we find a set of parameters , , , , and that represent a bestfit form of the function for a particular correlation curve:
| (1) |
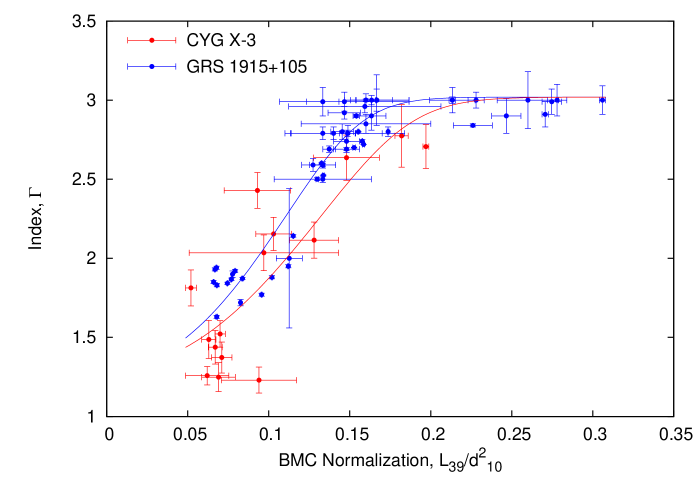
For , the correlation function converges to a constant value . Thus, is the value of the index saturation level, is the power-law index of the left-hand portion of the curve and is the value at which the index transitions, i.e. levels off. Parameter controls how smoothly the fitted function saturates to . We scale the data to a template by applying a transform until the best fit is found. We note, that the scaling fit to determine has to be performed with all the parameters describing the shape of the pattern fixed in order to comply with the pattern scalability requirement. We then use the data points of GRS 1915105, which has a reasonably good dynamical mass determination of , (Greiner, Cuby & McCaughrean, 2001), which is consistent with the value of of ST07. We adopt the latter value in our subsequent analysis. The reference data set is well represented by the function defined in equation (1). We then fit varying the parameters , , to best represent the GRS 1915+105 measurements. To test for self consistency we have used both the least-square and chi-squared statistical minimization methods to determine the best fit parameter values. The least-square method uses the values of index and normalization with equal weighting, while in the chi-square minimization the data are weighted by the inverse error square values. Because data points have different error bars due to different exposure, power law fraction, etc., and because the points can be clustered, the least-square method is less biased. Moreover, the chi-square method results in a very high reduced chi-square statistics due to large scatter in the data, which makes it less robust during the error calculation. We therefore select the least-squares method as our primary minimization technique. Parameters D and B are not well constrained by the data. We fix those parameters at 0.3 and 1.7 respectively based on our previous experience with correlation parameterization (ST09). For free parameters we obtain the following best-fit values with the least-square method: (saturation level), , . We then obtain the scale factor (see Fig. 4). We use this value for our BH mass calculations in Cyg X-3. We note that the scale factor obtained by the chi-square minimization approach, , leads to higher BH mass estimates. are consistent within uncertainties. In this sense the least-squares method we chose represents the more conservative of the two approaches. According to the scaling laws (see equations 8-9 in ST09), the expression for BH mass in Cyg X-3 is:
| (2) |
Using published mass and distance determinations for GRS 1915+105 of kpc (Greiner, Cuby & McCaughrean, 2001), (ST07) along with the value of determined in our least-squares analysis leads to a BH mass in Cyg X-3 of M⊙ and M⊙ for Cyg X-3 distance of 9.3 and 7.2 kpc respectively. In the above calculation we used as discussed below. Thus over the full range of parameters and uncertainties considered we cannot justify the mass of the X-ray star being less than 4 solar masses. This seems to rule out the possibility that a neutron star is the compact object in Cyg X-3. Accepting the recent distance estimate of 9.0 kpc ((Predehl et al., 2000)) we estimate a compact object mass of .
We note that the index-normalization method is subject to a several limitations that do not effect the index-QPO method. First, there is a dependence on the relative inclination angles of the binary system and that of the template system. Second, it is not always the case that self-similar patterns are seen in the data. For example, while our Cyg X-3 results were easily reconcilable with GRS 1915+105, the data could not be fit to an analogous template derived from XTE J1550-564. Finally, the relative source distances and geometry come into play, so that our mass determination is dependent on a factor . In the case of a spherical coronal geometry is unity. This is a reasonable approximation for the case of low-hard and intermediate spectral-state BHs. The ST09 results confirm that for most cases when the system inclinations are unknown the works very well. In the unlikely case of a flat disk geometry is the ratio of inclination angle cosines between a reference source and the target source.
4 Discussion
The implications our mass estimate of for the compact object mass is interesting in several regards. The formation of close massive black-hole binaries is a challenge for the theory of binary evolutionary, notably in cases with massive donor companions. Our result suggests that Cyg X-3 not only falls into that category, but with its remarkably short 4.8-hour period greatly exacerbates the problem. Other notable examples to date are IC10 X-1 (1.4-day period), which is the other case of a likely BH - WR binary and M33 X-7 which is believed to contain one of the most massive black holes, , known in a binary system orbiting a star with a 3.5 day period. Commonly accepted binary evolution models entail a common envelope mass transfer episode. This would naturally occur in massive short-period binary systems such as Cyg X-3. This makes the mechanism for the formation of a black hole with such a high mass very problematic. With the hr period, the system is so compact that the radius of the progenitor star must have been larger than the current separation between the stars. The BH progenitor must thus have experienced severe mass loss via Roche-lobe overflow. This however contradicts the clear need for a moderate mass-loss rate in order to achieve such a high black-hole mass. Explaining both the high mass of the black hole and the tight orbit simultaneously is difficult. Recently, it has been suggested that there may exist alternative stellar evolutionary paths, which avoid expansion during a core H-burning phase, and instead become more luminous and move blue-wards in the HR diagram. This would lead to the formation of a He burning core but with a chemically homogeneous outer envelope, e.g. de Mink et al. (2009). Such scenarios have also been suggested in the context of gamma-ray burst progenitors (Woosley & Heger, 2006).
Another aspect of our result is the implication that Cyg X-3 is the first confirmed accretion-powered black hole associated with a galactic gamma-ray source (Abdo et al.,, 2009). The other known gamma-ray binaries LS I 61+303, LS 5039 and PSR 1259-63 are either known (the latter) or suspected to be powered by wind-wind collision and/or propeller effects from a pulsar embedded in a massive stellar wind environment. Furthermore, Cyg X-3 is markedly different from these other systems in terms of its X-ray and radio luminosities, its high-amplitude episodic variability and its X-ray spectral energy distribution and spectral state changes. The Fermi data thus far obtained indicate that the gamma-ray episodes are anticorrelated with the hard X-rays and correlated with the soft X-rays (although not every X-ray light curve inflection leads to detectable gamma-rays). On the other hand, the radio emission is apparently correlated with the gamma rays; thus the radio turn-on or “jet line” of the usual ”q” diagram characterizing black-hole X-ray binaries manifests itself differently or may not be applicable in the case of Cyg X-3.
5 Conclusions
We have studied a large set of data covering a number of spectral-state transitions and intensity variations in the galactic binary Cyg X-3. We find that for about half of the 35 2-100-keV spectra analyzed the observations are well represented by our modeling approach - an absorbed BMC model including a iron line and edge components and a high-energy cutoff term. We then examined the correlation between the inferred photon indices of the Comptonized spectral component and the mass accretion rate, a proxy for which is the normalization term of our model. Based on those results we have applied the scaling method employing previously determined results for the well known Galactic binary GRS 1915+105 as a reference dataset. The calibration of our method for GRS 1915+015 is supported by the dynamical mass determination of Greiner, Cuby & McCaughrean (2001). This analysis led us to a lower-limit mass determination of about and a best-estimate value of assuming a 9.0 kpc distance. The previous success of this scaling method for the BH mass determination strongly supports our results for Cyg X-3.
Another result of our study is that a basic prediction of the theory of the converging inflow is supported by the observations of the index-mass accretion rate correlation seen in various black-hole X-ray binaries. Specifically, we argue that the spectral-index vs flattening, or saturation, seen is an observational signature of the presence of a converging inflow. The implication is that this effect provides robust observational evidence for the presence of a black hole in Cyg X-3.
References
- Abdo et al., (2009) Abdo. A. A. et al., 2009, Nature,
- de Mink et al. (2009) de Mink, S.E. et al. 2009, A&A, 507, L1
- Giacconi et al. (1967) Giacconi, R, Gorenstein, P., Gursky, H., & Waters, J. R. 1967, ApJ, 148, L119
- Greiner, Cuby & McCaughrean (2001) Greiner, J., Cuby, J.G., & McCaughrean, M.G. 2001, Nature, 414, 522
- (5) Hanson, M.M., Still, M.D., & Fender, R.P., 2000, ApJ, 541, 308
- Hjalmarsdotter et al. (2009) Hjalmarsdotter, L., Zdziarski, A.A., Szostek, A., & Hannikainen, D.C. 2009, MNRAS, 392, 251
- Ling, Zhang & Tang (2009) Ling, Z., Zhang, S.N. & Tang, S. 2009, ApJ, 695, 1111
- McClintock & Remillard (2006) McClintock, J. & Remillard, R. 2006, in Compact Stellar X-ray Sources, eds. W. H. G. Lewin & M. van der Klis (Cambridge: Cambridge Univ. Press), p. 157
- McCollough et al. (1999) McCollough, M. L. et al. (1999), ApJ, 512, 951
- Predehl et al. (2000) Predehl, et al. 2000, A&A, 357, L25
- Remillard & McClintock (2006) Remillard, R. A., & McClintock, J. E. 2006, ARA&A, 44, 49
- (12) Schmutz, W., Geballe, T.R., & Schild, H., 1996, A&A, 311, L25
- Shaposhnikov & Titarchuk (2009) Shaposhnikov, N., & Titarchuk, L. 2009, ApJ, 669, 453 (ST09)
- Shaposhnikov & Titarchuk (2007) Shaposhnikov, N., & Titarchuk, L. 2007, ApJ, 663, 445 (ST07)
- Shaposhnikov & Titarchuk (2006) Shaposhnikov, N., & Titarchuk, L. 2006, ApJ, 643, 1098 (ST06)
- Shrader & Titarchuk (1999) Shrader, C., & Titarchuk, L.G. 1999, ApJ, 521, L121
- Strohmayer & Muchotzky (2009) Strohmayer, T.E., & Mushotzky, R.F., 2009, ApJ, 703, 1386
- Titarchuk & Seifina (2009) Titarchuk, L. & Seifina, E. 2009, ApJ, 706, 1463
- Titarchuk, Laurent & Shaposhnikov (2009) Titarchuk, L., Laurent, P. & Shaposhnikov, N. 2009, ApJ, 700, 1831
- Titarchuk, Lapidus & Muslimov (1998) Titarchuk, L., Lapidus, I.I. & Muslimov, A. 1998, ApJ, 499, 315 (TLM98)
- Titarchuk, Mastichiadis & Kylafis (1997) Titarchuk, L., Mastichiadis, A., & Kylafis, N. D., 1997, ApJ, 487, 834
- Titarchuk & Shaposhnikov (2008) Titarchuk, L. & Shaposhnikov, N. 2008, ApJ, 678, 1230
- Titarchuk, Shaposhnikov & Arefiev (2007) Titarchuk, L., Shaposhnikov, N. & Arefiev, V. 2007, ApJ, 660, 556
- van Kerkwijk (1992) van Kerkwijk, M.H. et al. 1992, Nature, 355, 703
- Vilhu, Hannikainen, McCollough, & Koljonen (2009) Vilhu, O., Hannikainen, D.C., McCollough, M., & Koljonen, K., 2009, A&A, 501, 679
- Woosley & Heger (2006) Woosley, S. E. & Heger, A. 2006 ApJ, 637, 914
- Zdziarski et al. (2009) Zdziarski, A.A., Misra, R. & Gierlinski, M. 2009, MNRAS, in press [arXiv:0905.1086]
| Obs ID | MJD | Photon Index | Normalization |
|---|---|---|---|
| 20101-01-05-00 | 50612.46182 | 2.774 0.198 | 0.1817 0.0041 |
| 20101-01-01-00 | 50604.74825 | 2.706 0.138 | 0.1974 0.0018 |
| 20099-01-01-02 | 50500.75762 | 2.636 0.143 | 0.1483 0.0203 |
| 20099-01-01-01 | 50500.01207 | 2.429 0.113 | 0.0927 0.0205 |
| 20099-01-01-00 | 50495.01319 | 2.154 0.105 | 0.1032 0.0110 |
| 20101-01-08-00 | 50632.67880 | 2.115 0.114 | 0.1280 0.0151 |
| 40422-01-01-00 | 51404.43247 | 2.035 0.113 | 0.0966 0.0461 |
| 10126-01-01-03 | 50324.66181 | 1.813 0.114 | 0.0524 0.0033 |
| 10126-01-01-02 | 50322.25200 | 1.522 0.084 | 0.0696 0.0031 |
| 10126-01-01-05 | 50325.65911 | 1.487 0.120 | 0.0629 0.0044 |
| 10126-01-01-04 | 50323.65572 | 1.438 0.106 | 0.0673 0.0043 |
| 20099-02-01-00 | 50717.31225 | 1.373 0.098 | 0.0709 0.0063 |
| 30082-04-02-00 | 50950.94512 | 1.258 0.058 | 0.0622 0.0133 |
| 10126-01-01-01 | 50321.14285 | 1.249 0.091 | 0.0689 0.0104 |
| 20101-01-09-00 | 50652.62494 | 1.230 0.082 | 0.0936 0.0232 |