Herschel-PACS observation of the 10 Myr old T Tauri disk TW~Hya ††thanks: Herschel is an ESA space observatory with science instruments provided by Principal Investigator consortia. It is open for proposals for observing time from the worldwide astronomical community.
Planets are formed in disks around young stars. With an age of 10 Myr, TW~Hya is one of the nearest T Tauri stars that is still surrounded by a relatively massive disk. In addition a large number of molecules has been found in the TW~Hya disk, making TW~Hya the perfect test case in a large survey of disks with Herschel–PACS to directly study their gaseous component. We aim to constrain the gas and dust mass of the circumstellar disk around TW~Hya. We observed the fine-structure lines of [O I] and [C II] as part of the Open-time large program GASPS. We complement this with continuum data and ground-based 12 CO 3–2 and 13CO 3–2 observations. We simultaneously model the continuum and the line fluxes with the 3D Monte-Carlo code MCFOST and the thermo-chemical code ProDiMo to derive the gas and dust masses. We detect the [O I] line at 63 m. The other lines that were observed, [O I] at 145 m and [C II] at 157 m, are not detected. No extended emission has been found. Preliminary modeling of the photometric and line data assuming [12CO]/[13CO]=69 suggests a dust mass for grains with radius 1 mm of 1.9 10-4 M⊙ (total solid mass of 3 10-3 M⊙) and a gas mass of (0.5–5) 10-3 M⊙. The gas-to-dust mass may be lower than the standard interstellar value of 100.
Key Words.:
Circumstellar disks1 Introduction
Planets are formed in the disks that surround a large fraction of T Tauri stars. Knowledge of the gas mass available at different disk ages is essential to constrain giant planet formation models. Most studies estimate the dust mass from millimeter continuum emission and assume the gas mass is a factor of 100 times larger. This conversion factor has been calibrated for the interstellar medium but is likely not valid for disks, especially those that are evolving toward debris disks or where most of the gas has accreted onto the planetary atmosphere. Disk gas mass estimates derived from observations of 12CO and optically thinner 13CO emission are at least a factor of 10 lower than the mass derived from dust observations assuming the interstellar medium conversion factor. The discrepancy has been ascribed to CO photodissociation at disk atmosphere and freeze-out onto cold dust grains in the disk midplane (e.g., Qi et al., 2004; Thi et al., 2001). An alternative explanation is that the CO abundance is not different and the gas in disks has been depleted.
The PACS instrument (Poglitsch & al., 2010) on-board the Herschel Space Telescope (Pilbratt & al., 2010) makes it possible to observe lines from species that result from the photodissociation of CO (atomic oxygen and singly ionized carbon). With observations of all the major gas-phase carbon and oxygen-bearing species, we can more precisely constrain the disk gas mass.
At a distance of 56 pc (Wichmann et al., 1998), TW~Hya is one of the nearest classical T Tauri stars with an estimated age of 10 Myr (Barrado Y Navascués, 2006). Its proximity allows us to attain an order of magnitude higher mass sensitivity than objects in the Taurus molecular cloud. Fits to the spectral energy distribution (SED) provide an estimate of the gas disk mass of 6 10-2 M⊙ after applying a conversion factor of 75 (Calvet et al., 2002). This large disk mass at this advanced age is surprising as the median disk lifetime is only 2-3 Myr (Haisch et al., 2001). TW~Hya is considered a transition object with an optically thin inner cavity and an optically thick outer disk (Calvet et al., 2002; Ratzka et al., 2007). The fit to the SED also suggests that grains have grown to at least 1 cm.
The star TW~Hya was observed as a Science Demonstration Project object and is part of the Herschel-GASPS program (Dent & GASPS team, 2010). Herschel observations of the disk around the Herbig Ae star HD169142 are presented by Meeus et al. (2010). In this letter we use fine-structure lines in addition to continuum data and CO (sub)millimeter lines to directly constrain the gas mass and compare it to the dust mass derived from fits to the SED.

| Line | Cont. flux | Obs. | GH08 | M08 |
|---|---|---|---|---|
| (Jy) | (10-18 W m-2) | |||
| OI 3PP2 | 2.99 0.14 | 36.5 12.1 | 124-161 | 412 |
| OI 3PP1 | 7.00 0.05 | 5.5 | 25-41 | 11 |
| CII 2PP1/2 | 8.79 0.08 | 6.6 | 0.8-12 | 0.06 |
| CO 3–2 | n.a. | 0.43 | 0.3-0.6 | n.a. |
| 13CO 3–2 | n.a. | 4.4 10-2 | n.a. | n.a. |
2 Observations and results
We obtained photometry in the “blue” (70 m) and “red” (160 m) band of the PACS camera by doing mini scan maps with a scan speed of and a scan length of (obsid 1342187342). The total duration of this map was 731 sec, with an on-source time of 146 seconds. The results are 3.90 0.02 Jy and 7.38 0.04 in the blue and red band respectively and have an absolute accuracy estimated to be 5% for the blue channel and 10% for the the red channel. These values agree very well with the observed IRAS flux densities and also with the continuum flux densities measured with the PACS spectrometer (Table 1). We also used the PACS spectrometer to target the [OI] line at 63 m in line scan mode, and the [OI] and [CII] lines at 145 and 158 m, respectively in range scan mode (obsid 1342187127 PacsLineSpec and obsid 1342187238 PacsRangeSpec). Only the [OI] line at 63 m was detected and we report upper limits for the other two lines; see Table 1. The absolute accuracy of PACS spectroscopy is currently estimated to be about 40%, but is expected to improve in the future. Figure 1 shows the spectrum centered at the position of the OI line at 63 m of the central pixel.
| Fixed parameters | |||
|---|---|---|---|
| Inner cavity | Outer ring | ||
| Stellar mass | (M⊙) | 0.6 | |
| Stellar luminosity | (L⊙) | 0.23 | |
| Effective temperature | (K) | 4000 | |
| Solid material mass density | (g cm-3) | 3.5 | |
| Inner radius | (AU) | 0.25 | 4 |
| Outer radius | (AU) | 4 | 196 |
| ISM UV field | 1.0 | ||
| viscosity parameter | 0.0 | ||
| Turbulent velocity | (km s-1) | 0.05 | |
| Disk inclination | 7 | ||
| CO isotopologue ratio | [12CO]/[13CO] | 69 | |
| MCFOST best fit parameters | |||
| Column density index | 1 | ||
| Reference scale height | (AU) | 2.0 | 10.0 |
| Reference radius | 100 | 100 | |
| Flaring index | 0.6 | 1.12 | |
| Minimum grain size | (m) | 3 10-2 | |
| Maximum grain size | (cm) | 10 | |
| Dust size distribution index | 3.4 | ||
| Dust mass (1 mm) | (M⊙) | 1.2 10-9 | 1.9 10-4 |
| Solid mass | (M⊙) | 2.0 10-8 | 3.0 10-3 |
| ProDiMo parameter range | |||
| Disk gas mass | () | 3 10-4–0.3 | |
| UV excess | 0.018 | ||
| Fraction of PAHs w.r.t. ISM | 0.01, 0.1 | ||
| Cosmic ray flux | (s-1) | (1.7–17) 10-17 | |
3 Modeling and discussion
As there is no evidence for an outflow from TW~Hya, we assume that all the fluxes arise from the circumstellar disk (see also the discussion in Mathews et al. 2010). The interpretation of the observations with the DENT grid of models is detailed in Pinte et al. (2010). We performed a more detailed analysis here.
We first augmented the Herschel photometric data with continuum measurements from the literature. We also retrieved and reduced archival SCUBA data for TW Hya obtained during two nights with very good sub-millimeter transmission ((450 m)= 4.25 0.85 Jy and (850 m)= 1.38 0.14 Jy). The disk around TW~Hya has an internal cavity from up to 4 AU where the gas and dust density are very low. Most of the mass is located in the external ring. The inner () and outer radius () of the external ring are well constrained by imaging studies and are fixed at 4 AU and 200 AU respectively (Roberge et al., 2005; Qi et al., 2004; Hughes et al., 2007). We fitted the SED with the 3D Monte-Carlo radiative transfer code MCFOST (Pinte et al., 2006). We chose to restrict to a parametric disk model for this letter. The disk has a radial density profile with index . The flaring is characterized by an opening angle at a given radius and a flaring index so that the gas scale-height is given by . The low continuum flux in the 30–100 m region suggests that the outer disk flaring is weak. Amorphous olivine grains were used (Dorschner et al., 1995) with a power-law size-distribution defined by a minimum radius , maximum radius , and power-law index . The dust size-distribution and mass are well constrained by the continuum emission at long wavelengths. The fit to the long-wavelength photometric points including the new Herschel-PACS data is shown in Fig. 2 and the disk parameters constrained by the fit are listed in Table 2. The inferred dust mass in grains with radius 1 mm is =1.9 10-4 M⊙ and the total mass in solids (pebbles) up to cm is =3 10-3 M⊙. However, the fit fails to account for the flux at 25 m, which may stem from our assumption of a unique temperature for grains of all sizes. The flux around 20-30 m is strongly inclination-dependent because we adopted a sharp density change between the inner cavity and the outer ring at 4 AU. Solids as large as 10 cm in radius are needed to account for the observed 7 mm and 3.6 cm flux (Wilner et al., 2000). The small grains in the TW~Hya disk account for 6% of the total solid mass. We also estimated a mass in small grains of assuming that the emission in the millimeter is optically thin, an average dust temperature of 20 K, and grain opacity g cm-2 where GHz and (Beckwith & Sargent, 1991). The two estimates of dust mass (with radius 1mm) are consistent within a factor 2 with each other. The visibility amplitudes generated by the models are consistent with the observed amplitudes at 345 GHz by (Qi et al., 2004).
For the line observations we augmented the Herschel data with SMA CO 3–2 (Qi et al., 2004) and JCMT 13CO 3–2 observations (Thi et al., 2004). Following the characterization of the disk structure from the SED, we ran three series of models with the thermo-chemical code ProDiMo (a detailed description is given in Woitke et al., 2009). In ProDiMo species abundances are computed at steady-state from the gas, and dust temperature as well as the local UV field for the photodissociation reactions. A constant isotopologue ratio [13CO]/[12CO] of 69 is assumed. The gas kinetic temperature is computed by balancing heating and cooling processes. Line profiles are computed by non-LTE radiative transfer within ProDiMo. The disk is assumed to be passively heated. The disk turbulent velocity and inclination are well constrained by millimeter interferometric data (Qi et al., 2004). The outer disk is irradiated by direct and scattered stellar photons as well as by interstellar UV photons. The free parameters of the gas simulations are the disk gas mass (between 3 10-4 and 0.3 M⊙), the fraction of polycyclic aromatic hydrocarbons (PAHs) in the disk with respect to the interstellar abundance , and the cosmic ray flux (=1.7 10-17 s-1 in the ISM). Observations show that PAHs are depleted by at least a factor of 10 () in disks with respect to the interstellar abundance (Geers et al., 2006). Because the gas is mostly heated by photoelectrons ejected from PAH, the PAH abundance is the main free parameter that controls the gas temperature.

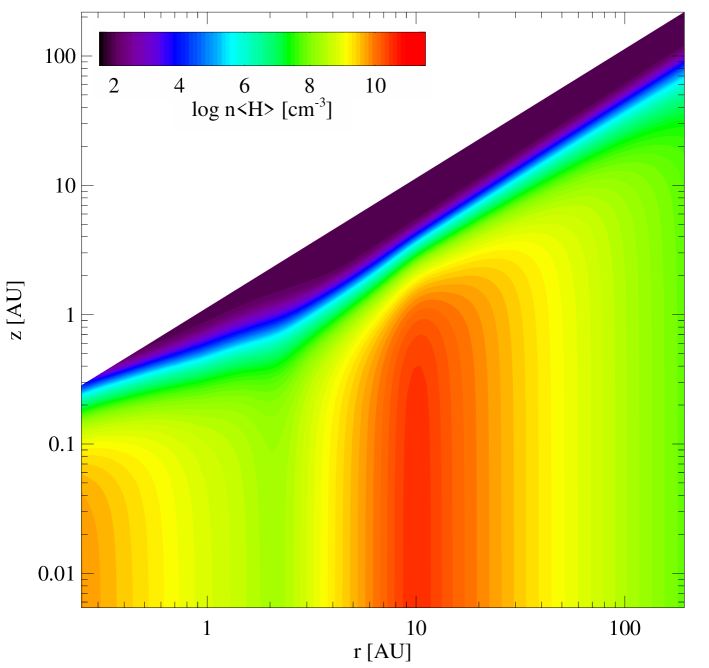
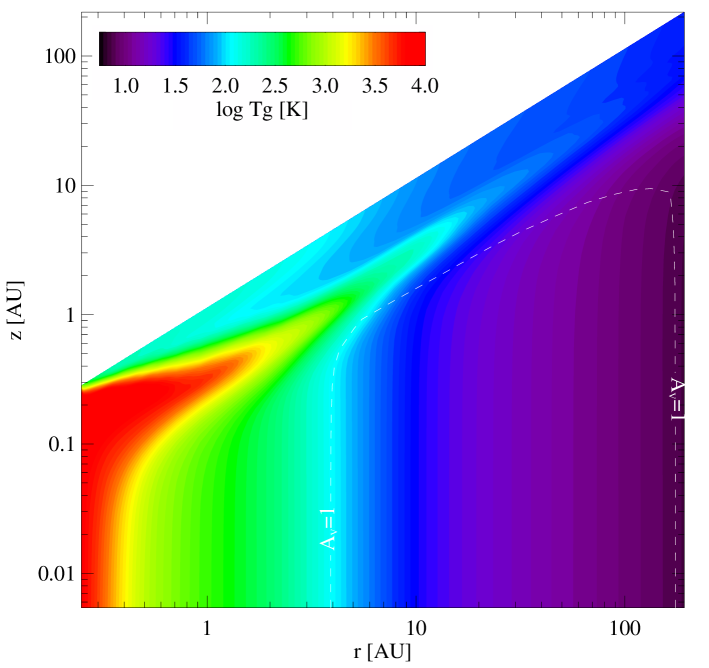
The three series of models correspond to three possible states: disks with a very low PAH abundance (), disks with a typical PAH abundance (), and X-ray irradiated disks with a low PAH abundance () but ten times the standard cosmic ray flux (=1.7 10-17 s-1) to mimic the influence of strong X-ray emission (Bruderer et al., 2009). The model results are plotted in Fig. 3. The density, dust and gas temperature structure are shown for a typical disk in the appendix. The results from series 3 are within 10% of the values of series 2, suggesting that X-ray does not influence the line fluxes that are emitted at radii beyond a few AU. In panels a and b we can see that the OI 63 m and 145 m flux increases with the disk gas mass. The OI 63 m line is optically thick while the OI 145 m line is optically thin for all models. Both lines arise mostly in a ring between 4 and 10 AU and thus probe the gas mass up to 10-20AU with 10–20% contribution from the inner cavity (panel f). In panel c the CII flux first starts to increase with higher disk gas mass but then plummets for disk gas masses greater than 10-2 M⊙. The CII line is optically thin and the flux increases with radius. As the disk becomes more massive, more carbon is converted into CO and the disk becomes cooler. Ionized carbon is excited in gas at 100 K. The CO 3–2 flux increases with increasing disk gas mass although the emission line is highly optically thick with 100 (panel d). CO 3-2 emission comes from the outer disk ( 50 AU). Finally, panel e illustrates the use of the line emission ratio between two isotopologues (12CO and 13CO) to constrain column densities or masses. The flux difference between the two isotopologues shrinks with increasing disk gas mass. The observed 12CO/13CO 3-2 ratio is consistent with a very low-mass disk. The CII and CO lines probe the outer disk mass (panel f). All together, the observations constrain the disk gas mass between 5 10-4 and 5 10-3 M⊙.

The modeling suggests that the disk of TW~Hya has a gas-to-dust mass ratio of 2.6–26, around a factor of 10 lower than the interstellar value. If we compare the gas mass to the total mass in solids (ie including solids with radii up to 10 cm), the gas-to-solid ratio is 0.17–1.7. Gorti & Hollenbach (2008, GH08) included X-ray and UV heating in modeling the disk of TW~Hya with a gas mass of 0.03 M⊙ but noticed that X-ray weakly influences the fluxes. Their model overestimates the two OI line fluxes (Table 1 and Fig. 3). Disk models with X-ray heating only also predict too strong OI fluxes (Meijerink et al., 2008, M08) for their model with =2 1030 erg s-1 scaled to =56 pc. At 10 Myr, TW~Hya is one of the oldest classical T Tauri stars. The outer dust disk is very long-lived, while the inner disk contains little amount of material. The gas may have a shorter lifetime than the dust due to photoevaporation or the small grains result from collisions between the large grains. TW~Hya is one of the strongest X-ray active T Tauri stars (Raassen, 2009), which may result in a high gas photoevaporation rate (Owen et al., 2010) as evidenced in the blueshifted [Ne II] emission observed by Pascucci & Sterzik (2009).
4 Conclusion
The Herschel-PACS spectral observations were used to constrain the gas disk mass surrounding the 10 Myr T Tauri star TW~Hya. We estimate the gas mass to be (0.5–5) 10-3 M⊙ compared to the dust mass ( 1mm) of 1.9 10-4 M⊙. The gas-to-dust mass ratio is 2.6–26, lower than the standard interstellar value of 100. The ratio gas-to-total-mass in solids is 0.17–1.7. Although the disk is still massive, a significant fraction of the primordial gas has already disappeared. A large fraction of the primordial gas may have been evaporated due to the strong X-ray flux from TW~Hya. TW~Hya is the first example where the disk gas mass around a transitional T Tauri star can be determined accurately and directly from gas phase lines. However, more detailed modeling that includes X-ray physics and 13CO photochemistry is needed to confirm the low gas mass.
Acknowledgements.
W.-F. Thi acknowledges a SUPA astrobiology fellowship. G. Meeus, C. Eiroa, J. Maldonado and B. Montesinos are partly supported by Spanish grant AYA 2008-01727. C. Pinte acknowledges the funding from the EC 7th Framework Program as a Marie Curie Intra-European Fellow (PIEF-GA-2008-220891). D.R. Ardila, S.D. Brittain, C.A. Grady, I. Pascucci, B. Riaz, G. Sandell and C. D. Howards, J.-P. Williams, G. Matthews, A. Roberge, W. Danchi acknowledge NASA/JPL for funding support. E. Solano and J.M. Alacid acknowledge the funding from the Spanish MICINN through grant AYA2008-02156. The LAOG group acknowledges PNPS, CNES and ANR (contract ANR-07-BLAN-0221) for financial support.References
- Barrado Y Navascués (2006) Barrado Y Navascués, D. 2006, A&A, 459, 511
- Beckwith & Sargent (1991) Beckwith, S. V. W. & Sargent, A. I. 1991, ApJ, 381, 250
- Brott & Hauschildt (2005) Brott, I. & Hauschildt, P. H. 2005, in ESA Special Publication, Vol. 576, The Three-Dimensional Universe with Gaia, ed. C. Turon, K. S. O’Flaherty, & M. A. C. Perryman, 565–+
- Bruderer et al. (2009) Bruderer, S., Doty, S. D., & Benz, A. O. 2009, ApJS, 183, 179
- Calvet et al. (2002) Calvet, N., D’Alessio, P., Hartmann, L., et al. 2002, ApJ, 568, 1008
- Dent & GASPS team (2010) Dent, W. R. F. & GASPS team. 2010, PASP
- Dorschner et al. (1995) Dorschner, J., Begemann, B., Henning, T., Jaeger, C., & Mutschke, H. 1995, A&A, 300, 503
- Geers et al. (2006) Geers, V. C., Augereau, J., Pontoppidan, K. M., et al. 2006, A&A, 459, 545
- Gorti & Hollenbach (2008) Gorti, U. & Hollenbach, D. 2008, ApJ, 683, 287
- Haisch et al. (2001) Haisch, Jr., K. E., Lada, E. A., & Lada, C. J. 2001, ApJ, 553, L153
- Hughes et al. (2007) Hughes, A. M., Wilner, D. J., Calvet, N., et al. 2007, ApJ, 664, 536
- Mathews et al. (2010) Mathews, G., Dent, W. R. F., Williams, J.-P., & GASPS team. 2010, A&A
- Meeus et al. (2010) Meeus, G., Pinte, C., Montesinos, B., & GASPS team. 2010, A&A
- Meijerink et al. (2008) Meijerink, R., Glassgold, A. E., & Najita, J. R. 2008, ApJ, 676, 518
- Owen et al. (2010) Owen, J. E., Ercolano, B., Clarke, C. J., & Alexander, R. D. 2010, MNRAS, 401, 1415
- Pascucci & Sterzik (2009) Pascucci, I. & Sterzik, M. 2009, ApJ, 702, 724
- Pilbratt & al. (2010) Pilbratt, G. & al. 2010, A&A
- Pinte et al. (2006) Pinte, C., Ménard, F., Duchêne, G., & Bastien, P. 2006, A&A, 459, 797
- Pinte et al. (2010) Pinte, C., Woitke, P., Ménard, F., & GASPS team. 2010, A&A
- Poglitsch & al. (2010) Poglitsch & al. 2010, A&A
- Qi et al. (2004) Qi, C., Ho, P. T. P., Wilner, D. J., et al. 2004, ApJ, 616, L11
- Raassen (2009) Raassen, A. J. J. 2009, A&A, 505, 755
- Ratzka et al. (2007) Ratzka, T., Leinert, C., Henning, T., et al. 2007, A&A, 471, 173
- Roberge et al. (2005) Roberge, A., Weinberger, A. J., & Malumuth, E. M. 2005, ApJ, 622, 1171
- Rucinski & Krautter (1983) Rucinski, S. M. & Krautter, J. 1983, A&A, 121, 217
- Thi et al. (2004) Thi, W., van Zadelhoff, G., & van Dishoeck, E. F. 2004, A&A, 425, 955
- Thi et al. (2001) Thi, W. F., van Dishoeck, E. F., Blake, G. A., et al. 2001, ApJ, 561, 1074
- Valenti et al. (2003) Valenti, J. A., Fallon, A. A., & Johns-Krull, C. M. 2003, ApJS, 147, 305
- Weintraub et al. (1989) Weintraub, D. A., Sandell, G., & Duncan, W. D. 1989, ApJ, 340, L69
- Wichmann et al. (1998) Wichmann, R., Bastian, U., Krautter, J., Jankovics, I., & Rucinski, S. M. 1998, MNRAS, 301, L39+
- Wilner et al. (2003) Wilner, D. J., Bourke, T. L., Wright, C. M., et al. 2003, ApJ, 596, 597
- Wilner et al. (2000) Wilner, D. J., Ho, P. T. P., Kastner, J. H., & Rodríguez, L. F. 2000, ApJ, 534, L101
- Woitke et al. (2009) Woitke, P., Kamp, I., & Thi, W. 2009, A&A, 501, 383
Appendix A Density and temperature structure
We show in Fig. 4, 5, and 6 the density, dust temeprature , and gas temperature profile respectively for a disk model with =2.9 10-3 M⊙, =0.1, and =1.7 10-17 s-1. All other parameters are given in Table 2.