email:rvoss@mpe.mpg.de
Probing the evolving massive star population in Orion with kinematic and radioactive tracers
Abstract
Context. Orion is the nearest star-forming region that hosts a significant number of young and massive stars. The energy injected by these OB stars is thought to have created the Eridanus superbubble. Because of its proximity, Orion is a prime target for a detailed investigation of the interaction between massive stars and their environment.
Aims. We study the massive star population of Orion and its feedback in terms of energy and mass, in order to compare the current knowledge of massive stars with kinematic and radioactive tracers in the surrounding interstellar medium (ISM).
Methods. We assemble a census of the most massive stars in Orion, then use stellar isochrones to estimate their masses and ages, and use these results to establish the stellar content of Orion’s individual OB associations. From this, our new population synthesis code is utilized to derive the history of the emission of UV radiation and kinetic energy of the material ejected by the massive stars, and also follow the ejection of the long-lived radioactive isotopes 26Al and 60Fe. In order to estimate the precision of our method, we compare and contrast three distinct representations of the massive stars. We compare the expected outputs with observations of 26Al gamma-ray signal and the extent of the Eridanus cavity.
Results. We find an integrated kinetic energy emitted by the massive stars of 1.8 erg. This number is consistent with the energy thought to be required to create the Eridanus superbubble. We also find good agreement between our model and the observed 26Al signal, estimating a mass of of 26Al in the Orion region.
Conclusions. Our population synthesis approach is demonstrated for the Orion region to reproduce three different kinds of observable outputs from massive stars in a consistent manner: Kinetic energy as manifested in ISM excavation, ionization as manifested in free-free emission, and nucleosynthesis ejecta as manifested in radioactivity gamma-rays. The good match between our model and the observables does not argue for considerable modifications of mass loss. If clumping effects turn out to be strong, other processes would need to be identified to compensate for their impact on massive-star outputs. Our population synthesis analysis jointly treats kinematic output and the return of radioactive isotopes, which proves a powerful extension of the methodology that constrains feedback from massive stars.
Key Words.:
Stars: abundances, early type, winds, outflows – ISM: abundances – Gamma rays: ISM1 Introduction
At a distance of only some 400 pc, the Orion region is sufficiently close that it enables us to study its stellar population and interstellar-gas morphology in detail. The massive star ( 8) population is dominated by the Orion OB1 association, which includes four subgroups labelled a-d (Brown et al. 1994). Their ages have been estimated to range between 1 and 12 Myr. OB1 is located on the near side of the densest part of the Orion Molecular clouds (Maddalena et al. 1986), facing the Eridanus cavity which extends from these molecular clouds towards the Sun. H features, which coincide with a hole in the HI distribution (Heiles 1976), together with X-ray emission near HI features (Burrows et al. 1993) outline this large interstellar cavity, and provide evidence for the interactions between the hot gas in the Eridanus cavity and the neutral surrounding interstellar medium (Bally et al. 1991). Many different names are used for the various substructures of Orion. We use the same convention as Bally (2008) in his recent review.
Feedback from massive stars plays a crucial role in the formation of stars, as it is shaping the ISM and its subsequent star formation activity. The main feedback originates from the ejection of matter from massive stars through their winds and supernova explosions, and from their intense emission at short wavelengths into the UV. This UV radiation creates large photoionized regions around the stars, and the kinetic energy associated with ejection of stellar matter pushes at the ISM, together creating large shells and cavities (e.g. Heiles 1976; van der Hucht 1987; Leitherer et al. 1992; Maeder & Conti 1994). Kinetic energy output and UV radiation of massive stars were studied in Voss et al. (2009), discussing the total emission from a population of stars with emphasis on the differences between various alternative stellar models. It was found that the kinetic energy from winds dominates over the supernova contribution, when integrated over the first 10 Myr after the stars were formed (see also Leitherer et al. 1999). This is due to the high wind velocities (taken from Howarth & Prinja 1989; Lamers et al. 1995) and high mass-loss rates of the most massive stars (Castor et al. 1975) and (Vink et al. 2000), even when modest wind clumping (with clumping factors of about 5) is accounted for (Repolust et al. 2004; Mokiem et al. 2007). To understand the complex interplay between the massive stars and their local environment, which eventually result in the evolution of disks in galaxies, it is necessary to first create a census of the radiation, energy, and matter output of individual nearby star-forming regions like Orion, which can be validated in terms of observational constraints.
The radioactive isotope 26Al provides an interesting independent view on the interaction between young stars and the surrounding environment. It is traced by its -ray decay line at 1808.63 keV, which can be observed with -ray telescopes. With a mean lifetime of 1 Myr 26Al is a long-term tracer of nucleosynthesis from populations of massive-star sources, as they eject it after synthesis in stellar cores and the supernova itself (Prantzos & Diehl 1996). Typically, massive stars eject a few of 26Al through their winds and supernovae (SN) (see e.g. Limongi & Chieffi 2006). From -ray observations, the total mass of 26Al in the Milky Way is estimated to be 2.80.8 (Diehl et al. 2006). Measurements of the 26Al emission from Orion by the COMPTEL instrument on NASAs Compton observatory generally confirms this scenario, with a -ray intensity of 7.5 10-5 ph cm-2 s-1 (Diehl 2002). The map of this 26Al -ray emission, though not significant in its details, shows an interesting offset of the 26Al emission from the massive stars that are believed to the the source of the 26Al, and the emission appears rather extended (Diehl 2002). This suggests that the radioactive ejecta stream into the nearby Eridanus cavity from their stellar association sources. A similar tracer would be the isotope 60Fe, observed in the Galaxy globally by its 1173 keV and 1333 keV decay lines (Smith et al. 2005; Harris et al. 2005; Wang et al. 2007). This isotope is presumably created in neutron capture reactions in late shell burning stages of such massive stars, and is also emitted in the supernova explosions (Limongi & Chieffi 2006). 60Fe has a mean lifetime of 3.6 Myr (Rugel et al. 2009). It has not been seen from the Orion region, which is however not surprising, as its -ray intensity has been found to be 15% of the 26Al -ray intensity only.
In this paper we analyze the energy and radioactive-isotope output from the entire stellar content of the Orion region. We compare the results with observational constraints, such as the measured strength of the 1808.63 keV line from 26Al decay and the size of the Eridanus superbubble.
2 The massive-star content of Orion
Star formation in the Orion region is distributed over a number of distinct groups. We concentrate our analysis onto the 5 most massive groups, which are the 4 subgroups of the Orion OB1 association (Blaauw 1964):
-
•
OB1a is located to the northwest of Orion’s Belt region.
-
•
OB1b defines the belt region itself. It contains three O stars, Ori and Ori, which together with the B star Ori form Orion’s belt, and Ori as another prominent member.
-
•
OB1c partially overlaps with OB1b, extending from the Belt to the end of Orion’s Sword. One O star, Ori, the brightest star in the Sword, also belongs to this group.
-
•
OB1d is also called the Orion Nebular Cluster. It contains two O stars, Ori (Trapezium) and Ori.
-
•
Ori. This group is often not included in the lists of associations with OB stars in Orion. However, it is located near the OB1 association, at the Head of Orion, and at approximately the same distance. We therefore include it in our study. It contains a single O star, Ori, after which the association is named.
From published data we investigate the properties of each of these 5 groups individually. The results constitute assumptions used in our analysis, and are summarized in table 1.
The inventory of massive stars above 2 in the OB1 associations was analyzed in Brown et al. (1994), who estimated a total of 610 stars in the four groups, with similar numbers 200 in OB1a,b and c. In their table 4, they list the numbers of stars found and the mass ranges probed in the three groups. We combine these with the Salpeter mass function to estimate the total initial number of stars in each group. This gives a total of 420 stars, only of the result of Brown et al. (1994), who used a much steeper initial mass function. OB1d was found to host 145 stars more massive than 1 (Hillenbrand 1997), making it the smallest of the 4 OB1 subgroups, and Ori contains stars above a mass of 2.5 (Dolan & Mathieu 2001). For comparison we convert these numbers into the 2-120 range using the Salpeter (1955) mass function.
The ages and distances of the individual clusters vary somewhat between publications, and are not yet agreed on in the community (see e.g. the recent reviews of Bally 2008; Muench et al. 2008; Walter et al. 2008; Mathieu 2008; Briceño et al. 2008). However, most agree that the 4 associations form a sequence in age and distance, with OB1a being the oldest and nearest and OB1d the youngest and most distant (although in the study of Brown et al. 1994, OB1b is significantly younger than OB1c). While there are large uncertainties in the absolute distances to the groups, the relative distances are much better understood, and it is therefore very unlikely that they are all at the same distance. This is due to the fact that the systematics affecting the distances are the same for the four regions. For a compilation and thorough discussion of the distance studies, see Muench et al. (2008). The picture is complicated by the partial overlap of the groups and the possibility that they themselves consist of several distinct subgroups with different ages and distances (see e.g. Hardie et al. 1964; Warren & Hesser 1977; Guetter 1981; Gieseking 1983; Genzel & Stutzki 1989). In the following work we adopt a distance of 410 pc to OB1d as an average of the three recent determinations of Hirota et al. (2007); Sandstrom et al. (2007); Menten et al. (2007), see e.g. the review of Muench et al. (2008), which is also consistent with the results of Jeffries (2007). OB1c is slightly closer than the OB1d group, which places it at a distance of 400 pc (Muench et al. 2008). For OB1b we adopt a distance of 360 pc (Brown et al. 1994), and for OB1a a distance of 330 pc (Briceño et al. 2005, 2007). We note that other relatively recent determinations find distances almost 100 pc further away for some of the subgroups (see discussions in the reviews mentioned above), and that disagreement between different methods is significantly above the typical 10% errors. We adopt a distance of 450 pc to Ori (Dolan & Mathieu 2001).
It is clear that Orion OB1a is the oldest of the groups with an age of 8-12 Myr (Blaauw 1964; Warren & Hesser 1977; Brown et al. 1994; Briceño et al. 2005). OB1d, where star formation is still underway, is clearly the youngest group consisting of stars with ages 0-2 Myr (Brown et al. 1994; Hillenbrand 1997). The remaining three groups have intermediate ages, but their exact ages are challenging to estimate. There are too few very high-mass stars to estimate correctly the main sequence turn-off mass, and the lower-mass stars have not evolved significantly. Age estimates for OB1b ranges from 1.7 Myr (Brown et al. 1994) to 8 Myr (Blaauw 1964), see e.g. Table 1 in Caballero (2007). The age of OB1c is reported to be in the range 3-6 Myr(Blaauw 1964; Warren & Hesser 1977; Brown et al. 1994), and Ori is comparable to the OB1b and OB1c clusters at approximately 6 Myr (Dolan & Mathieu 2001). It is thus not clear that there is any significant age difference between these three groups.
| Association | Stars | Age (rotating) | Age (non-rotating) | Stars | Distance | |
|---|---|---|---|---|---|---|
| OB1a | 160 | 12 Myr | 10 Myr | 18.5 | 7.3 | 330 |
| OB1b | 120 | 5.5 Myr | 4.6 Myr | 45 | 1.3 | 360 |
| OB1c | 140 | 5.5 Myr | 4.6 Myr | 45 | 1.5 | 400 |
| OB1d | 60 | 1 Myr | 1 Myr | 120 | 0 | 410 |
| Ori | 60 | 5.5 Myr | 4.6 Myr | 45 | 0.65 | 450 |
2.1 The currently most massive stars
Previous studies of the ages of the stellar groups have focused mainly on less massive stars, due to their much larger numbers. Also the strong winds from these stars make them more challenging to analyze, as line blanketing effects have to be taken into account, which has only recently become possible to do in detail. However, it is not clear if massive stars arrive at the zero-age main sequence at exactly the same time as less massive stars. We therefore compile a list of recent determinations of the properties of the most massive stars in the Orion region, to analyze the ages and masses of the stars. The advantage of using these stars is that unlike lower mass stars, they move significantly in the diagram on a timescale of Myrs. Given a set of evolutionary models, one can therefore derive a relatively precise evolutionary age even if the observational errors are large. On the other hand, the theoretical evolution of these massive stars is still poorly understood, and assumptions to derive and from observations introduce relatively large errors. For the Orion OB1 associations, we include the stars listed in Brown et al. (1994), whereas Dolan & Mathieu (2001) was used for Ori.
Orion hosts 7 O stars altogether. Their properties were analyzed in previous studies, using photometric data interpreted using local thermodynamic equilibrium (LTE) models (Kurucz 1992) that were not corrected for line-blanketing. The results provided by such analysis are, however, very unreliable for massive stars. We therefore derive new properties based on spectroscopy rather than photometry, and using line-blanketed non-LTE models rather than LTE: We use the recent catalogue of Maíz-Apellániz et al. (2004) to identify the spectral types of the O stars. We then use the line-blanketed models of Martins et al. (2005) to estimate their effective temperatures (using the observational scale), luminosities and surface gravities. We increased the sample by adding the two very bright B stars ( Ori A and Ori) from Searle et al. (2008). For the Orion Nebula Cluster a more detailed study of the five most massive Trapezium stars was performed by Simón-Díaz et al. (2006), and we use their results for these five stars.

| Association | HD | Name | Spectral type | Mass (Spec) | Mass (current) | Mass (Initial) | Age |
|---|---|---|---|---|---|---|---|
| OB1b | 36486 | Ori A | O9.5II | 17.1 | 21.1 | 21.4 | 5.6 |
| OB1b | 37468 | Ori A | O9.5V | 15.9 | 19.5 | 19.6 | 3.8 |
| OB1b | 37742 | Ori A | O9.7Ib | 20.3 | 30.9 | 34.3 | 5.5 |
| OB1b | 37128 | Ori A | B0Ia | 45.5 | 34.6 | 40.8 | 5.7 |
| OB1c | 37043 | Ori A | O9III | 19.7 | 26.2 | 27.3 | 5.2 |
| OB1c | 38771 | Ori | B0.5Ia | 27.3 | 28.0 | 31.8 | 6.2 |
| OB1d | 37022 | Ori C | O7Vp | 44.8 | 34.7 | 35.5 | 1.8 |
| OB1d | 37041 | Ori A | O9V | 27.5 | 24.0 | 24.1 | 2.2 |
| OB1d | 37020 | Ori A | B0.5V | 12.8 | 16.1 | 16.2 | 2.4 |
| OB1d | 37023 | Ori D | B0.5V | 18.4 | 17.7 | 17.7 | 0.6 |
| OB1d | 37042 | Ori B | B0.5V | 9.5 | 13.4 | 13.4 | 0.0 |
| Ori | 36861 | Ori A | O8III | 38.8 | 34.0 | 37.0 | 4.2 |

In figure 1 the stars are shown in an plot, where they are compared to four different sets of stellar evolutionary tracks and isochrones, with (upper panels and lower left panel) and without (lower right panel) including the effects of rotation. Stellar models including rotation are taken from Meynet & Maeder (2005) and the models without inclusion of rotation from Meynet et al. (1997); Schaller et al. (1992); Limongi & Chieffi (2006). From this plot the masses and ages of the individual stars can be derived. The masses implied for the stars do not vary significantly between the models, but a systematic shift in ages between the non-rotating and the rotating models is apparent. For the stars in groups OB1b,c and Ori, the average stellar age is 0.8 Myr higher for models including rotation than for the ones without, whereas the five stars in group OB1d are on average Myr younger for the models with rotation. There are no significant differences between the results obtained from the three different non-rotating models. The results for the models including rotation are given in table 2.
For many decades O-star research has been subject to a severe mass discrepancy (e.g. Herrero et al. 1992), where spectroscopic masses (derived from log g) and evolutionary masses (derived from the luminosity, and the mass-luminosity relation) were highly discrepant, in some cases by more than 50%. Here we re-investigate this issue for Orion’s massive star population (see figure 2). It is comforting to notice that there no longer appears to be any significant mass-discrepancy.
It is clear that properties of the massive stars in the groups OB1b-d and Ori are consistent with ages of a few Myr, whereas there are no very massive stars in OB1a, in agreement with a higher age of 10 Myr. The 4-5 Myr ages of the stars in OB1bc and Ori fall approximately in the middle of the age estimates derived from the less massive stars, with no evidence for the much lower age of 1.7 Myr for OB1b found by Brown et al. (1994). The most massive star in OB1d is found to be the youngest. The stars in OB1d are all consistent with an age below 2 Myr.
In table 1 we summarize the assumptions on the different stellar groups as we use them in the following. We emphasize that there are considerable uncertainties on the numbers given in table 1, which should be evident from the discussion above and from figure 1. As the numbers are gathered from a large number of sources with varying assumptions and methodology, and many of these lack reliable estimates of the uncertainties, we have not included error estimates in the table. However, in the following analysis, we do estimate the sensitivity of our results to our assumptions.
2.2 The population of B stars
We also compile a list of stars with masses between 8 and 20 for each of the 5 subgroups (from Brown et al. 1994; Dolan & Mathieu 2001; Hernández et al. 2005), and assign the assumed average age per group. We note that the use of Kurucz (1992) atmosphere models in these earlier studies is not quite appropriate for these relatively massive stars, so that the uncertainty on these estimates increases significantly. However, as the output of kinetic energy, matter, and UV radiation from these B stars is relatively small, compared to the more massive O-type stars, this is not important for our study. As the study of Brown et al. (1994) does not give the masses of stars, we calculate these from:
| (1) |
where , and are their given surface gravities, effective temperatures and luminosities per star, and and are the gravitational and the Stefan-Boltzmann constants. For the stars present in both the Brown et al. (1994) and Hernández et al. (2005) study we use the former to identify the membership of the stellar associations, while we consider the masses given by Hernández et al. (2005) to be more precise. Only two stars differ in masses by more than 30% between the two catalogues: HD 35439 and HD 37756, which have masses of 34.3 and 8.8 from Brown et al. (1994) and 11.3 and 13.8 in Hernández et al. (2005). For two stars that are only present in the catalogue of Brown et al. (1994), we find unrealistically high masses given their spectral types. These are HD 41335 and HD 37061 for which masses of 42.2 and 50.7 are found, with spectral types B2Vne+ and BIV. A number of the stars given in table 2, as well as HD 35439 mentioned above, also have unrealistically high masses in that study; we ascribe this to the very high observational uncertainties, and assign both stars a mass of 15 in our sample. The final list of stars in the 5 regions is given in table 3.
| Association | HD | HIC11footnotemark: 1 | Mass | Mass Ref22footnotemark: 2 |
|---|---|---|---|---|
| OB1a | 35007 | 25028 | 8.2 | H |
| OB1a | 34748 | 24847 | 8.3 | H |
| OB1a | 35912 | 25582 | 8.5 | H |
| OB1a | 35762 | 25493 | 8.6 | H |
| OB1a | 36351 | 25861 | 9.0 | H |
| OB1a | 35575 | 25368 | 9.0 | H |
| OB1a | 36741 | 26098 | 9.3 | H |
| OB1a | 35777 | 25480 | 9.4 | H |
| OB1a | 35299 | 25223 | 9.9 | H |
| OB1a | 36166 | 25751 | 10.0 | H |
| OB1a | 37490 | 26594 | 11.1 | B |
| OB1a | 35439 | 25302 | 11.3 | H |
| OB1a | 35149 | 25142 | 11.4 | H |
| OB1a | 35411 | 25281 | 11.9 | B |
| OB1a | 35715 | 25473 | 13.1 | H |
| OB1a | 35039 | 25044 | 13.3 | H |
| OB1b | 36827 | 26120 | 8.1 | H |
| OB1b | 36779 | 26106 | 8.5 | H |
| OB1b | 37674 | 26683 | 9.7 | H |
| OB1b | 37744 | 26713 | 9.7 | H |
| OB1b | 37776 | 26742 | 10.0 | H |
| OB1b | 37903 | 26816 | 10.1 | H |
| OB1b | 36695 | 26063 | 12.5 | H |
| OB1b | 37479 | 0 | 12.7 | B |
| OB1b | 36591 | 25980 | 13.6 | H |
| OB1b | 37756 | 26736 | 13.8 | H |
| OB1c | 37040 | 26257 | 8.3 | H |
| OB1c | 36629 | 26000 | 8.4 | B |
| OB1c | 39291 | 27658 | 8.4 | B |
| OB1c | 37209 | 26345 | 8.6 | B |
| OB1c | 37334 | 26442 | 8.9 | H |
| OB1c | 38051 | 26908 | 9.2 | H |
| OB1c | 36959 | 26197 | 9.4 | B |
| OB1c | 39777 | 27929 | 9.6 | H |
| OB1c | 37303 | 26427 | 11.0 | H |
| OB1c | 37018 | 26237 | 11.4 | B |
| OB1c | 35337 | 25202 | 11.6 | B |
| OB1c | 37481 | 26535 | 11.6 | B |
| OB1c | 37356 | 26477 | 11.8 | H |
| OB1c | 33328 | 23972 | 12.7 | B |
| OB1c | 37017 | 26233 | 14.6 | H |
| OB1c | 0 | 0 | 15.0 | B |
| OB1c | 36960 | 26199 | 16.4 | B |
| OB1c | 36512 | 25923 | 16.8 | B |
| OB1c | 41335 | 28744 | 15.0 (42.2) | B |
| OB1d | 36982 | 0 | 8.6 | B |
| OB1d | 37061 | 26258 | 15.0 (50.7) | B |
| Ori | 37232 | 0 | 9.3 | D |
| Ori | 34989 | 0 | 11.9 | D |
| Ori | 36822 | 0 | 17.9 | D |
2.3 The total population of massive stars
In addition to the observed stars, a number of massive stars are expected to have formerly existed in the Orion region, and exploded as supernovae in the last 10 Myr. Knowing the age of an individual region and the number of stars in a given (lower) mass range, one can calculate the expected number of higher-mass stars using a distribution function for initial masses (IMF). In table 1 we list the expected number of exploded stars for each of the groups, assuming a Salpeter IMF (Salpeter 1955).
To test consistency of our inferred stellar content of the groups with observations, we compare the source lists to the values listed in table 1. We add up the number of individual stars above 8 in table 2, table 3 and the expected number of exploded stars from table 1: a total of 62 stars is obtained, while 70 are expected from applying the Salpeter mass function to the numbers of stars above 2 in table 1 (excluding the 11 stars that are expected to have exploded). We note that the lower mass limits of the star counts in Brown et al. (1994) are relatively high () and therefore possible errors due to deviations from the Salpeter law below are small, The extrapolation of the star counts from Hillenbrand (1997); Dolan & Mathieu (2001) are more uncertain as the lower mass limits in these studies were 1 and 2.5 . The upper mass limit depends on the assumed ages of the associations and stellar evolution models. However, the expected number of massive stars is not sensitive to this limit, due to the relatively small fraction of stars at the massive end of the IMF.
The only group where the number of stars in our list is significantly different from the IMF-expected value is Ori, where 4 stars above 8 are observed, whereas 7.8 are expected. We note that the mass estimates in (Dolan & Mathieu 2001) are imprecise for the massive stars due to inappropriate atmosphere models used, and that several stars are estimated just below the 8 limit. Another source of bias arises from us using the number of observed OB stars within to estimate the richness of the group: a significant fraction of these could be unrelated to the group, inappropriately scaling up the group richness.
As our list is compiled from various sources, applying different selection criteria and analyses, it is not appropriate to use it to estimate the mass distribution function. Nevertheless, we checked if our assumed Salpeter initial mass function is compatible with our stellar data: We sort the observed sources into 4 mass bins, and compare to expectations from a Salpeter and a Scalo IMF. For simplicity the Scalo IMF has been normalized to have the same normalization at as the Salpeter IMF, instead of deriving the normalization from the star counts of the individual associations. The results are shown in table 4. Only in the bin the difference is significant, and within uncertainties we consider both a Salpeter IMF and a Scalo IMF adequate to represent the overall data.
3 Outputs from the massive stars
We investigate the ejection of matter, of 26Al and 60Fe, and the UV emission from the stellar groups in Orion, using the population synthesis method developed by Voss et al. (2009). Due to the proximity of Orion, the populations of stars are relatively well-known, as described above. We discuss three approaches to calculate the outputs from the stars in star-forming regions, comparing the results. In the first approach, the Orion stellar population is described by three parameters: the total number of stars, the average stellar age, and the age spread. The second (refined) approach models each of the 5 subgroups separately with these three parameters. In the third method, we directly use the observed massive stars with their parameters, together with estimates of those that have already exploded as supernovae.
In our population synthesis, stellar-evolution tracks are evaluated/interpolated to find the mass loss and kinetic energy from the stellar winds as a function of time. The supernova contribution is added as stellar evolution terminates, assuming a canonical ejection energy of erg. The UV emission versus time is found from matching stellar atmosphere models with the stellar parameters at a given time. In addition to calculating the cumulative stellar outputs for the entire population, we estimate the statistical deviations, caused by the random sampling of the IMF. Discussions of the shape of the distributions caused by this can be found in Cerviño & Luridiana (2006); Voss et al. (2009); Gounelle et al. (2009). We compare two ways: An analytical formula developed by Cerviño & Luridiana (2006), and Monte Carlo sampling. Our method was found consistent both with results from the Starburst99 code (Leitherer et al. 1999; Vazquez & Leitherer 2005), and with the results of a similar but different population synthesis implementation by Cerviño et al. (2000).
In Voss et al. (2009) different stellar-model inputs were analyzed and compared. In the following, we use three different stellar models, in order to represent the possible spread from theoretical predictions.
- •
- •
-
•
LC06: The stellar-evolution models and supernova yields of Limongi & Chieffi (2006).
For all three models we use stellar-wind velocities according to wind08 (Lamers et al. 1995; Niedzielski & Skorzynski 2002) and the atmosMS (Kurucz 1992; Martins et al. 2005; Smith et al. 2005) stellar atmosphere models.

We compare three different models for Orion’s stellar population:
-
I.
Orion as one cluster: This corresponds to how we would have to model more distant star-forming regions, where less information is available on the individual groups. Given the estimated numbers of stars in each group from table 1, the whole region is expected to have 81 stars above 8 . Results from a flat star-formation rate over the last 12 Myr are compared to a model in which the star-formation rate is Gaussian with a peak 6 Myr ago and with dispersion of 3 Myr, where we truncate the Gaussian at 2 .
-
II.
Orion as five groups: Here we treat the 5 (4) separate groups individually. For each of the groups we use the parameters from table 1, and assume a Gaussian star-formation rate with a dispersion of 1 Myr, again truncated at 2.
-
III.
Using the observed stars: In this model we use the observed stellar parameters directly, together with estimates of the stars that have already exploded as supernovae. We use the derived stellar masses directly (for the stars in table 2 we use the masses derived from the rotating stellar evolution models), but assign each star the average age of the association. The most massive stars are generated randomly from IMF extrapolation, as above.


4 Results
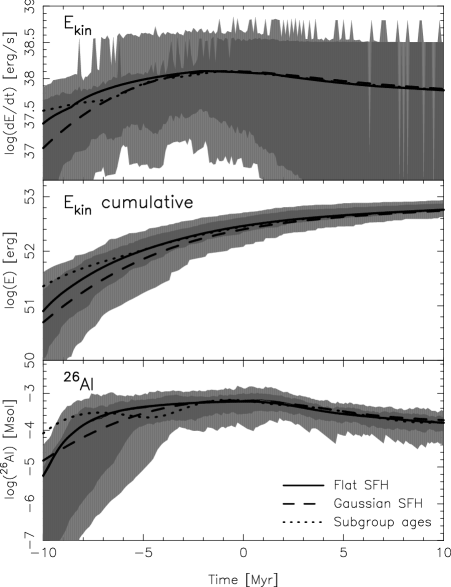
When comparing models of star-forming regions to observations, it is important to understand how our incomplete understanding of the regions may affect such comparison. Often, the star formation history is poorly constrained, but may be important considering the relatively short timescales of interest of Myr. In figure 3 we show the time profiles of kinetic energy ejection from the stellar winds and supernova explosions and of the interstellar mass of 26Al. Lines show the three different star formation histories described in section 4: flat (model I), Gaussian (model I) and the separate ages for each subgroup (model II). The results of all three models are surprisingly similar: Values for the current and future times are the same within 10%. Some differences appear in the past values, increasing towards the time of formation of subgroup OB1d (12 Myr ago). We conclude that the properties investigated in this paper are not sensitive to the exact star formation history for regions with ages above 5-6 Myr, and they cannot be used to constrain earlier star formation, accordingly. Shaded areas in figure 3 show the 1 (dark grey) and 2 (light grey) statistical variations. These are derived through random sampling of the mass function (see e.g. Cerviño & Luridiana 2006), and are large because both the kinetic energy of the winds and the ejection of 26Al strongly depend on the ZAMS mass of the stars. It is clear that these variations are larger than the uncertainties in the star formation history. We note that the lines indicate the average values, and that these probability distributions are strongly asymmetric for small numbers of stars (see Voss et al. 2009).
In figure 4 we compare the results of three different stellar evolution models and supernova yields, that are considered representative of the spread in theoretical predictions. For all three models the subgroups were modelled individually (model II). A spread in current values of % can be seen, yet much smaller than the statistical variation. The main differences at early times are between the stellar evolution models including rotation and the ones without, with both more energy and 26Al being ejected from the stars in their wind phases than from their supernovae. This difference is mainly caused by two effects: the somewhat higher ages of the sub-groups inferred by the stellar models including rotation (e.g. the 2 Myr higher age of subgroup OB1a) and the enhanced wind ejection caused by stellar rotation.
The current output is dominated by the OB1b,c and Ori subgroups. At their current age () they still contain very massive stars, but the most massive stars have exploded relatively recently. OB1a is old enough to not have any stars above left and is therefore mainly contributing in the current epoch with supernova output, whereas OB1d is so young that most stars have not developed strong Wolf-Rayet winds yet and no supernovae has exploded, so overall contributions are small. In figure 5 we show the time profiles of the emission of kinetic energy and ionizing photons, and the amount of 26Al and 60Fe present in the surrounding ISM, with the relative contributions from the individual subgroups. Some differences between the behaviour of the different outputs can be noted. For example, the UV radiation from subgroup OB1a has become totally insignificant, as this is linked to the most massive stars, whereas the energy and isotope ejection from supernovae still plays a role. In contrast, subgroup OB1d currently emits a high fraction of the total ionizing UV radiation, and some kinetic energy and 26Al, but no 60Fe, which is only ejected by supernovae.
The results show clearly that for star-forming regions with massive () stars, the random sampling of the initial mass function limits the physical interpretation of observations. For the stars still present today, the actual masses of the observed stars were used (model III). The solid line in Fig. 6 represents their outputs and appears jagged, from actual statistical sampling. This is in contrast to the already exploded stars, where the average output is inferred based on the IMF. In this case spikes caused by supernova explosions are smeared out due to our lack of knowledge of the actual sampling. Clearly exploded stars dominate the past history of the cluster, whereas the unexploded stars dominate the future. The figure also shows that the current state of the system is mainly determined by the exploded stars. While the observations of stars are important for understanding the stellar population of star-forming regions, they can not be used to reduce the effects of the random sampling of the IMF significantly.
The choice of IMF may have some impact on the results. In Voss et al. (2009) the contribution of the different parts of the mass function to the time profiles of , UV radiation and 26Al and 60Fe were discussed (see their Fig. 13). The Scalo mass function would decrease the number of stars above 80 by a factor of and the in the range by %. This will significantly delay and flatten the peaks of the time profiles of the individual groups. Our results for groups OB1b,c and Ori will be affected. The results for these groups are currently dominated by the stars in the range, and the values predicted by our models should therefore be lowered by 30-40%. OB1a is old enough to be in the regime dominated by lower mass stars (15-30 range), where the number of stars does not differ much between the two mass functions. The total content of massive stars in OB1d is known and evaluated without any IMF consideration.
5 Comparison with observations
We compare our model predictions against three observables which characterize feedback in the Orion region: the kinetic energy as manifested in ISM excavation, the ionization resulting from UV output, and the radioactive materials -ray luminosity.
The envelopes of the massive stars are ejected through stellar winds and supernova explosions at typical velocities of a few 1000 km s-1 (Woosley et al. 1995), and this energy creates large cavities around OB associations. The flows of supernova ejecta inside cavities can be very complex (MacLow et al. 2005), and the propagation might be dominated by turbulent diffusion from magnetic field irregularities caused by the stellar winds and supernovae (Parizot et al. 2004; Balsara & Kim 2005). The Eridanus cavity is a typical example of a cavity in the ISM, created by the cumulative and sustained action of massive stars in the Orion OB1 association. This interpretation is consistent with the age determinations of the OB1 subgroups and the cavity found by Brown et al. (1995), who also estimated the energy required for creating the Orion-Eridanus bubble to be approximately erg. Our population synthesis model yields a total of erg with % coming from OB1a and the rest from OB1b,c. OB1d has not yet broken out of the surrounding medium and Ori is not connected to the Eridanus bubble. Our population synthesis results are therefore in agreement with these observations.
The total flux of the free-free radio continuum emission can be used as an observable reflecting the total Lyman continuum luminosity of a region. As Orion covers a very large area of the sky ( Deg2) only a part of it has been measured by radio telescopes. Observations of the Greater Orion Nebula (M42) covering the most luminous parts of Orion OB1d, report radio luminosities in the 1-25 GHz band of 300-500 Jy (Felli et al. 1993; van der Werf & Goss 1989). This translates to a emission of hydrogen ionizing photons of ph s-1 (Condon 1992). This is significantly smaller than our estimate of ph s-1 on average. However, the UV output is strongly dependent on the most massive star in a cluster, making it highly sensitive to small-number statistics. Indeed the number of observed massive stars in OB1d is significantly smaller than that from a population synthesis view, and thus the UV radiation is statistically very uncertain and almost unconstrained, with a 1-sigma confidence interval of 3-4 ph s-1. The absence of stars more massive than 45 in OB1d indicates that the UV radiation should be well below the population-synthesis predicted average found by integrating over the entire mass function. Indeed an integration over the expected output from the observed stars yield an ionizing UV output of ph s-1. With a leakage of 25%-50% of the ionizing photons, similar to what has been inferred in the Carina region (Smith & Brooks 2007) this number would agree well with the radio continuum observations. Therefore, we do not consider this a significant discrepancy between predicted and observrd ionizing energy.
The COMPTEL -ray telescope has mapped the all sky distribution of the 26Al decay line at 1.809 MeV emission over 9 years of observations. The results for the Orion region are presented in Diehl (2002). Depending on the spatial model, the emission from the Orion region is found at a confidence level of , and a total flux of ph cm-2 s-1 is found. This corresponds to a mass of of 26Al at a distance of 400 pc, in good agreement with the results shown in figure 3. Calculating the emission separately for the 5 groups and taking into account their individual distances, we get an expected flux of ph s-1 from the OB1 association, in good agreement with the observations.
A map of the observed signal, although limited by the total signal weakness, shows 26Al emission in the Orion region, with a main peak consistent with the position of Orion OB1, and extended emission towards lower latitudes, suggestively aligned with the direction of the Orion-Eridanus bubble. Nearly all the flux is coming from the OB1b,c groups which are producing equally strong signals. A modest addition of ph s-1 is expected to come from Ori, which was not included in the observational analysis.
6 Summary and discussion
We analyzed the population of massive stars in the nearby star-forming Orion region, including the four OB1 subgroups (a-d) and the Ori group. We analyzed the stellar contents of the individual groups, providing updated lists of the stars more massive than 8 . Ages of the individual groups were constrained based on comparison between the updated properties of the most massive stars and stellar isochrones. Based on these results, we performed a study of the ejection of kinetic energy and radioactive elements from the young massive stars in Orion. We showed that the current state of the region only depends modestly on the properties of the model, such as the star formation history and the stellar evolution models. Main uncertainties are due to the unknown population of very massive stars that exploded over the past 10 Myr.
The population synthesis results were compared to the energy needed to form the Eridanus superbubble, the emission of hydrogen ionizing photons, and the intensity of the 1.809 MeV line from the decay of 26Al, showing good agreement between our model estimates and the observations. The 26Al observations provide a valuable tracer of the population of (now not any more observable) stars and thus of the cumulative action of massive star groups, and of the kinematics of the outflows from the massive stars.
Our current understanding of stellar evolution and supernova models is far from complete. Different models often rely on similar assumptions. Showing consistency between models and observations is important, as it supports confidence that the most important effects are accounted for in models. We have employed different models for characterizing the Orion region’s stellar population, and for the stellar-evolution inputs to population synthesis. The results show that the observed properties of the Orion region are consistent with these models. Differences among models are smaller than the statistical effects caused by the relatively small number of massive stars.
Some recent UV studies (Bouret et al. 2003; Fullerton et al. 2006) have called for a more fundamental mass-loss rate reduction, invoking clumping factors up to 100, much higher than the currently favoured values of , and mass-loss rate reductions of order 10. However, other studies cast doubt on these conclusions based on theoretical studies of ”macro-clumping” (Oskinova et al. 2007; Sundqvist et al. 2010) and emission in the extreme UV band (Waldron & Cassinelli 2010). As we find good agreement between our population synthesis and the observations of Orion, this could either suggest that our mass-loss rates are realistic (and the very large clumping factors exaggerated), or alternatively that some unknown process is also missing in the stellar models. However, we note that the wind and supernova contributions to the interstellar 26Al have not been disentangled observationally, and models with weak winds to some degree compensate for the low 26Al wind yields by having larger core masses and therefore producing higher supernova yields (see discussion in Limongi & Chieffi 2006), and the production of 26Al in high-clumping models have not yet been explored. On the other hand, we emphasize that our models are in simultaneous agreement with both the kinematic and the radioactive tracers, which would be hard to achieve with models involving very large clumping factors.
The Galaxy contains hundreds of regions of massive star-formation. It is important to extend our approach to other regions in order to overcome the issue of small-number statistics, and to further test our models. Unfortunately, many such regions are either significantly less well studied than Orion, due to larger distances and obscurance from the foreground, or they only contain modest numbers of high-mass stars. Recent studies of the relatively small, but nearby Scorpius-Centaurus region (Diehl et al. 2010) and the more distant but very massive Cygnus region (Martin et al. 2009) have been reported, and show overall agreement between the observations and models, both regarding the energetics of the regions and the 26Al signal. A further candidate target is the Carina region (Smith 2006), hosting a large population of very young and very massive stars. Due to the small age, the supernova contribution to the 26Al signal in this region is expected to be low. A comparison between Orion and Carina 26Al signal could therefore potentially constrain the relative wind and supernova contributions, similar to what has been done in the Cygnus region (Martin et al. 2009).
Radioactive tracers are a valuable addition to the arsenal of probes of star formation in the Milky Way. -ray observations have the potential to yield information that is complementary to observations at other wavelengths. They are emitted on a timescale of Myr after star formation, and with similar decay timescales, they trace the cumulative action of very young stars in the Milky Way. As the -rays are unaffected by extinction, the observations of 26Al and 60Fe have the potential to give a complete view of the star formation in the Milky Way, unaffected by the obscuring effects of the molecular clouds. Using nucleosynthesis ejecta, we can expand the studies of past activity from stellar groups substantially. Instrument sensitivities of current -ray telescopes limit such studies to the brightest, hence most-nearby regions. A next generation of instruments (Greiner et al. 2009) could reach hundreds of massive-star regions, thus significantly extending such studies. As discussed in Voss et al. (2009) the correlation between 26Al and 60Fe can potentially eliminate much of the uncertainty due to small-number statistics. The lifetimes of the radioactive tracers are long enough that they can be carried to significant distances from the massive stars that produced them. The COMPTEL observations of Orion (Diehl 2002) provide a hint of such displacement. On the other hand the lifetimes are short enough that the radioactive elements are not uniformly mixed into the ISM. They are therefore valuable tracers of the mixing processes in the vicinity of star forming regions.
Acknowledgements.
This research was supported by the DFG cluster of excellence ’Origin and Structure of the Universe’ (http://www.universe-cluster.de).References
- Bally et al. (1991) Bally, J., Langer, W.D., Liu, W., 1991, ApJ, 383, 645
- Bally (2008) Bally, J. 2008, Handbook of Star Forming Regions, Volume I: The Northern Sky ASP Monograph Publications, Vol. 4. Edited by Bo Reipurth, p.459, 459
- Balsara & Kim (2005) Balsara, D.S. & Kim, J., ApJ, 634, 390
- Barlow et al. (1981) Barlow, M.J., Smith, L.J., Willis, A.J.,1981, MNRAS, 196, 101
- Blaauw (1964) Blaauw, A. 1964, ARA&A, 2, 213
- Bouret et al. (2003) Bouret, J.-C., Lanz, T., Hillier, D. J., Heap, S. R., Hubeny, I., Lennon, D. J., Smith, L. J., & Evans, C. J. 2003, ApJ, 595, 1182
- Briceño et al. (2005) Briceño, C., Calvet, N., Hernández, J., Vivas, A. K., Hartmann, L., Downes, J. J., & Berlind, P. 2005, AJ, 129, 907
- Briceño et al. (2007) Briceño, C., Hartmann, L., Hernández, J., Calvet, N., Vivas, A. K., Furesz, G., & Szentgyorgyi, A. 2007, ApJ, 661, 1119
- Briceño et al. (2008) Brice, C. 2008, Handbook of Star Forming Regions, Volume I: The Northern Sky ASP Monograph Publications, Vol. 4. Edited by Bo Reipurth, p.838, 838
- Brown et al. (1994) Brown, A. G. A., de Geus, E. J., & de Zeeuw, P. T. 1994, A&A, 289, 101
- Brown et al. (1995) Brown, A. G. A., Hartmann, D., & Burton, W. B. 1995, A&A, 300, 903
- Burrows et al. (1993) Burrows, D.N., Singh, K.P., Nousek, J.A., Garmire, G.P., Good, J., 1993, ApJ, 406, 97
- Caballero (2007) Caballero, J. A. 2007, A&A, 466, 917
- Castor et al. (1975) Castor, J.I., Abbott, D.C., Klein, R.I., 1975, 195, 157
- Cerviño & Luridiana (2006) Cerviño, M., & Luridiana, V., 2006, A&A, 451, 475
- Cerviño et al. (2000) Cerviño, M., Knödlseder, J., Schaerer, D., von Ballmoos, P., Meynet, G., 2000, A&A, 363, 970
- Condon (1992) Condon, J. J. 1992, ARA&A, 30, 575
- Diehl (2002) Diehl, R. 2002, New Astronomy Review, 46, 547
- Diehl et al. (2006) Diehl, R., Halloin, H., Kretschmer, K., et al., 2006, Nature, 439, 45-47
- Diehl et al. (2010) Diehl, R., et al., in preparation.
- Dolan & Mathieu (2001) Dolan, C. J., & Mathieu, R. D. 2001, AJ, 121, 2124
- Felli et al. (1993) Felli, M., Churchwell, E., Wilson, T. L., & Taylor, G. B. 1993, A&AS, 98, 137
- Fullerton et al. (2006) Fullerton, A. W., Massa, D. L., & Prinja, R. K. 2006, ApJ, 637, 1025
- Genzel & Stutzki (1989) Genzel, R., & Stutzki, J. 1989, ARA&A, 27, 41
- Gieseking (1983) Gieseking, F. 1983, A&A, 118, 102
- Gounelle et al. (2009) Gounelle, M., Meibom, A., Hennebelle, P., & Inutsuka, S.-i. 2009, ApJ, 694, L1
- Greiner et al. (2009) Greiner, J., et al. 2009, Experimental Astronomy, 23, 91
- Guetter (1981) Guetter, H. H. 1981, AJ, 86, 1057
- Hardie et al. (1964) Hardie, R. H., Heiser, A. M., & Tolbert, C. R. 1964, ApJ, 140, 1472
- Harris et al. (2005) Harris, M.J., Knödlseder, J., Jean, P., et al., 2005, A&A, 433, 49
- Heiles (1976) Heiles, C., 1976, ApJ, 208, L137
- Hernández et al. (2005) Hernández, J., Calvet, N., Hartmann, L., Briceño, C., Sicilia-Aguilar, A., & Berlind, P. 2005, AJ, 129, 856
- Herrero et al. (1992) Herrero, A., Kudritzki, R. P., Vilchez, J. M., Kunze, D., Butler, K., & Haser, S. 1992, A&A, 261, 209
- Hillenbrand (1997) Hillenbrand, L. A. 1997, AJ, 113, 1733
- Hirota et al. (2007) Hirota, T., et al. 2007, PASJ, 59, 897
- Howarth & Prinja (1989) Howarth, I.D., Prinja, R.K., 1989, ApJS, 69, 527
- van der Hucht (1987) van der Hucht,K.A., Williams, P.M., The, P.S., 1987, QJRAS, 28, 254
- Jeffries (2007) Jeffries, R. D. 2007, MNRAS, 376, 1109
- Kurucz (1992) Kurucz, R.L., 1992, in IAU Symp. 149: The Stellar Populations of Galaxies, 225
- Lamers & Morton (1976) Lamers, H.J.G.L.M., Morton, D.C., 1976, ApJS, 32, 715
- Lamers et al. (1995) Lamers, H.J.G.L.M., Snow, T.P., Lindholm, D.M., 1995, ApJ, 455, 269
- Leitherer et al. (1992) Leitherer, C., Robert, C., Drissen, L., 1992, ApJ,401, 596
- Leitherer et al. (1999) Leitherer, C., Schaerer, D., Goldader, J.D., et al., 1999, ApJS, 123, 3
- Limongi & Chieffi (2006) Limongi, M., Chieffi, A., 2006, ApJ, 647, 483
- Maddalena et al. (1986) Maddalena, R.J., Morris, M., Moscowitz, J., Thaddeus, P., 1986, ApJ 303, 375
- MacLow et al. (2005) MacLow, M., Balsara, K., Kim, J., de Avillez, M.A., 2005, ApJ, 626, 864
- Maeder & Conti (1994) Maeder, A., Conti, P.S., 1994, ARA&A, 32, 227
- Maíz-Apellániz et al. (2004) Maíz-Apellániz, J., Walborn, N. R., Galué, H. Á., & Wei, L. H. 2004, ApJS, 151, 103
- Martin et al. (2009) Martin, P., Knödlseder, J., Diehl, R., & Meynet, G. 2009, A&A, 506, 703
- Martins et al. (2005) Martins, F., Schaerer, D., & Hillier, D. J. 2005, A&A, 436, 1049
- Mathieu (2008) Mathieu, R. D. 2008, Handbook of Star Forming Regions, Volume I: The Northern Sky ASP Monograph Publications, Vol. 4. Edited by Bo Reipurth, p.757, 757
- Menten et al. (2007) Menten, K. M., Reid, M. J., Forbrich, J., & Brunthaler, A. 2007, A&A, 474, 515
- Meynet & Maeder (2005) Meynet, G. & Maeder, A., 2005, A&A, 429, 581-598
- Meynet et al. (1997) Meynet, G., Gould, M., Prantzos, N., et al., 1997, A&A, 320, 460
- Mokiem et al. (2007) Mokiem, M. R., et al. 2007, A&A, 473, 603
- Muench et al. (2008) Muench, A., Getman, K., Hillenbrand, L., & Preibisch, T. 2008, Handbook of Star Forming Regions, Volume I: The Northern Sky ASP Monograph Publications, Vol. 4. Edited by Bo Reipurth, p.483, 483
- Niedzielski & Skorzynski (2002) Niedzielski, A., Skorzynski, W., 2002, Acta Astronomica, 52, 81
- Oskinova et al. (2007) Oskinova, L. M., Hamann, W.-R., & Feldmeier, A. 2007, A&A, 476, 1331
- Palacios et al. (2005) Palacios, A., Meynet, G., Vuissoz, C., et al., 2005, A&A, 429, 613-624
- Panagia (1973) Panagia, N., 1973, AJ, 78, 929
- Parizot et al. (2004) Parizot, E., Marcowith, A., van der Swaluw, E., Bykov, A.M., Tatischeff, V., 2004, A&A, 424, 747
- Perryman et al. (1997) Perryman, M. A. C., et al., 1997, A&A, 323, L49
- Prantzos & Diehl (1996) Prantzos, N., & Diehl, R., 1996, Phys. Rep., 267, 1
- Repolust et al. (2004) Repolust, T., Puls, J., & Herrero, A. 2004, A&A, 415, 349
- Rugel et al. (2009) Rugel, G., et al. 2009, Physical Review Letters, 103, 072502
- Salpeter (1955) Salpeter, E.E., 1955, ApJ, 121, 161
- Sandstrom et al. (2007) Sandstrom, K. M., Peek, J. E. G., Bower, G. C., Bolatto, A. D., & Plambeck, R. L. 2007, ApJ, 667, 1161
- Scalo (1986) Scalo, J. M. 1986, Luminous Stars and Associations in Galaxies, 116, 451
- Schaller et al. (1992) Schaller, G., Schaerer, D., Meynet, G., & Maeder, A. 1992, A&AS, 96, 269
- Searle et al. (2008) Searle, S. C., Prinja, R. K., Massa, D., & Ryans, R. 2008, A&A, 481, 777
- Simón-Díaz et al. (2006) Simón-Díaz, S., Herrero, A., Esteban, C., & Najarro, F. 2006, A&A, 448, 351
- Smith et al. (2005) Smith, L., Norris, R.P.F., Crowther, P.A., 2005, MNRAS, 337, 1309
- Smith (2006) Smith, N. 2006, MNRAS, 367, 763
- Smith & Brooks (2007) Smith, N., & Brooks, K. J. 2007, MNRAS, 379, 1279
- Sundqvist et al. (2010) Sundqvist, J. O., Puls, J., & Feldmeier, A. 2010, A&A, 510, A11
- Vacca et al. (1996) Vacca, W.D., Garmany, C.D., Shull, J.M., 1996, ApJ, 460, 914
- van der Hucht (1987) van der Hucht,K.A., Williams, P.M., The, P.S., 1987, QJRAS, 28, 254
- van der Werf & Goss (1989) van der Werf, P. P., & Goss, W. M. 1989, A&A, 224, 209
- Vazquez & Leitherer (2005) Vazquez, G.A., Leitherer, C., 2005, ApJ, 621, 695
- Vink et al. (2000) Vink, J. S., de Koter, A., & Lamers, H. J. G. L. M. 2000, A&A, 362, 295
- Voss et al. (2009) Voss, R., Diehl, R., Hartmann, D. H., Cerviño, M., Vink, J. S., Meynet, G., Limongi, M., & Chieffi, A. 2009, A&A, 504, 531
- Waldron & Cassinelli (2010) Waldron, W. L., & Cassinelli, J. P. 2010, ApJ, 711, L30
- Walter et al. (2008) Walter, F. M., Sherry, W. H., Wolk, S. J., & Adams, N. R. 2008, Handbook of Star Forming Regions, Volume I: The Northern Sky ASP Monograph Publications, Vol. 4. Edited by Bo Reipurth, p.732, 732
- Wang et al. (2007) Wang, W., et al. 2007, A&A, 469, 1005
- Warren & Hesser (1977) Warren, W. H., Jr., & Hesser, J. E. 1977, ApJS, 34, 115
- Woosley et al. (1995) Woosley, S.E., Langer, N., Weaver, T.A., 1995, ApJ, 448, 315