11email: christophe.pinte@obs.ujf-grenoble.fr 22institutetext: School of Physics, University of Exeter, UK 33institutetext: SUPA, Institute for Astronomy, University of Edinburgh, Royal Observatory, Blackford Hill, Edinburgh, EH9 3HJ, UK; 44institutetext: UK Astronomy Technology Centre, Royal Observatory, Edinburgh, Blackford Hill, Edinburgh EH9 3HJ, UK 55institutetext: School of Physics & Astronomy, University of St. Andrews, North Haugh, St. Andrews KY16 9SS, UK 66institutetext: Astronomy Department, University of California, Berkeley, CA 94720-3411, USA 77institutetext: Kapteyn Astronomical Institute, Postbus 800, 9700 AV Groningen, The Netherlands 88institutetext: Dep. de Física Teórica, Fac. de Ciencias, UAM Campus Cantoblanco, 28049 Madrid, Spain 99institutetext: Institute for Astronomy, University of Hawaii at Manoa, Honolulu, HI 96822, USA 1010institutetext: SOFIA-USRA, NASA Ames Research Center, Mailstop 211-3 Moffett Field CA 94035 USA 1111institutetext: Eureka Scientific and Exoplanets and Stellar Astrophysics Lab, NASA Goddard Space Flight Center, Code 667, Greenbelt, MD, 20771, USA 1212institutetext: ALMA, Joint ALMA Office, Avda Apoquindo 3846, Piso 19, Edificio Alsacia, Las Condes, Santiago, Chile 1313institutetext: European Southern Observatory, Alonso de C rdova 3107, Vitacura, Casilla 19001, Santiago 19, Chile 1414institutetext: Unidad de Archivo de Datos, Depto. Astrofísica, Centro de Astrobiología (INTA-CSIC), P.O. Box 78, E-28691 Villanueva de la Cañada, Spain 1515institutetext: Spanish Virtual Observatory 1616institutetext: Harvard-Smithsonian Center for Astrophysics, 60 Garden St., Cambridge, MA, USA 1717institutetext: NASA Herschel Science Center, California Institute of Technology, Pasadena, USA. 1818institutetext: Calar Alto Observatory, Centro Astronómico Hispano-Alemán C/Jesús Durbán Remón, 2-2, 04004 Almería, Spain 1919institutetext: LAEX, Depto. Astrofísica, Centro de Astrobiología (INTA-CSIC), P.O. Box 78, E-28691 Villanueva de la Cañada, Spain 2020institutetext: Clemson University 2121institutetext: NASA Exoplanet Science Institute/Caltech 770 South Wilson Avenue, Mail Code: 100-22, Pasadena, CA USA 91125 2222institutetext: NASA Goddard Space Flight Center, Exoplanets & Stellar Astrophysics, Code 667, Greenbelt, MD 20771, USA 2323institutetext: Max Planck Institut für Astronomie, Königstuhl 17, 69117 Heidelberg, Germany 2424institutetext: ohns Hopkins University Dept. of Physics and Astronomy, 3701 San Martin drive Baltimore, MD 21210 USA 2525institutetext: Research and Scientific Support Department-ESA/ESTEC, PO Box 299, 2200 AG Noordwijk, The Netherlands 2626institutetext: Astrophysikalisches Institut und Universitätssternwarte, Friedrich-Schiller-Universität, Schillergäßchen 2-3, 07745 Jena, Germany 2727institutetext: Department of Radio and Space Science, Chalmers University of Technology, Onsala Space Observatory, 439 92 Onsala, Sweden 2828institutetext: ESA-ESAC Gaia SOC, P.O. Box 78. E-28691 Villanueva de la Cañada, Madrid, Spain 2929institutetext: Spitzer Science Center, California Institute of Technology, 1200 E California Blvd, 91125 Pasadena, USA. 3030institutetext: Department of Astronomy, Graduate School of Science, Kyoto University, Kyoto 606-8502,Japan 3131institutetext: CEA/IRFU/SAp, AIM UMR 7158, 91191 Gif-sur-Yvette, France 3232institutetext: Space Telescope Science Institute, 3700 San Martin Drive, Baltimore, MD 21218, USA 3333institutetext: European Southern Observatory, Karl-Schwarzschild-Strasse, 2, 85748 Garching bei München, Germany. 3434institutetext: Exoplanets and Stellar Astrophysics Lab, NASA Goddard Space Flight Center, Code 667, Greenbelt, MD, 20771, USA 3535institutetext: Instituut voor Sterrenkunde, KU Leuven, Celestijnenlaan 200D, 3001 Leuven, Belgium 3636institutetext: The Rutherford Appleton Laboratory, Chilton, Didcot, OX11 OQL, UK 3737institutetext: Department of Physics & Astronomy, The Open University, Milton Keynes MK7 6AA, UK
The Herschel view of Gas in Protoplanetary Systems (GASPS)††thanks: Herschel is an ESA space observatory with science instruments provided by European-led Principal Investigator consortia and with important participation from NASA.
The Herschel GASPS Key Program is a survey of the gas phase of protoplanetary discs, targeting 240 objects which cover a large range of ages, spectral types, and disc properties. To interpret this large quantity of data and initiate self-consistent analyses of the gas and dust properties of protoplanetary discs, we have combined the capabilities of the radiative transfer code MCFOST with the gas thermal balance and chemistry code ProDiMo to compute a grid of 300 000 disc models (DENT). We present a comparison of the first Herschel/GASPS line and continuum data with the predictions from the DENT grid of models. Our objective is to test some of the main trends already identified in the DENT grid, as well as to define better empirical diagnostics to estimate the total gas mass of protoplanetary discs. Photospheric UV radiation appears to be the dominant gas-heating mechanism for Herbig stars, whereas UV excess and/or X-rays emission dominates for T Tauri stars. The DENT grid reveals the complexity in the analysis of far-IR lines and the difficulty to invert these observations into physical quantities. The combination of Herschel line observations with continuum data and/or with rotational lines in the (sub-)millimetre regime, in particular CO lines, is required for a detailed characterisation of the physical and chemical properties of circumstellar discs.
Key Words.:
Astrochemistry; circumstellar matter; protoplanetary discs ; stars: formation; Radiative transfer; Methods: numerical; line: formation1 Introduction
The dust phase of circumstellar discs has received a lot of attention in the last few decades, giving us a clearer picture of their structure and dust content through many continuum surveys in various wavelengths regimes (e.g. Beckwith et al. 1990; Andrews & Williams 2007; Evans et al. 2007), complemented by detailed studies of individual objects, combining spectral energy distributions (SEDs) and resolved maps in scattered light and thermal emission (e.g. Pinte et al. 2008; Duchêne et al. 2010).
Although gas represents 99 % of the initial mass of discs, it has been more difficult to observe and is mostly restricted to millimetre lines probing the cold outer disc, where the freeze-out of molecules is important (e.g. Dent et al. 2005; Schaefer et al. 2009), and near-IR lines which are only emitted from the hot inner parts of discs (e.g. Najita et al. 2003; Brittain et al. 2007). The high sensitivity of Herschel (Pilbratt et al 2010) opens an opportunity to systematically probe the gas phase of discs, in particular the warm atomic and molecular layer responsible for the bright gas emission lines in the far-IR. The GASPS open time key program (see Dent et al., in prep. and Mathews et al 2010) is a large survey of gas in discs with a gas mass sensitivity comparable to the dust surveys. GASPS will observe several atomic and molecular lines in about 240 protoplanetary disc systems with ages in the critical 1 to 30 million year age range during which planets form and the gas seems to dissipate.
The interpretation of gas observations is complicated by the large number of processes at play: processing of radiation by dust grains, disc thermal structure, chemistry, excitation and destruction of molecules, freeze-out and desorption on the dust grains, etc. To estimate the relative importance of these mechanisms as a function of age, stellar properties, disc structure, and dust content, we have computed a large grid of synthetic SEDs and gas emission lines, named Disc Evolution with Neat Theory (DENT, Woitke et al. 2010). Here, we confront the trends identified in the DENT grid with the first GASPS observations.
2 The DENT grid and initial GASPS data
The DENT grid is intended as a statistical tool to investigate the influence of stellar, disc, and dust properties on the various continuum and line observables, and to study to what extent these dependencies can be inverted to retrieve disc properties. The grid relies on the combined capabilities of the 3D radiative transfer code MCFOST (Pinte et al. 2006, 2009) and the gas thermal balance and chemistry code ProDiMo (Woitke et al. 2009; Kamp et al. 2010). Spectral energy distributions and line fluxes of [OI], [CII], 12CO, ortho-H2O and para-H2O are predicted for more than 300 000 discs models. The DENT grid was built by systematically exploring an 11-dimension parameter space (see Woitke et al. 2010, table 1). In particular the DENT grid explores the effect of varying the central star (age, mass, UV excess), disc dust mass and gas-to-dust mass ratio, inner and outer radii, flaring and surface density exponents, grain sizes, and presence of dust settling. It is important to keep in mind that even with the large number of calculated models, the sampling of each parameter remains coarse and that the DENT grid does not reflect the statistics of objects in GASPS (each parameter has been sampled uniformly and not following the distributions of the GASPS target list). We refer the reader to Woitke et al. (2010) for details about the grid properties and computational implementation.
We include here data obtained during the science demonstration phase (SDP, Mathews et al 2010), as well as GASPS data reduced prior to 2010 April 23, which will be presented in detail in following papers. Due to the limited number of sources, statistical analyses remain premature, but initial comparisons with the model predictions are necessary to ensure that the range of models cover the GASPS observations.
3 Results and discussion
One of the main reasons to compute the DENT grid was to estimate the degeneracies between parameters, i.e. how they influence the various lines and how far Herschel line observations can be inverted to assess the physical and chemical conditions of the disc. Not surprisingly, the DENT grid revealed that many parameters affect the predicted line fluxes and SEDs, and degeneracies between parameters are common and complex, which makes the interpretation of lines fluxes difficult.
3.1 Gas heating processes
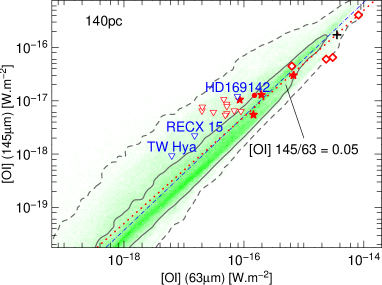
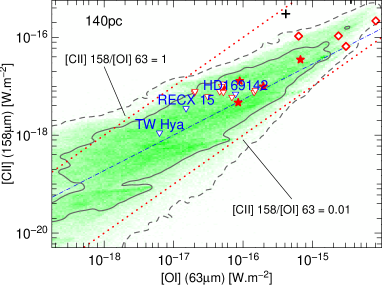
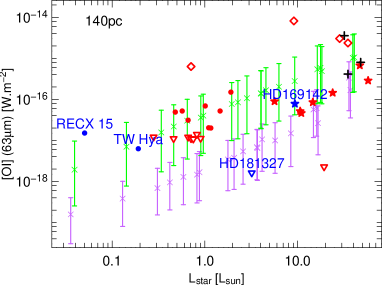
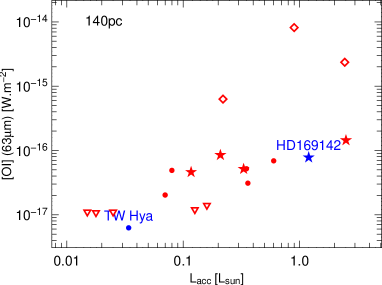
Figure 1 plots the [OI] 63 m line flux as a function of the stellar luminosity and accretion luminosity. The DENT grid predicts a correlation between the line flux and the stellar luminosity. All observational points (except sources with a large outflow or envelope) lie within the 1-sigma envelope of the models.
For T Tauri stars, the detected line fluxes are well reproduced by models with a high UV excess (fUV = 0.1, see Woitke et al. 2010), suggesting that UV emission produced by accretion onto the star is one of the main gas-heating processes. The right panel of Fig. 1 indeed suggests a trend between [OI] line flux and accretion luminosity. On the other hand, Herbig Ae/Be stars show a strong correlation between the line flux and stellar luminosities, with a much smaller scatter than for T Tauri stars. Large UV excesses do not seem necessary to reproduce the Herbig observations (data points lie between models with high- and low-UV excess). This suggests that stellar radiation is the dominant gas-heating source for Herbig stars. Because these sources radiate large phostospheric UV emission, the accretion luminosity represents a smaller fraction of the UV luminosity and is not as critical a gas heating mechanism as for T Tauri stars. This is also consistent with the small fraction of large accretors (LL∗) among Herbig stars (Garcia Lopez et al. 2006).
X-ray irradiation, which is not yet included in the DENT grid, can also contribute significantly to the gas heating and chemistry for low-mass objects (e.g. Glassgold et al. 2004; Semenov et al. 2004; Meijerink et al. 2008; Hollenbach & Gorti 2009; Ercolano & Owen 2010) and higher fluxes can be expected for sources with typical T Tauri X-ray emission. The small number of sources observed by GASPS so far prevents us from distinguishing between UV and X-rays for the main heating process for low mass objects. The full GASPS survey should provide detailed answers on these aspects.
Figure 2 presents the [OI] 145 m and [CII] 158 m line fluxes as a function of the [OI] 63m line. The models are in excellent agreement with the GASPS observations. The DENT grid predicts a correlation between the [OI] 63 and 145 m line fluxes. A regression fit of all the DENT points indicates that both line fluxes are almost proportional (), with a [OI] 145/63 line ratio around 0.05 on average. The presence of scatter in the plot illustrates the wide range of physical conditions encountered in the DENT grid. The correlation, however, is very strong (Pearson correlation coefficient of 0.97) and holds for several orders of magnitude in line flux. These results agree with the prediction of Tielens & Hollenbach (1985) for a 1D photodissociation region (see their Fig. 2). Our detailed line modelling of the 2D PDR disc surface with varying density and irradiation confirms the picture drawn from these 1D models: the oxygen lines are optically thick and originate in a relatively high-temperature gas (K). As a consequence, this line ratio does not provide constraints on the local gas density and temperature in most cases.
Deviations from this average ratio of 0.05 are interesting though. In particular, two Herbig Ae with known outflows observed by GASPS present a small line ratio around 0.025. According to Tielens & Hollenbach (1985), this value cannot be obtained for optically thick lines. This suggests that a significant fraction of the line fluxes originates from an optically thin region above the bulk of the disc (potentially the outflow) with a temperature between 40 and 200 K. These sources will be studied in detail in following GASPS papers.
The [CII] 158 m line also presents a correlation with the [OI] 63 m, but with a much larger scatter. A regression fit of the DENT models indicates that on average , with a decreasing line ratio as the line flux increases. This suggests an increasing gas temperature (Fig. 3 in Tielens & Hollenbach 1985) in the disc towards more luminous objects. Most of the DENT models lie in a region where the line ratio is between 0.01 and 1, suggesting gas temperatures higher than 100 K. More detailed analyses of the [CII] line are complicated by several factors: our disc models show that the line originates from larger radii and lower density regions than the [OI] lines, and it is very sensitive to the amount of UV radiation.
3.2 Gas mass and gas-to-dust mass ratio
In addition to the main trend of an increasing line flux with (UV) luminosity, there is also a trend with gas mass, where the synthetic line flux increases with mass, but the correlation seems to saturate above M⊙ (see also Woitke et al. 2010), preventing direct inversion of the line flux into a gas mass (Fig. 3).
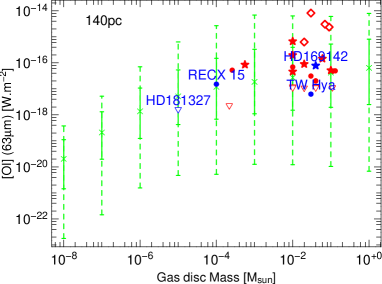
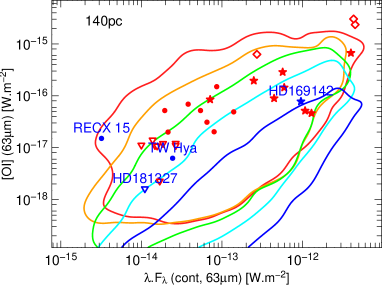
The right panel of Fig. 3 shows the correlation between the [OI] 63 m line flux and the adjacent continuum. Because the line and continuum emissions are optically thick in most cases, these fluxes give an indication of the relative temperatures and projected surface area of the emitting regions (gas and dust). As the stellar luminosity increases, the region of the disc which is warm enough to contribute significantly to the emission also increases, resulting in larger fluxes. This behaviour is observed for most GASPS sources where the line flux roughly increases with the continuum level, but with a significant scatter. As a consequence, this indicates that a large fraction of discs with a significant far-IR excess will be detected in [OI] by Herschel. The separation of the DENT models according to their gas-to-dust mass ratio suggests that most objects are gas-rich (gas/dust mass ratio ). The large scatter in the models, and the optical depth in the continuum and the line, precludes however, in most cases, a precise estimate of the gas-to-dust ratio for individual sources. For instance, no direct ratio (or upper limit for HD 181327) can be estimated from this diagnostic alone for HD 169142 and TW Hydra, for which the line fluxes can be reproduced by any ratio between 1 and 1 000. In addition, the contribution of an outflow to the line flux may affect the estimation of the disc gas-to-dust ratio and needs to be accounted for.
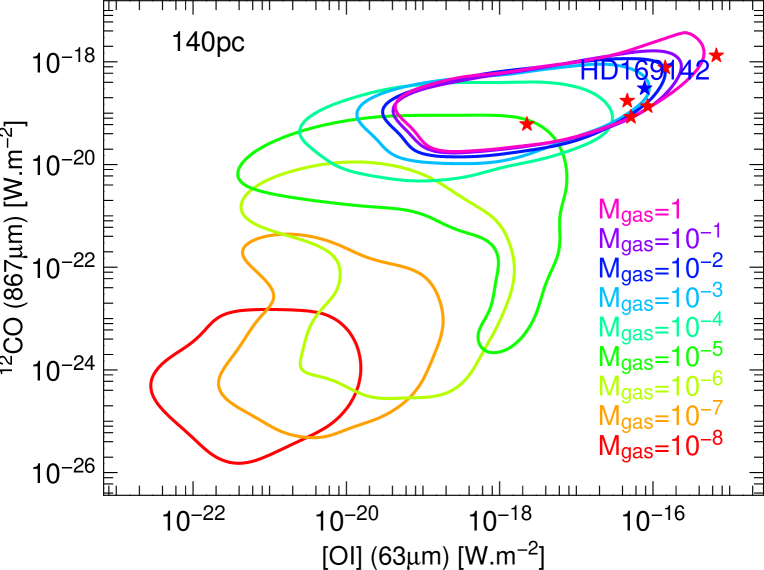
Greater observational constraints and more detailed modelling is required to estimate the gas mass and gas-to-dust ratio. In particular, the combination of low rotational level transitions of CO with oxygen lines offers a valuable proxy to estimate the amount of gas in discs. Figure 4 plots the 12CO J=32 line flux as a function of the [OI] 63 m line flux. We stress that the accuracy in the calculated CO abundances is limited by our approximate treatment of self-shielding (see Woitke et al. 2009), but this does not affect our conclusions. For low-mass discs, this diagram allows a clear distinction of the gas disc mass. As the mass increases, lines become optically thick and the corresponding fluxes saturate, preventing determination of the gas mass. Current CO surveys can only reach sources in this saturation regime (see for instance data from Dent et al. 2005 in Fig. 4), but this perspective is particularly interesting in the context of ALMA, which will offer high sensitivity for CO lines ( W.m-2). Similar diagrams combining 13CO (not included in DENT, but see Meeus et al 2010 and Thi et al 2010), C18O and [OI] 145 m, which saturate at higher masses due to lower optical depths, will further help to overcome this degeneracy. As oxygen lines are sensitive to warm gas in the inner 10-30 AU (for T Tauri stars), they offer complementary views to the low-J CO lines which probe regions outside of 20-40 AU, especially when resolved maps of the CO emission are available.
4 Summary and conclusions
The GASPS survey will offer unique views of the gas and dust phases of protoplanetary discs. In order to provide statistical tools to help the interpretation of the survey results, we interfaced the MCFOST and ProDiMo codes and calculated a large grid of models sampling the range of discs observed by GASPS. This will allow us to determine some of the physical conditions within discs. The initial results from the GASPS survey tend to confirm the predictions of the DENT grid, illustrating the main parameters affecting the line fluxes, namely the UV excess and/or X-ray emission for T Tauri stars and the UV stellar irradiation for Herbig stars. This is a highly relevant point to be considered in subsequent open time programs on discs.
The interpretation of line results remains difficult and their inversion into physical parameters must be performed with caution, because the DENT grid highlights considerable degeneracies between parameters and the complex interplay between various physical processes. The [OI] 63m is crucial for breaking some of the degeneracies. By combining this line with continuum and/or (sub)mm rotational lines, we can possibly distinguish various parameters. Meeus et al (2010) and Thi et al (2010) illustrate how far this inversion can be performed when high quality data sets with a wide range of observational techniques are available.
Acknowledgements.
C. Pinte acknowledges funding from the European Commission’s 7th Framework Program as a Marie Curie Intra-European Fellow (PIEF-GA-2008-220891). The members of LAOG, Grenoble acknowledge PNPS, CNES and ANR (contract ANR-07-BLAN-0221) for financial support. W.F. Thi acknowledges a SUPA astrobiology fellowship. G. Meeus, C. Eiroa, I. Mendigutía and B. Montesinos are partly supported by Spanish grant AYA 2008-01727. D.R. Ardila, S.D. Brittain, W. Danchi, C.A. Grady, C.D. Howard, G.S. Mathews, I. Pascucci, A. Roberge, B. Riaz, G. Sandell and J.P. Williams acknowledge NASA/JPL for funding support. J.M. Alcid and E. Solano acknowledges funding from the Spanish MICINN (grant AYA2008-02156).References
- Andrews & Williams (2007) Andrews, S. M. & Williams, J. P. 2007, ApJ, 659, 705
- Beckwith et al. (1990) Beckwith, S. V. W., Sargent, A. I., Chini, R. S., & Guesten, R. 1990, AJ, 99, 924
- Brittain et al. (2007) Brittain, S. D., Simon, T., Najita, J. R., & Rettig, T. W. 2007, ApJ, 659, 685
- Dent et al. (2005) Dent, W. R. F., Greaves, J. S., & Coulson, I. M. 2005, MNRAS, 359, 663
- Duchêne et al. (2010) Duchêne, G., McCabe, C., Pinte, C., et al. 2010, ApJ, 712, 112
- Ercolano & Owen (2010) Ercolano, B. & Owen, J. E. 2010, MNRAS, astro-ph/1004.1203
- Evans et al. (2007) Evans, N. J., Harvey, M. M., Huard, T. L., et al. 2007, c2d, Tech. rep.
- Garcia Lopez et al. (2006) Garcia Lopez, R., Natta, A., Testi, L., & Habart, E. 2006, A&A, 459, 837
- Glassgold et al. (2004) Glassgold, A. E., Najita, J., & Igea, J. 2004, ApJ, 615, 972
- Hartmann et al. (1998) Hartmann, L., Calvet, N., Gullbring, E., & D’Alessio, P. 1998, ApJ, 495, 385
- Hollenbach & Gorti (2009) Hollenbach, D. & Gorti, U. 2009, ApJ, 703, 1203
- Kamp et al. (2010) Kamp, I., Tilling, I., Woitke, P., Thi, W., & Hogerheijde, M. 2010, A&A, 510, A18+
- Mathews et al (2010) Mathews et al. 2010, A&A, this issue
- Meeus et al (2010) Meeus et al. 2010, A&A, this issue
- Meijerink et al. (2008) Meijerink, R., Glassgold, A. E., & Najita, J. R. 2008, ApJ, 676, 518
- Najita et al. (2003) Najita, J., Carr, J. S., & Mathieu, R. D. 2003, ApJ, 589, 931
- Pilbratt et al (2010) Pilbratt et al. 2010, A&A, this issue
- Pinte et al. (2009) Pinte, C., Harries, T. J., Min, M., et al. 2009, A&A, 498, 967
- Pinte et al. (2006) Pinte, C., Ménard, F., Duchêne, G., & Bastien, P. 2006, A&A, 459, 797
- Pinte et al. (2008) Pinte, C., Padgett, D. L., Ménard, F., et al. 2008, A&A, 489, 633
- Schaefer et al. (2009) Schaefer, G. H., Dutrey, A., Guilloteau, S., Simon, M., & White, R. J. 2009, ApJ, 701, 698
- Semenov et al. (2004) Semenov, D., Wiebe, D., & Henning, T. 2004, A&A, 417, 93
- Thi et al (2010) Thi et al. 2010, A&A, this issue
- Tielens & Hollenbach (1985) Tielens, A. G. G. M. & Hollenbach, D. 1985, ApJ, 291, 722
- Woitke et al. (2009) Woitke, P., Kamp, I., & Thi, W. 2009, A&A, 501, 383
- Woitke et al. (2010) Woitke, P., Pinte, C., Tilling, I., et al. 2010, MNRAS, astro-ph/1003.2323