Spectroscopic Confirmation of a Multiply Imaged Luminous Infrared Galaxy Behind the Bullet Cluster
Abstract
We report spectroscopic confirmation and high-resolution infrared imaging of a triply-imaged galaxy behind the Bullet Cluster. This source, a Spitzer-selected luminous infrared galaxy (LIRG), is confirmed via polycyclic aromatic hydrocarbon (PAH) features using the Spitzer Infrared Spectrograph (IRS) and resolved with HST WFC3 imaging. In this galaxy, which with a stellar mass M☉ is one of the two least massive ones studied with IRS at , we also detect and pure rotational lines (at 3.1 and 2.1) – the first detection of these molecular hydrogen lines in a high-redshift galaxy. From the molecular hydrogen lines we infer an excitation temperature K. The detection of these lines indicates that the warm molecular gas mass is % of the stellar mass and implies the likely existence of a substantial reservoir of cold molecular gas in the galaxy. Future spectral observations at longer wavelengths with facilities like the Herschel Space Observatory, the Large Millimeter Telescope, and the Atacama Pathfinder EXperiment (APEX) thus hold the promise of precisely determining the total molecular gas mass. Given the redshift, and using refined astrometric positions from the high resolution imaging, we also update the magnification estimate and derived fundamental physical properties of this system. The previously published values for , star formation rate, and dust temperature are confirmed modulo the revised magnification; however we find that PAH emission is roughly a factor of five stronger than would be predicted by the relations between and reported for SMGs and starbursts in Pope et al. (2008).
Subject headings:
galaxies: evolution, starburst — gravitational lensing – galaxies: clusters: general1. Introduction
An important legacy of the Spitzer Space Telescope is that it enabled the first detection of dust emission from a large number of luminous infrared galaxies at (e.g., Papovich et al., 2006; Pérez-González et al., 2005), demonstrating that these galaxies dominate the massive galaxy population at high redshift. The implication is that at massive galaxies are rapidly assembling their stars and growing supermassive black holes. For the most infrared-luminous systems, spectra from the Spitzer Infrared Spectrograph (IRS) have provided important insights into the physical processes driving (e.g., Houck et al., 2005; Yan et al., 2007). Pope et al. (2008) used IRS to demonstrate that the mid-IR properties of ultraluminous infrared galaxies (ULIRGs, L☉) and submillimeter galaxies (SMGs) are distinct, with star-formation dominating the infrared emission for typical SMGs. It has been postulated by this group and others that such differences indicate different evolutionary stages, as the dominant source of transitions from star formation to AGN emission.
Existing studies like Pope et al. (2008) clearly demonstrate that IRS spectroscopy provides a clean means of disentangling the AGN and star formation contributions. A limitation to such work though is that current samples only probe the bright end of the luminosity function at high-z (Dey et al., 2008; Dye et al., 2008), and IRS observations are practical for only a small subset of the most luminous sources. Observations of luminous infrared galaxies (LIRGS, L☉), the dominant class of IR galaxies at these redshifts (Caputi et al., 2007, higher density than ULIRGS), have simply not been feasible. Gravitational lensing provides a means of circumventing this limitation, however, and several recent programs exploit strong lensing to study the properties of lensed galaxies at mid-IR and submillimeter wavelengths (Knudsen et al., 2008; Rigby et al., 2008, and references therein).
In this paper we utilize a similar strategy to study a highly magnified luminous infrared galaxy that lies behind the Bullet Cluster (Markevitch et al., 2002). First identified in Spitzer IRAC imaging (Bradač et al., 2006), this galaxy has been shown to be a triply imaged optical drop-out (Gonzalez et al., 2009, hereafter Paper I) that is extremely luminous at submillimeter wavelengths ( Jy at 500m Wilson et al., 2008; Rex et al., 2009; Johansson et al., 2010; Rex et al., 2010). Photometric redshift estimates based upon both the stellar SED and the submillimeter emission place the galaxy at (Wilson et al., 2008; Gonzalez et al., 2009; Rex et al., 2009), while lensing constraints imply magnification factors of for each of the three images (Paper I). This galaxy therefore presents a unique opportunity to study in detail the properties of a member of the LIRG population during the peak epoch of star formation and galaxy assembly when these galaxies may be responsible for more than half the total infrared emission (Rodighiero et al., 2010).
We present in this paper the results of targeted observations of this lensed galaxy with Spitzer IRS spectroscopy and HST Wide Field Camera 3 (WFC3) infrared imaging. We combine these observations with both refined positions from the WFC3 imaging and published results from Wilson et al. (2008), Paper I, and Rex et al. (2009) to derive updated physical parameters for this galaxy. We also constrain the total contribution of a central active galactic nuclei (AGN) to the total mid-infrared emission. The data are presented in §2, while the analysis and derived physical properties are presented in §3. We summarize our results in §4. Throughout the paper we assume km s-1, , and , consistent with the five-year WMAP cosmological analysis (Komatsu et al., 2009).
2. Data
2.1. Spitzer IRS
We observed the galaxy on 2009 April 14–15 (PI Gonzalez, program ID 496) using the Infrared Spectrograph (Houck et al., 2004, IRS) on board Spitzer during a single Spitzer Astronomical Observation Request to minimize alignment uncertainty. We targeted the source using the IRS LL1 module, which provides a spectrum in the wavelength interval m. This module was selected based upon the existing photometric redshifts, which indicated that the prominent polycyclic aromatic hydrocarbon (PAH) emission features should lie in this wavelength interval.
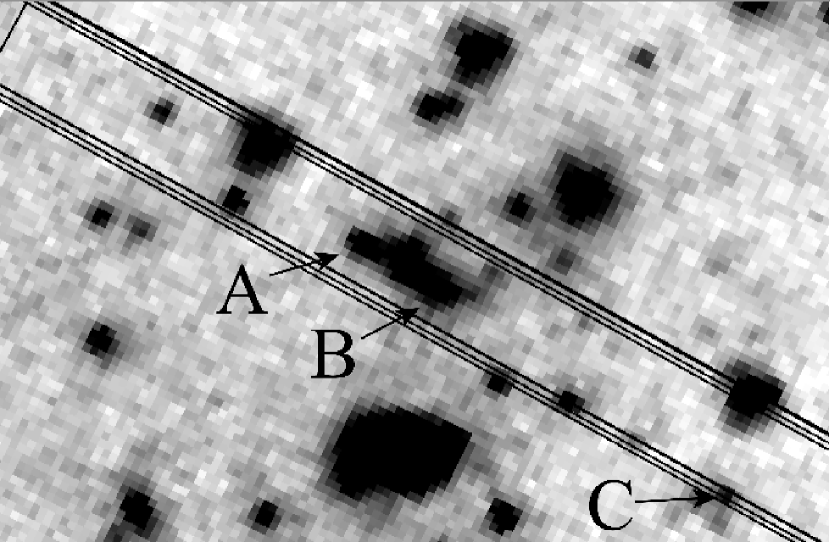
We centered the long slit on image B of the galaxy (see Figure 1). We used high–accuracy peak-up centroiding of stars from 2MASS (Skrutskie et al., 1997) with the IRS red filter to minimize deviations from the absolute telescope pointing. We did not restrict the spacecraft orientation for our data in order to maximize the likelihood that our observations would be executed prior to the end of the Spitzer cryogenic mission. Fortuitously, the slit orientation for our observations, 240.9° east of north, placed both images A and B of the source within the slit. Therefore our IRS observation contains the combined flux from the two brightest images of the galaxy. We were unable to extract a spectrum for image C, which lay on the very edge of the slit (see Figure 1). We obtained our IRS observations in mapping mode with four 20 steps along the IRS slit. The total exposure time for the LL1 spectroscopy is ks, where each map position consisted of 30 cycles with 120s ramp duration.
We reduced the IRS data using software provided by the Spitzer Science Center (SSC),111http://ssc.spitzer.caltech.edu and custom scripts (see Papovich et al., 2009) based on techniques discussed in Teplitz et al. (2007). We started with the S18.7.0 Spitzer IRS pipeline data, which produced basic calibrated data (BCD) files. The IRS/LL arrays accumulate latent charge during long exposures (Teplitz et al., 2007). We measured and subtracted this latent charge by fitting a first–order polynominal to the mean counts per BCD as a function of time.
We next identified and cleaned known bad and hot pixels using the SSC task IRSCLEAN222http://ssc.spitzer.caltech.edu/dataanalysistools/tools/irsclean/ with the known warm–pixel mask for our IRS campaign. We also identified other “rogue” and “warm” pixels as those with abnormally high variance, and used IRSCLEAN to interpolate over these pixels.
We constructed a sky spectrum for the lensed galaxy at each of the four slit positions by combining the BCDs of the three other slit positions. To create the sky image, we took the median of the stack of each pixel after rejecting outliers using a sigma–clipping algorithm. We performed this process iteratively, masking out the location of the lensed galaxy during subsequent iterations (the lensed galaxy is the only source we identify in the 2D spectrum). We then subtracted the sky frame from each BCD and coadded the BCDs at each slit position. As a last step, we reran IRSCLEAN on the combined images for each slit position to clean any remaining hot pixels. These steps produced four 2D spectroscopic images for the lensed galaxy, one at each of the four slit positions.
We extracted 1D spectra at each slit position using the Spitzer/IRS custom extraction (SPICE) software333http://ssc.spitzer.caltech.edu/postbcd/spice.html. Following Teplitz et al. (2007) we used a narrower extraction window than the default to minimize the noise contribution from the background. We used a window that had a width of 3.5 pixels at 27 m and scaled with the wavelength. We estimated an aperture correction for this narrower aperture by comparing the spectra extracted using both the narrow and optimal extraction regions for the standard star HD 163466 taken in the same campaign as our science data. However, because the IRS observations of this star were taken in starring mode, and because our science target is likely extended along the IRS slit, this aperture correction is unlikely to be perfect. The total flux density of the IRS spectrum integrated with the MIPS 24m passband we derived is mJy, only slightly lower than mJy coadded from images A and B from photometry in the MIPS 24 µm data in Paper I. Therefore the aperture correction we applied seems valid. Nevertheless, we multiplied the IRS spectrum by a factor of 1.04 to normalize to the MIPS data, thereby accounting for any remaining aperture effects and flux calibration issues. As noted in Gonzalez et al. (2009), the spectral energy distributions of the cluster elliptical and star that lie near the galaxy fall rapidly with wavelength and contribute negligibly at 24m. We therefore require no correction for these sources in the IRS spectral extraction.
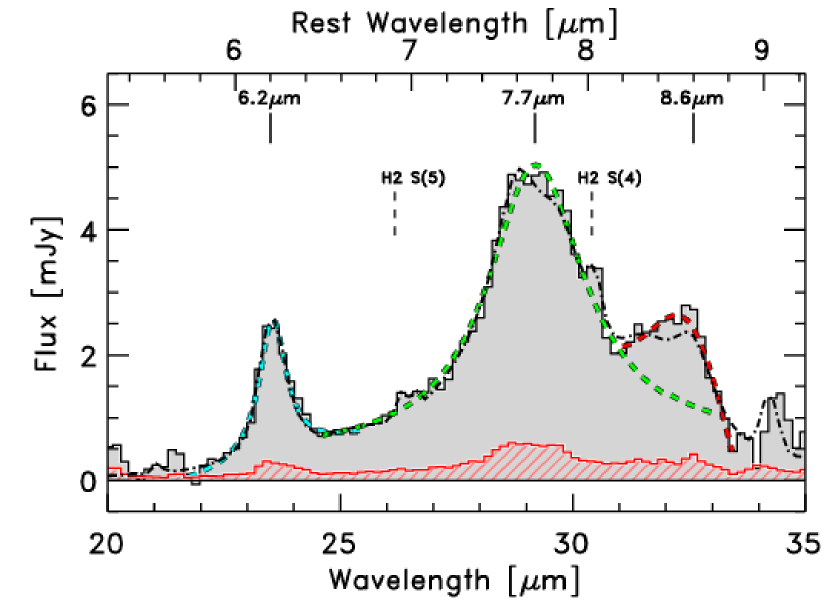
To evaluate the errors in our spectra, we also extracted a sky spectrum using the same SPICE parameters at each slit position offset from the lensed galaxy. We use these sky spectra to estimate the error derived from the science spectra. Our tests showed that the errors derived from the sky were consistent with those propagated directly through the data reduction, and we use the latter in subsequent analysis. We then combined the four one–dimensional spectra as a weighted mean, using the weights derived from the error spectra. The estimate of the variance on the combined science spectrum is the inverse sum of the weights. Figure 2 shows the resultant one–dimensional science spectrum.
2.2. HST Imaging
We obtained imaging with the HST Wide Field Camera 3 (WFC3 Kimble et al., 2008) on 19-20 November 2009 (Cycle 17, proposal 11099, PI Bradač), and with the Advanced Camera for Surveys (ACS Ford et al., 2003) on 2006 October 12-13 (Cycle 15, proposal 10863, PI Gonzalez) and 2004 October 21 (Cycle 13, proposal 10200, PI Jones). The new WFC3 data consist of two overlapping WFC3/IR pointings in F110W and F160W, with total integration times at the location of the lensed LIRG (where the WFC3 pointings overlap) of 13ks and 14ks, respectively. The ACS data, which are described in Paper I, include F606W, F775W, and F850LP imaging.
All images were processed using standard calibration files and stacked using custom software from the HAGGLeS project (Marshall et al. 2010, in preparation) that is based upon MultiDrizzle (Koekemoer et al., 2002). To register the F850LP, F110W, and F160W images with the astrometric accuracy needed for this analysis (in particular since the standard distortion model we used did not give sufficient accuracy to simply align overlapping pointings), we determine the offsets among the images by extracting high S/N objects in the individual, distortion corrected exposures. We use SExtractor (Bertin & Arnouts, 1996) and the IRAF routine geomap to identify the objects and calculate the residual shifts and rotation of individual exposures, which were then fed back into Multidrizzle. We use square as the final drizzling kernel and an output pixel scale of 0.1 arcsec; this is smaller than the original pixel scale of the WFC3/IR, but larger than ACS CCD, allowing us to exploit the dithering of the observations and improve the sampling of the PSF.
| Quantity | Value |
|---|---|
| f(6.2µm) | erg s-1 cm-2 |
| f(7.7µm) | erg s-1 cm-2 |
| f(8.6µm) | erg s-1 cm-2 |
| f() | erg s-1 cm-2 |
| f() | erg s-1 cm-2 |
| f(7.7µm)/f(6.2µm) | |
| mF160W | (AB) |
3. Analysis and Results
3.1. PAH Features and Redshift
The IRS spectrum for the galaxy is presented in Figure 2. The 6.2m, 7.7m, and 8.6m PAH complexes are detected in the spectrum. We also tentatively detect the line, which is discussed separately in §3.8. We use Drude profiles, as in Smith et al. (2007), to model each spectral feature and use a power law to fit the underlying continuum. We derive the redshift from the two strongest PAH features (6.2m and 7.7m), obtaining . This redshift confirms the photometric redshifts in the literature (; Wilson et al., 2008; Gonzalez et al., 2009; Rex et al., 2009).
The derived fluxes for the PAH features are listed in Table 1. The flux ratio for the two highest signal-to-noise lines, , can be compared with results from Pope et al. (2008) for submillimeter galaxies (SMGs). The star-formation dominated SMGs in the Pope et al. sample () have flux ratios in the range of 1.4 to 3.5 for these PAH lines – somewhat lower than the ratio we observe, but with a range that overlaps the 1 uncertainty for this galaxy.
3.2. WFC3 Imaging of the Lensed Galaxy
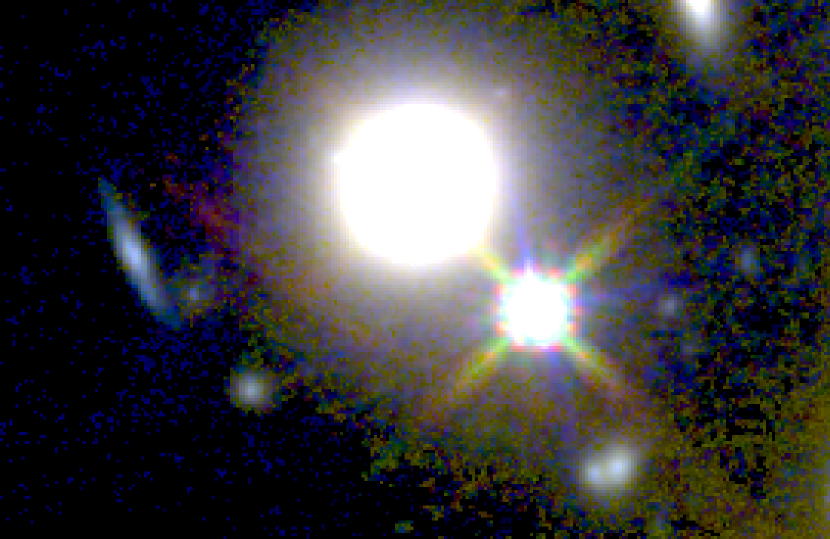
With the new HST WFC3 imaging we repeat the photometric analysis described in Paper I to try to identify the lensed galaxy in high-resolution photometry. We show in Figure 3 (left panel) a composite color image constructed from the F850LP, F110W, and F160 images. The lensed galaxy can be seen in the composite image as a faint red arc that contains brighter knots of emission in the vicinity of images A and B from the Spitzer data.
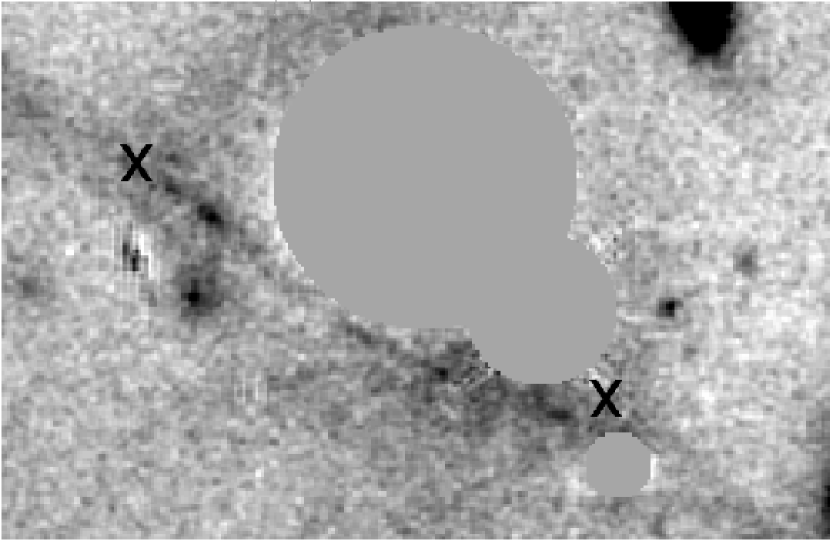
We use GALFIT version 3.0 to model and subtract foreground objects near the location of the lensed galaxy. The object, which is not detected in F850LP (Paper I), is detected in F110W but is too faint relative to the model residuals to recover robust photometry. The arc is bright however in F160W (Figure 3, right panel). To verify that this arc is indeed the same lensed galaxy as identified at longer wavelengths, we measure the flux ratio for the two lobes of the arc. Specifically, we extract the fluxes within polygonal apertures enclosing each of the bright emission regions and correct for the sky using background apertures placed on nearby blank sky regions. We measure a flux ratio – consistent with results at longer wavelengths in Paper I(see also §3.3). The total magnitude for the entire arc (images A and B) is (AB), which corresponds to a flux density of Jy. As shall become clear in §3.3, without magnification this object would be extremely faint, with . We refrain from quoting a flux density at F110W due to the lower contrast with the foreground galaxy and higher associated systematic uncertainties.
3.3. Magnification
Conversion of the PAH line fluxes to luminosities requires not only the redshift but also a determination of the lensing magnification. We use the same mass maps described in Paper I. Consequently, the only changes from the previous analysis are the spectroscopic redshift and improved astrometric positions. The former has only a modest impact, whereas the latter have a more significant impact because of the steep magnification gradient near the critical curve.
In the current discussion we are concerned primarily with images A and B. The WFC3 astrometry moves both images A and B slightly closer to the critical curve and consequently raises the derived magnifications. At the location of image A we compute a magnification and at image B we obtain . The measured flux ratio of the two images from Paper I is . To estimate the range of plausible magnification for the blended IRS spectrum, we take individually the predicted magnifications for A and B at the locations of peak emission for each arc and combine these with the observed flux ratio.444Our magnification maps do not have the accuracy to resolve structure on the scale of the arcs, so we do use this point estimate rather than averaging over the photometric apertures. We find that the total combined magnification is . In subsequent discussion we will quote quantities in terms of to reflect the intrinsic uncertainty in the magnification. In Paper I we used , which corresponds to .
3.4. Presence of an AGN
In Paper I we considered the question of whether the infrared emission in this object is driven by star formation or AGN activity. Based upon the hint of spatial extension in the IRAC data and lack of X-ray detection, we argued that the emission cannot be purely due to AGN. We further concluded that the observed mid-infrared colors (4.5 to 24 µm) indicated that the source spectral energy distribution may be a composite with contributions from both starburst and AGN contributions.
We now revisit this question based upon both the IRS spectroscopy and WFC3 imaging. From the spectral analysis we can also place an upper bound on the contribution of the AGN to the mid-infrared emission by estimating the fraction of the flux contained in the power-law continuum. From µm rest-frame, the continuum contributes % of the total emission, confirming that the AGN is not dominant at mid-infrared wavelengths, but leaving the possibility that it may be a significant contributor to the far-infrared emission.
Additional information is provided by the WFC3 imaging, in which we resolve the target galaxy into gravitational arcs. As discussed in §, the flux ratio for components A and B in the F160W observations is consistent with the 24µm flux ratio. Because we are probing near the critical curves where there are strong magnification gradients, this should not necessarily be the case unless the stellar emission and PAH emission have similar spatial distributions within the galaxy. Thus, the WFC3 data further supports the picture that in this galaxy the mid- and far-infrared emission is dominated by star formation.
3.5. Stellar Population Age and Mass
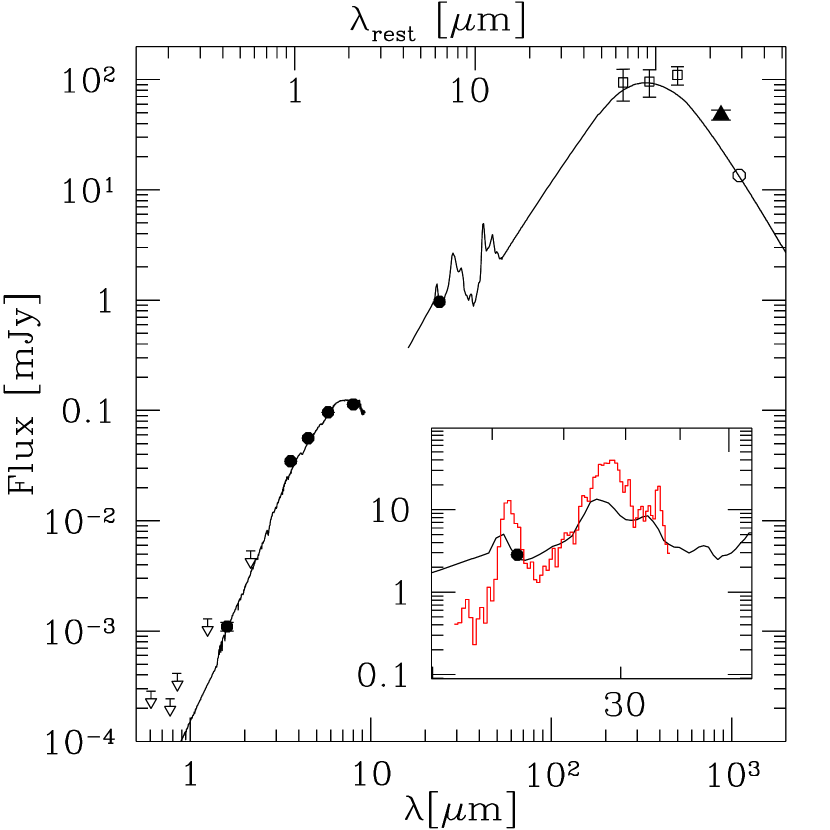
We present in Figure 4 the full spectral energy distribution for the combination of images A and B, including all published data. Given the redshift, we can now repeat the analyses of the SED presented in Paper I to refine the physical constraints on the system.
We first use HyperZ (Bolzonella et al., 2000) to derive improved constraints on the age of the dominant stellar population and total internal absorption of the system. As in Paper I, the input spectral templates are based upon the Charlot & Bruzual 2007 models with the Padova 1994 evolutionary tracks (Bertelli et al., 1994) and a Chabrier (2003) mass function. We use a Calzetti et al. (2000) extinction law to estimate the internal extinction, and fit the photometry at observed wavelengths m to exclude PAH emission. We refer the reader to Paper I for further details. In deriving confidence intervals on the age and extinction, we find that the data are best fit by a 10 Myr population. The solutions for the emission-weighted age bifurcate though, permitting both very young templates and solutions with ages of a few Gyrs. The 90% confidence intervals on the age are Myrs and Gyrs. We note however that strong observed submillimeter emission provides a compelling argument for a very young stellar population. The extinction meanwhile is constrained to be (90% confidence). The confidence interval reduces to if one considers only the younger age solutions.
Next, we update our estimate of the stellar mass using the code kcorrect (Blanton & Roweis, 2007), as in Paper I. We fit the combined flux from images A and B, using the data at observed wavelengths of 1.5µm 8µm. For and , we obtain a stellar mass .555An important caveat to keep in mind is that systematic uncertainties in stellar mass estimates can yield a factor of two or greater errors (Conroy et al., 2009). This value is roughly a factor of 3 lower than the previously published result. The added leverage from the 1.6µm data point is the largest factor in the decrease, with the addition of this data point accounting for roughly a factor of 2. The revised magnification estimates account for the remainder of the change, while the changes in redshift and extinction have only a minor impact. The updated stellar mass implies that the target is a low-mass dwarf galaxy.
3.6. Total Infrared Luminosity
There exist multiple different techniques for estimating the total infrared luminosity for a galaxy where the infrared emission is dominated by star formation. The preferred technique is to use data spanning the peak of the far-infrared (FIR) spectral energy distribution and directly fit a modified blackbody to the far-infrared emission. This technique, which should now become the default method in the era of Herschel, provides the most straightforward constraint on with the added advantage of directly yielding the temperature of the dust if the redshift is known. Many past studies, in the absence of the requisite FIR data, have instead utilized either 24 µm emission or PAH luminosities to estimate . With the unique data sets available for our lensed galaxy behind the Bullet Cluster, we are able to compare estimates via all three approaches and assess the level of consistency for this particular dusty starburst.
We first consider the direct approach. Rex et al. (2009) previously reported L☉ and a dust temperature K for this system using data from AzTEC and BLAST with an assumed redshift of . Johansson et al. (2010) recently reported an 870 µm flux density from the Large APEX BOlometer CAmera (LABOCA) and noted that the 1.1 mm data point from Wilson et al. (2008) will soon be revised upward to mJy. The primary impact will be a % revision in the dust temperature and , which are both within the presumed uncertainties. The Herschel Lensing Survey (PI: Egami) should soon significantly improve determinations of both quantities (see Rex et al., 2010).
Second, we estimate using the 24 µm emission alone, without separating the PAH from continuum emission. This method is predicated on matching the observed 24 µm luminosity to a best-fit spectral energy distribution. As in Paper I we use the code and templates from Chary & Elbaz (2001) to calculate the bolometric infrared luminosity. Updating the magnification and redshift from the previous analysis, we obtain L☉. This value is broadly consistent with the modified blackbody fit to mm data, predicting well the shorter wavelength BLAST data points and the published AzTEC 1.1 mm result. The disagreement with the longer wavelength data points and expected upward revision to the AzTEC data can be considered a possible indication of a cooler dust temperature than in the Chary & Elbaz (2001) templates.666A change in the normalization of the blackbody to match the BLAST and revised AzTEC data would yield a poor fit to the data near the peak; only a cooler dust temperature can simultaneously fit all the millimeter and submillimeter data.
Finally, we consider the observed emission from the PAH features, which are known to be strongly correlated with star formation. Pope et al. (2008) presented PAH luminosities for a sample of 13 SMGs (predominantly ultraluminous infrared galaxies with ) at . Combining these with total infrared luminosities from Pope et al. (2006), and including a sample of lower luminosity low-redshift starburst galaxies, the authors derived a relation between PAH and total infrared luminosity for star-formation dominated infrared galaxies.
For the magnification derived in §3.3, we find that the observed PAH features have luminosities L☉ and L☉. Following the Pope et al. (2008) relations, we compute that L☉ and L☉ from the 6.2 µm and 7.7 µm lines, respectively. The quoted errors include the uncertainties in the PAH measurements and in the coefficients of the Pope et al. (2008) relations, but do not include intrinsic scatter in the relations. The two PAH lines give values that are factors of and higher than the estimates based upon the FIR emission and 24 µm template fitting, respectively. This offset can plausibly be argued as due to the intrinsic scatter about the mean relation since the few galaxies in this luminosity regime in Pope et al. (2008) also exhibit large scatter; however, similar offsets are also seen for the lensed submillimeter galaxy SMM J1643554.2+661225, MS1512-cB58, and the Cosmic Eye, which all have M M☉ (Papovich et al., 2009; Siana et al., 2009). Moreover, Rigby et al. (2008) observe a comparable enhancement in for LIRGs at . Together these results argue for a possible systematic shift relative to the Pope et al. (2008) relation at LIRG luminosities.
3.7. Star Formation Rate
To estimate the star formation rate (SFR), we use the determinations based upon the FIR emission and 24 µm template fitting. Following the Kennicutt (1998) relation, these estimates imply SFR M☉ yr-1.
Combining these values with the revised stellar mass, the estimated specific star formation rate (SSFR) for this galaxy is 25-40 Gyr-1. The specific star formation rate and stellar mass are consistent with the results for low-mass BM/BX and LBG galaxies in Reddy et al. (2006). These results thus imply that this particular galaxy is not unique, but rather indicative of the general low-mass, star-forming population at this epoch.
3.8. Molecular Hydrogen
We detect the pure rotational line at rest frame 8.025 µm in the IRS spectrum, and also have a tentative () detection of the line at 6.909 µm – the first detection of these lines in a high redshift galaxy. Fitting Drude profiles, we derive line fluxes of erg s-1 cm-2 and erg s-1 cm-2 (Table 1). These fluxes correspond to luminosities of erg s-1 and erg s-1, respectively. The line strength is exceptionally strong, with a luminosity that exceeds that of the nearby LIRG NGC 6240 ( L☉) by more than a factor of 50 (Armus et al., 2006).
The ratio of these two lines can be used to directly constrain the excitation temperature of the gas. Physically, for lower excitation temperatures a greater fraction of the gas is in the low energy states and the fraction of emitting in decreases correspondingly. The observed ratio implies K for a single temperature gas – relatively cool compared to systems with shocked gas (e.g. Armus et al., 2006; Egami et al., 2006). The corresponding constraint on the warm molecular gas mass can then be computed as
| (1) |
where the are the statistical weights of the energy states (see Rosenthal et al., 2000) and the number density for the transition can be calculated as
| (2) |
where is the luminosity and is the Einstein coefficient. From this approach we derive a warm molecular gas mass M☉. This value serves as a lower bound on the total molecular gas content of this system since we do not presently probe the cold gas. Equivalently, this warm gas mass is % of the stellar mass derived in §3.5. For comparison, in their study of the lensed Lyman break galaxy LBG J213512.73-010143 Coppin et al. (2007) use CO data to derive a cold molecular gas mass of , which is 30% of the stellar mass – consistent with what we see in this system (albeit with large uncertainty).
| Quantity | Value |
|---|---|
| z | |
| aaConfidence interval is 90% rather than 1. | |
| Agea,ba,bfootnotemark: | Myrs |
| SFR | 100-150 M☉ yr-1 |
| SSFR | 25-40 Gyr-1 |
| M∗ | M☉ |
| M | M☉ |
| T | K |
| LIR (24 m) | L☉ |
| LIR (FIR)ccValue from Rex et al. (2009). | L☉ |
| LIR (PAH,6.2µm) | L☉ |
| LIR (PAH,7.7µm) | L☉ |
The observed molecular emission is thus consistent with the picture of a relatively cool ( K) dusty starburst with a significant gas reservoir. A more detailed confirmation of this picture will require future observations of either the lines or CO rotational lines at longer wavelength, which will enable a robust determination of the total gas content. Finally, we note that the lensed Lyman break galaxies J213512-01043 and MS1512-cB58 are the only galaxies with similar and redshift for which gas masses have been determined via the CO (3-2) line (Baker et al., 2004; Coppin et al., 2007).777The SMG SMM J2135-0102, which has a factor of higher , also has a gas mass via the CO (1-0) line (Swinbank et al., 2010). The lensed galaxy described in this paper exhibits much greater extinction and thus provides complementary information.
4. Summary and Discussion
In this paper we present IRS spectroscopic confirmation of a luminous infrared galaxy at that is highly magnified by the Bullet Cluster. We also spatially resolve the galaxy with WFC3, revealing gravitational arcs near the previously determined Spitzer positions. The redshift determination and high signal-to-noise of the spectrum, coupled with the multiwavelength photometry, enable us to refine our previous analysis of the physical properties of this galaxy. We determine that the lensed object is a low-mass dwarf galaxy, M M☉, for which the far-infrared thermal emission is star-formation dominated. The inferred specific star formation rate, Gyr-1, is typical for a field galaxy of this mass at this redshift (e.g. Reddy et al., 2006). The observed and derived physical quantities are summarized in Tables 1 and 2.
By virtue of the extreme lensing – the two brighest images have a combined magnification of roughly 100 – this object thus provides a powerful laboratory in which to probe the conditions in low-mass, star-forming galaxies during an epoch when they are otherwise inaccessible. Indeed, this galaxy is one of the two lowest mass systems with IRS spectroscopy at .888The lensed LBG MS1512-cB58 has a factor of lower stellar mass (see Siana et al., 2008). Perhaps most promising for future investigations, our detection of rotational H2 lines is indicative of a large molecular gas reservoir. We derive a temperature of K and estimate a gas mass of M☉ in this component, roughly 2-42% of the stellar mass. Future spectroscopic observations of longer wavelength H2 lines with Herschel and CO rotational lines with a facility such as the Large Millimeter Telescope or the Atacama Pathfinder EXperiment (APEX) therefore have the potential to precisely measure the total molecular gas content in this galaxy. Finally, we note that because dwarf galaxies of this mass are a ubiquitous population, the odds are good that programs like the Herschel Lensing Survey can detect a sizable sample of similar lensed sources behind massive clusters.
References
- Armus et al. (2006) Armus, L., Bernard-Salas, J., Spoon, H. W. W., Marshall, J. A., Charmandaris, V., Higdon, S. J. U., Desai, V., Hao, L., Teplitz, H. I., Devost, D., Brandl, B. R., Soifer, B. T., & Houck, J. R. 2006, ApJ, 640, 204
- Baker et al. (2004) Baker, A. J., Tacconi, L. J., Genzel, R., Lehnert, M. D., & Lutz, D. 2004, ApJ, 604, 125
- Bertelli et al. (1994) Bertelli, G., Bressan, A., Chiosi, C., Fagotto, F., & Nasi, E. 1994, A&AS, 106, 275
- Bertin & Arnouts (1996) Bertin, E. & Arnouts, S. 1996, A&AS, 117, 393
- Blanton & Roweis (2007) Blanton, M. R. & Roweis, S. 2007, AJ, 133, 734
- Bolzonella et al. (2000) Bolzonella, M., Miralles, J.-M., & Pelló, R. 2000, A&A, 363, 476
- Bradač et al. (2006) Bradač, M., Clowe, D., Gonzalez, A. H., Marshall, P., Forman, W., Jones, C., Markevitch, M., Randall, S., Schrabback, T., & Zaritsky, D. 2006, ApJ, 652, 937
- Calzetti et al. (2000) Calzetti, D., Armus, L., Bohlin, R. C., Kinney, A. L., Koornneef, J., & Storchi-Bergmann, T. 2000, ApJ, 533, 682
- Caputi et al. (2007) Caputi, K. I., Lagache, G., Yan, L., Dole, H., Bavouzet, N., Le Floc’h, E., Choi, P. I., Helou, G., & Reddy, N. 2007, ApJ, 660, 97
- Chabrier (2003) Chabrier, G. 2003, PASP, 115, 763
- Chary & Elbaz (2001) Chary, R. & Elbaz, D. 2001, ApJ, 556, 562
- Conroy et al. (2009) Conroy, C., Gunn, J. E., & White, M. 2009, ApJ, 699, 486
- Coppin et al. (2007) Coppin, K. E. K., Swinbank, A. M., Neri, R., Cox, P., Smail, I., Ellis, R. S., Geach, J. E., Siana, B., Teplitz, H., Dye, S., Kneib, J., Edge, A. C., & Richard, J. 2007, ApJ, 665, 936
- Dey et al. (2008) Dey, A., Soifer, B. T., Desai, V., Brand, K., LeFloc’h, E., Brown, M. J., Jannuzi, B. T., Armus, L., Bussmann, S., Brodwin, M., Bian, C., Eisenhardt, P., Higdon, S., Weedman, D., & Willner, S. 2008, ArXiv e-prints, 801
- Dye et al. (2008) Dye, S., Eales, S. A., Aretxaga, I., Serjeant, S., Dunlop, J. S., Babbedge, T. S. R., Chapman, S. C., Cirasuolo, M., Clements, D. L., Coppin, K. E. K., Dunne, L., Egami, E., Farrah, D., Ivison, R. J., van Kampen, E., Pope, A., Priddey, R., Rieke, G. H., Schael, A. M., Scott, D., Simpson, C., Takagi, T., Takata, T., & Vaccari, M. 2008, ArXiv e-prints, 802
- Egami et al. (2006) Egami, E., Rieke, G. H., Fadda, D., & Hines, D. C. 2006, ApJ, 652, L21
- Ford et al. (2003) Ford, H. C., Clampin, M., Hartig, G. F., Illingworth, G. D., Sirianni, M., Martel, A. R., Meurer, G. R., McCann, W. J., Sullivan, P. C., Bartko, F., Benitez, N., Blakeslee, J., Bouwens, R., Broadhurst, T., Brown, R. A., Burrows, C. J., Campbell, D., Cheng, E. S., Feldman, P. D., Franx, M., Golimowski, D. A., Gronwall, C., Kimble, R. A., Krist, J. E., Lesser, M. P., Magee, D., Miley, G., Postman, M., Rafal, M. D., Rosati, P., Sparks, W. B., Tran, H. D., Tsvetanov, Z. I., Volmer, P., White, R. L., & Woodruff, R. A. 2003, in Presented at the Society of Photo-Optical Instrumentation Engineers (SPIE) Conference, Vol. 4854, Future EUV/UV and Visible Space Astrophysics Missions and Instrumentation. Edited by J. Chris Blades, Oswald H. W. Siegmund. Proceedings of the SPIE, Volume 4854, pp. 81-94 (2003)., ed. J. C. Blades & O. H. W. Siegmund, 81–94
- Gonzalez et al. (2009) Gonzalez, A. H., Clowe, D., Bradač, M., Zaritsky, D., Jones, C., & Markevitch, M. 2009, ApJ, 691, 525
- Houck et al. (2004) Houck, J. R., Roellig, T. L., Van Cleve, J., Forrest, W. J., Herter, T. L., Lawrence, C. R., Matthews, K., Reitsema, H. J., Soifer, B. T., Watson, D. M., Weedman, D., Huisjen, M., Troeltzsch, J. R., Barry, D. J., Bernard-Salas, J., Blacken, C., Brandl, B. R., Charmandaris, V., Devost, D., Gull, G. E., Hall, P., Henderson, C. P., Higdon, S. J. U., Pirger, B. E., Schoenwald, J., Sloan, G. C., Uchida, K. I., Appleton, P. N., Armus, L., Burgdorf, M. J., Fajardo-Acosta, S. B., Grillmair, C. J., Ingalls, J. G., Morris, P. W., & Teplitz, H. I. 2004, in Society of Photo-Optical Instrumentation Engineers (SPIE) Conference Series, Vol. 5487, Society of Photo-Optical Instrumentation Engineers (SPIE) Conference Series, ed. J. C. Mather, 62–76
- Houck et al. (2005) Houck, J. R., Soifer, B. T., Weedman, D., Higdon, S. J. U., Higdon, J. L., Herter, T., Brown, M. J. I., Dey, A., Jannuzi, B. T., Le Floc’h, E., Rieke, M., Armus, L., Charmandaris, V., Brandl, B. R., & Teplitz, H. I. 2005, ApJ, 622, L105
- Johansson et al. (2010) Johansson, D., Horellou, C., Sommer, M. W., Basu, K., Bertoldi, F., Birkinshaw, M., Lancaster, K., Lopez-Cruz, O., & Quintana, H. 2010, ArXiv e-prints
- Kennicutt (1998) Kennicutt, Jr., R. C. 1998, ApJ, 498, 541
- Kimble et al. (2008) Kimble, R. A., MacKenty, J. W., O’Connell, R. W., & Townsend, J. A. 2008, in Presented at the Society of Photo-Optical Instrumentation Engineers (SPIE) Conference, Vol. 7010, Society of Photo-Optical Instrumentation Engineers (SPIE) Conference Series
- Knudsen et al. (2008) Knudsen, K. K., van der Werf, P. P., & Kneib, J.-P. 2008, MNRAS, 384, 1611
- Koekemoer et al. (2002) Koekemoer, A. M., Fruchter, A. S., Hook, R. N., & Hack, W. 2002, in The 2002 HST Calibration Workshop : Hubble after the Installation of the ACS and the NICMOS Cooling System, ed. S. Arribas, A. Koekemoer, & B. Whitmore, 337–+
- Komatsu et al. (2009) Komatsu, E., Dunkley, J., Nolta, M. R., Bennett, C. L., Gold, B., Hinshaw, G., Jarosik, N., Larson, D., Limon, M., Page, L., Spergel, D. N., Halpern, M., Hill, R. S., Kogut, A., Meyer, S. S., Tucker, G. S., Weiland, J. L., Wollack, E., & Wright, E. L. 2009, ApJS, 180, 330
- Markevitch et al. (2002) Markevitch, M., Gonzalez, A. H., David, L., Vikhlinin, A., Murray, S., Forman, W., Jones, C., & Tucker, W. 2002, ApJ, 567, L27
- Papovich et al. (2006) Papovich, C., Moustakas, L. A., Dickinson, M., Le Floc’h, E., Rieke, G. H., Daddi, E., Alexander, D. M., Bauer, F., Brandt, W. N., Dahlen, T., Egami, E., Eisenhardt, P., Elbaz, D., Ferguson, H. C., Giavalisco, M., Lucas, R. A., Mobasher, B., Pérez-González, P. G., Stutz, A., Rieke, M. J., & Yan, H. 2006, ApJ, 640, 92
- Papovich et al. (2009) Papovich, C., Rudnick, G., Rigby, J. R., Willmer, C. N. A., Smith, J., Finkelstein, S. L., Egami, E., & Rieke, M. 2009, ApJ, 704, 1506
- Pérez-González et al. (2005) Pérez-González, P. G., Rieke, G. H., Egami, E., Alonso-Herrero, A., Dole, H., Papovich, C., Blaylock, M., Jones, J., Rieke, M., Rigby, J., Barmby, P., Fazio, G. G., Huang, J., & Martin, C. 2005, ApJ, 630, 82
- Pope et al. (2008) Pope, A., Chary, R.-R., Alexander, D. M., Armus, L., Dickinson, M., Elbaz, D., Frayer, D., Scott, D., & Teplitz, H. 2008, ApJ, 675, 1171
- Pope et al. (2006) Pope, A., Scott, D., Dickinson, M., Chary, R., Morrison, G., Borys, C., Sajina, A., Alexander, D. M., Daddi, E., Frayer, D., MacDonald, E., & Stern, D. 2006, MNRAS, 370, 1185
- Reddy et al. (2006) Reddy, N. A., Steidel, C. C., Fadda, D., Yan, L., Pettini, M., Shapley, A. E., Erb, D. K., & Adelberger, K. L. 2006, ApJ, 644, 792
- Rex et al. (2009) Rex, M., Ade, P. A. R., Aretxaga, I., Bock, J. J., Chapin, E. L., Devlin, M. J., Dicker, S. R., Griffin, M., Gundersen, J. O., Halpern, M., Hargrave, P. C., Hughes, D. H., Klein, J., Marsden, G., Martin, P. G., Mauskopf, P., Montaña, A., Netterfield, C. B., Olmi, L., Pascale, E., Patanchon, G., Scott, D., Semisch, C., Thomas, N., Truch, M. D. P., Tucker, C., Tucker, G. S., Viero, M. P., & Wiebe, D. V. 2009, ApJ, 703, 348
- Rex et al. (2010) Rex, M., Rawle, T. D., Egami, E., Pérez-González, P. G., Zemcov, M., Aretxaga, I., Chung, S. M., Fadda, D., Gonzalez, A. H., Hughes, D. H., Horellou, C., Johansson, D., Kneib, J., Richard, J., Altieri, B., Fiedler, A. K., Pereira, M. J., Rieke, G. H., Smail, I., Valtchanov, I., Blain, A. W., Bock, J. J., Boone, F., Bridge, C. R., Clement, B., Combes, F., Dowell, C. D., Dessauges-Zavadsky, M., Ilbert, O., Ivison, R. J., Jauzac, M., Lutz, D., Omont, A., Pelló, R., Rodighiero, G., Schaerer, D., Smith, G. P., Walth, G. L., van der Werf, P., Werner, M. W., Austermann, J. E., Ezawa, H., Kawabe, R., Kohno, K., Perera, T. A., Scott, K. S., Wilson, G. W., & Yun, M. S. 2010, ArXiv e-prints
- Rigby et al. (2008) Rigby, J. R., Marcillac, D., Egami, E., Rieke, G. H., Richard, J., Kneib, J.-P., Fadda, D., Willmer, C. N. A., Borys, C., van der Werf, P. P., Pérez-González, P. G., Knudsen, K. K., & Papovich, C. 2008, ApJ, 675, 262
- Rodighiero et al. (2010) Rodighiero, G., Vaccari, M., Franceschini, A., Tresse, L., Le Fevre, O., Le Brun, V., Mancini, C., Matute, I., Cimatti, A., Marchetti, L., Ilbert, O., Arnouts, S., Bolzonella, M., Zucca, E., Bardelli, S., Lonsdale, C. J., Shupe, D., Surace, J., Rowan-Robinson, M., Garilli, B., Zamorani, G., Pozzetti, L., Bondi, M., de La Torre, S., Vergani, D., Santini, P., Grazian, A., & Fontana, A. 2010, A&A, 515, A8+
- Rosenthal et al. (2000) Rosenthal, D., Bertoldi, F., & Drapatz, S. 2000, A&A, 356, 705
- Siana et al. (2009) Siana, B., Smail, I., Swinbank, A. M., Richard, J., Teplitz, H. I., Coppin, K. E. K., Ellis, R. S., Stark, D. P., Kneib, J., & Edge, A. C. 2009, ApJ, 698, 1273
- Siana et al. (2008) Siana, B., Teplitz, H. I., Chary, R., Colbert, J., & Frayer, D. T. 2008, ApJ, 689, 59
- Skrutskie et al. (1997) Skrutskie, M. F., Schneider, S. E., Stiening, R., Strom, S. E., Weinberg, M. D., Beichman, C., Chester, T., Cutri, R., Lonsdale, C., Elias, J., Elston, R., Capps, R., Carpenter, J., Huchra, J., Liebert, J., Monet, D., Price, S., & Seitzer, P. 1997, in ASSL Vol. 210, The Impact of Large Scale Near-IR Sky Surveys, eds. F. Garzon et al. (Dordrecht: Kluwer Academic Publishing), 25–32
- Smith et al. (2007) Smith, J. D. T., Draine, B. T., Dale, D. A., Moustakas, J., Kennicutt, Jr., R. C., Helou, G., Armus, L., Roussel, H., Sheth, K., Bendo, G. J., Buckalew, B. A., Calzetti, D., Engelbracht, C. W., Gordon, K. D., Hollenbach, D. J., Li, A., Malhotra, S., Murphy, E. J., & Walter, F. 2007, ApJ, 656, 770
- Swinbank et al. (2010) Swinbank, A. M., Smail, I., Longmore, S., Harris, A. I., Baker, A. J., De Breuck, C., Richard, J., Edge, A. C., Ivison, R. J., Blundell, R., Coppin, K. E. K., Cox, P., Gurwell, M., Hainline, L. J., Krips, M., Lundgren, A., Neri, R., Siana, B., Siringo, G., Stark, D. P., Wilner, D., & Younger, J. D. 2010, Nature, 464, 733
- Teplitz et al. (2007) Teplitz, H. I., Desai, V., Armus, L., Chary, R., Marshall, J. A., Colbert, J. W., Frayer, D. T., Pope, A., Blain, A., Spoon, H. W. W., Charmandaris, V., & Scott, D. 2007, ApJ, 659, 941
- Wilson et al. (2008) Wilson, G. W., Hughes, D. H., Aretxaga, I., Ezawa, H., Austermann, J. E., Doyle, S., Ferrusca, D., Hernández-Curiel, I., Kawabe, R., Kitayama, T., Kohno, K., Kuboi, A., Matsuo, H., Mauskopf, P. D., Murakoshi, Y., Montaña, A., Natarajan, P., Oshima, T., Ota, N., Perera, T. A., Rand, J., Scott, K. S., Tanaka, K., Tsuboi, M., Williams, C. C., Yamaguchi, N., & Yun, M. S. 2008, MNRAS, 390, 1061
- Yan et al. (2007) Yan, L., Sajina, A., Fadda, D., Choi, P., Armus, L., Helou, G., Teplitz, H., Frayer, D., & Surace, J. 2007, ApJ, 658, 778