LoCuSS: Probing Galaxy Transformation Physics with Herschel††thanks: Herschel is an ESA space observatory with science instruments provided by European-led Principal Investigator consortia and with important participation from NASA.
We present an early broad-brush analysis of Herschel/PACS observations of star-forming galaxies in 8 galaxy clusters drawn from our survey of 30 clusters at . We define a complete sample of spectroscopically confirmed cluster members down to and . The average -band and bolometric infrared luminosities of these galaxies both fade by a factor of from clustercentric radii of to , indicating that as galaxies enter the clusters ongoing star-formation stops first in the most massive galaxies, and that the specific star-formation rate (SSFR) is conserved. On smaller scales the average SSFR jumps by , suggesting that in cluster cores processes including ram pressure stripping may trigger a final episode of star-formation that presumably exhausts the remaining gas. This picture is consistent with our comparison of the Herschel-detected cluster members with the cluster mass distributions, as measured in our previous weak-lensing study of these clusters. For example, the spatial distribution of the Herschel sources is positively correlated with the structures in the weak-lensing mass maps at significance, with the strongest signal seen at intermediate group-like densities. The strong dependence of the total cluster IR luminosity on cluster mass – – is also consistent with accretion of galaxies and groups of galaxies (i.e. the substructure mass function) driving the cluster IR luminosity. The most surprising result is that roughly half of the Herschel-detected cluster members have redder flux ratios than expected, based on the Rieke et al. models. On average cluster members are redder than non-members, and the fraction of red galaxies increases towards the cluster centers, both of which indicate that these colors are not attributable to systematic photometric errors. Our future goals include to intepret physically these red galaxies, and to exploit this unique large sample of clusters with unprecedented multi-wavelength observations to measure the cluster-cluster scatter in S0 progenitor populations, and to intepret that scatter in the context of the hierarchical assembly of clusters.
Key Words.:
galaxies: clusters – galaxies: evolution – galaxies: star formation – Infrared: galaxies1 Introduction
Lenticular galaxies (hereafter S0s) are mainly found in the cores of galaxy clusters at low redshift (e.g. Dressler et al. 1997; Smith et al. 2005; Postman et al. 2005). There is a broad consensus that they are the descendants of gas rich spiral galaxies that have been accreted from the surrounding filamentary structure. However the physics of how spirals are transformed into S0s remains largely unconstrained, with numerous “S0 progenitor” populations (e.g. Moran et al. 2006; Poggianti et al. 2000; Geach et al. 2006; Haines et al. 2009a – hereafter H09a) and physical processes (e.g. Gunn & Gott 1972; Moore et al. 1999) discussed in the literature.
The broad range of cluster-centric radii at which various S0 progenitors are found reflects the fact that different physical processes act in different environments, for example ram pressure stripping is more effective closer to cluster centers where the intracluster medium (ICM) is denser, and galaxy-galaxy merging is more effective in galaxy groups that are falling into the cluster than in the cluster cores. Moreover, the observational signatures of S0 progenitors are diverse, ranging in wavelength from ultraviolet (UV) emission from A stars in galaxies whose star-formation (SF) has been recently quenched, through optical spectral features including Balmer absorption lines, to mid/far-infrared (IR) emission from dust heated by SF (e.g. Moran et al. 2007; Poggianti et al. 2000; Haines et al. 2009b).
Mid- and far-IR properties of cluster galaxies have been studied previously with IRAS (e.g. Leggett et al. 1987; Doyon & Joseph 1989), ISO (see Metcalfe et al. 2005 for a review), and Spitzer (e.g. Geach et al. 2006; Fadda et al. 2008; Haines et al. 2009a,b; Bai et al. 2009). A key result from these IR studies is that a significant fraction of the total SF in galaxy clusters is obscured by dust. The inferred levels of SF naturally fit the hypothesis that bulge dominated S0s are descended from late-type spirals. It has also been suggested that dusty S0 progenitors are more common in dynamically active, i.e. merging, galaxy clusters than in so-called “relaxed” clusters (e.g. Metcalfe et al. 2005; Geach et al. 2006; Miller et al. 2006). However it has thus far been difficult to test this idea robustly because the intrinsic scatter in levels of SF in clusters appears to be large, (as noted by Kodama et al. 2004), and the sample sizes observed to date are small (i.e. ) within any given redshift bin – although see H09a for a recent counter-example.
We are therefore conducting a systematic wide-field survey of a large statistically well-defined sample of galaxy clusters in a narrow redshift slice at , as part of the Local Cluster Substructure Survey (LoCuSS111http://www.sr.bham.ac.uk/locuss/). Our goals are to compile a complete inventory of S0 progenitors using data from the far-UV to far-IR, and to relate these populations to the underlying gas physics and hierarchical structure of the host galaxy clusters. We aim to delineate the different physical processes responsible for galaxy transformation in clusters and their surrounding large scale structure, and thus constrain the amplitude of the different physical pathways from spiral to S0 morphology, and how these relate to the dynamical state of the clusters. Our Open Time Key Programme observations with Herschel (Pilbratt et al., 2010), supplemented by existing Spitzer mid-IR observations provide the all-important measurements of the bolometric IR luminosity and mid/far-IR colors of dust-reddened/obscured S0 progenitors.
We assume , , . In this cosmology at , subtends . All cluster masses and radii relative to an over-density are derived from the weak-lensing analysis of Okabe et al. (2010; hereafter Ok10).
2 Survey Design
Our survey goals include understanding the physical reasons for the large cluster-cluster variations in SF rate (SFR), and the full range of physical processes responsible for transforming spiral galaxies into S0s. We therefore require a large sample of clusters in order to sample thoroughly the underlying cluster population and the various S0 progenitor populations that they host. Our sample of 30 clusters therefore will allow us to study, for example, how total integrated cluster SFRs depend on global cluster properties such as cool core strength, and substructure fraction, in cluster bins with clusters per bin. Based on previous IR and UV studies of S0 progenitors, we expect such objects per cluster. Our sample of 30 clusters should therefore deliver a sample of S0 progenitors.
With current observing facilities and observed cluster samples, this study is prohibitvely expensive at high redshift because of the requirement for wide-field and moderately deep data on a large sample. We therefore concentrate on clusters at ; at this redshift gravitational lensing is an efficient probe of the dark matter distribution in the cluster in-fall regions using Suprime-CAM on the Subaru telescope, and yet follow-up Herschel observations of a sample of 30 clusters are feasible.
The cluster sample is a subset of those in the ROSAT All-sky Survey catalogs (Ebeling et al. 1998, 2000; Böhringer et al. 2004) that satisfy the following criteria: , , and , and that were observable with Subaru/Suprime-CAM on the nights assigned to us (Ok10). The sample is therefore blind to the thermodynamic, and hierarchical assembly history of the clusters, other than the use of X-ray luminosity as a proxy for mass-selection. The distribution of the X-ray luminosities of clusters in our sample is statistically indistinguishable from that of a volume-limited sample satisfying , where the scaling of with approximates mass-selection following Popesso et al. (2005) – see Ok10 for more details.
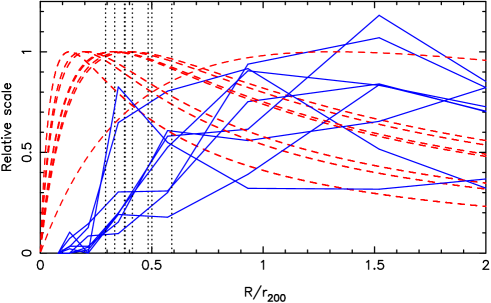
Our multi-wavelength observations of this sample (§3) span at least a clustercentric radius of on the sky, equating to for a typical cluster in our sample. This physical field of view is sufficiently large to probe all of the physical processes expected to play a role in galaxy transformation (Fig. 1).
3 Observations and Data Analysis
The 8 clusters discussed in this letter were observed with the Photodetector Array Camera and Spectrometer (PACS; Poglitsch et al. 2010) across a field of view at and in scan map mode at in November and December 2009. Each cross scan was repeated 7 times, giving a total exposure time of . We first processed the data using standard hipe routines (Ott 2010). Then all sources detected at in the first pass reduced data were masked using circular apertures, and the data were high pass filtered with a filter 25 and 30 frames wide at and respectively. The final maps were then constructed using the photproject routine. The angular resolution of the final reduced frames is at and at .
Sources were extracted using SExtractor, employing circular apertures of and diameter at and . The point spread function in the frame is slightly de-graded from that derived from the PACs calibration maps of Vesta, due to imperfect spatial calibration within scans where bright sources cannot be used to register the individual exposures. We therefore applied an empirical aperture correction of , based on brightest isolated sources in the maps. The standard Vesta aperture correction of was applied at . The completeness limits are at and at . Calculation of the total IR luminosities () discussed in §4 are described by Haines et al. (2010).
We also use our wide-field data from Spitzer/MIPS (; H09a), UKIRT/WFCAM (-bands; H09a), Chandra (Sanderson et al., 2009), and Subaru/Suprime-CAM (-bands; Okabe & Umetsu 2008; Ok10). We have spectroscopically identified of the sources down to the detection threshold using MMT/Hectospec (Fabricant et al. 2005), in addition to securing cluster galaxy redshifts per cluster (Hardegree-Ullman et al., in prep.).
4 Results
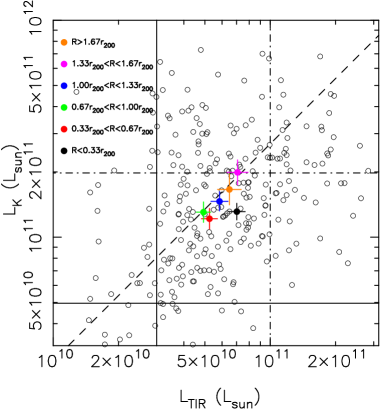
We identify Herschel sources down to and (Fig. 2) within a clustercentric radius of and lying inside the caustics in the velocity-radius plane (see Haines et al. 2010 for an example). Just (46/192) of these galaxies are LIRGs () and none are ultra-luminous IR galaxies (ULIRGs; ). The most luminous galaxy is the brightest cluster galaxy (BCG) in A 1835; we also detect the BCG in A 2390 (Edge et al. 1999; Egami et al. 2006). The typical galaxy has and . On average, the most IR-luminous galaxies are found at projected cluster-centric radii of ; at larger and smaller radii the average IR-luminosity declines. This trend is mirrored by a decline in the average -band luminosity such that is conserved down to , interior to which the average IR-luminous galaxy jumps from to (Fig. 2).
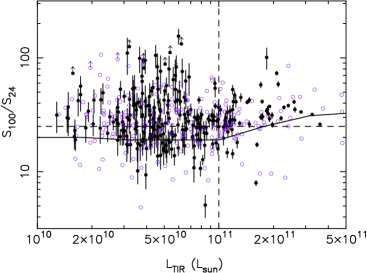

The colors of the IR-detected galaxies have a prominent excess of flux at relative to that expected from the commonly used Rieke et al. (2009) SED templates (Fig. 3). Adopting as defining this unexpected red population, we find that (121/192) of the spectroscopically confirmed members are “red”, with (36/46) of LIRG members, and (85/146) of sub-LIRG members being “red” respectively. The predominance of red LIRGs is partly expected given the predicted relationship between luminosity and color, however the observed LIRGs lie almost exclusively red-ward of the Rieke et al. models. The fraction of galaxies with red colors also shows a gentle increase towards the cluster centers: . The mean color of Herschel-detected cluster members, , is also slightly redder than the mean color of Herschel-detected non-members (defined as lying outside the caustics, but within ), . Both of these correlations point to a physical origin for these red colors, rather than systematic photometric errors. Indeed, Rawle et al. (2010) find a similar population in the core of the Bullet cluster. However the small difference between the color distributions of members and non-members suggest that cluster physics may not be the main determinant of the IR colors (see also Pereira et al. 2010).
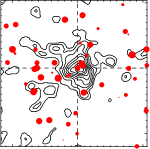
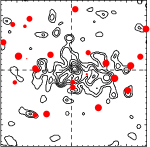
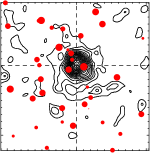
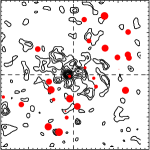
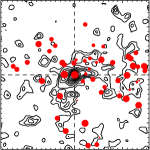
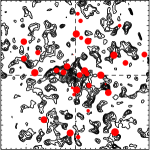
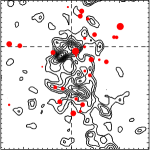
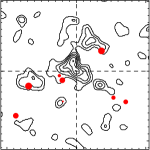
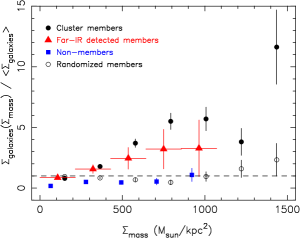
The IR luminous population traces the structure of the mass distribution of the clusters and the surrounding filamentary structure, as traced by Ok10’s weak-lensing mass maps (Fig. 4). This is quantified using the number density of galaxies (normalized to the mean galaxy number density in each case) as a function of projected cluster mass density obtained from the mass maps (Fig. 4). A spatially random distribution of galaxies is consistent with unity; positive correlation between galaxies and mass is greater than unity, and anti-correlation is less than unity. We detect correlation between the spatial distribution of the IR luminous cluster members and the cluster mass distributions at significance.
We also combine the Herschel data with Ok10’s weak-lensing analysis to construct the first ever mass- relation for galaxy clusters (Fig. 3), obtaining , with . The fit was done taking into account errors in both variables, and was repeated times, each time drawing 8 clusters at random with replacement; the error quoted on the slope is dominated by the scatter between these bootstrap samples. The mass-to-light ratio of a cluster is , however the scaling of mass with far-IR luminosity is inconsistent with a constant mass-to-light ratio at .
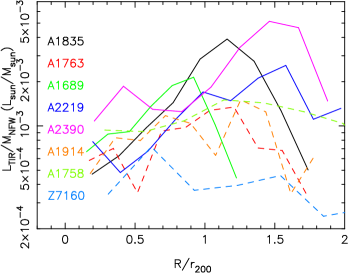
Cluster IR luminosity density profiles, normalized to the underlying dark matter density profile from Ok10, are generally increasing functions of clustercentric radius out to at least (Fig. 3). IR luminosity in excess of that expected from a flat mass-to-light ratio profile is therefore found at large clustercentric radii, particularly at , where some of the profiles show a pronounced peak. We also note that strong-lensing clusters (A 1835, A 1689, A 2219, A 2390) tend to have steeper mass-normalized luminosity density profiles than non-strong-lensing clusters, three of which are well-known merging clusters (A 1763, A 1758, A 1914) in which the merger axis is likely close to the plane of the sky. Cluster geometry, e.g. prolate shape and/or merger aligned with the line of sight (strong-lensing clusters) versus aligned in the plane of the sky, therefore may complicate the detailed interpretation of the luminosity density profile shapes.
5 Summary and Discussion
We have presented an initial broad-brush analysis of Herschel/PACS observations of of our sample of 30 galaxy clusters at , and combined these data with our existing Spitzer, Subaru, Chandra, UKIRT, and MMT data. The main analysis concentrates on a sample of 192 spectroscopically confirmed cluster members with , , . The average -band luminosity of these galaxies fades by a factor of almost 2 from the cluster outskirts () to the cluster cores (), although the average specific star-formation rate, as probed by , is constant across most of this radial range (), before jumping by 25% on smaller scales. This suggests that as gas rich galaxies fall into the clusters (typically in groups – Fig. 1) ongoing star-formation stops first in the most massive galaxies. As galaxies reach the cluster cores physical processes that operate in high density environments, for example ram pressure stripping and harrassment, then appear to trigger a final episode of star-formation that presumably exhausts the remaining gas supply.
This picture is consistent with our comparison of the Herschel-detected cluster members with the cluster mass distributions, as probed by Okabe et al.’s (2010) weak-lensing analysis. First, the spatial distribution of the Herschel sources is positively correlated with the structures in the weak-lensing mass maps at significance, with the strongest signal seen at intermediate, group-like densities. Second, the strong dependence of the total cluster IR luminosity on cluster mass () is consistent with accretion of galaxies and groups of galaxies driving the cluster IR luminosity. This is because, assuming that IR galaxy mass-to-light ratios are independent of the cluster mass, the scaling relation can be understood as stemming from the dependence of the substructure mass function seen in theoretical models (e.g. Taylor & Babul 2005). Third, the IR luminosity density profiles of the clusters generally increase to large radii, with some clusters showing a peak at . This is qualitatively consistent with the enhanced star-formation rates seen in in-falling galaxy populations by Moran et al. (2005).
The most surprising result is that roughly half of the Herschel-detected cluster galaxies have excess flux at over that predicted from current SED models. Cluster members are redder than non-members, and we find a shallow trend of increasing fraction of red IR galaxies towards the cluster centers, both of which suggest that this is a physical effect and not caused by systematic photometric uncertainties. This result will be the focus of more detailed future investigation.
Finally, we note that, contrary to previous speculation in the literature, we do not find a strong relationship between cluster IR luminosity and cluster dynamical state. Observations of the full sample will allow us to investigate this issue in more detail.
Acknowledgements.
We acknowledge the anonymous referee for helping us to clarify various aspects of this letter. We thank our colleagues within the LoCuSS collaboration for many stimulating discussions, and their enthusiastic support. GPS is supported by the Royal Society. CPH and AJRS thank STFC for some support. Support for this work was provided by NASA through an award issued by JPL/Caltech. YYZ is supported by the German BMBF through the Verbundforschung under grant 50 OR 1005.References
- (1) Bai et al., 2009, ApJ, 693, 1840
- (2) Böhringer et al., 2004, A&A, 425, 367
- (3) Doyon & Joseph, 1989, MNRAS, 239, 347
- (4) Dressler A., et al., 1997, ApJ, 490, 577
- (5) Ebeling et al., 1998, MNRAS, 301, 881
- (6) Ebeling et al., 2000, MNRAS, 318, 333
- (7) Edge A.C., et al., 1999, MNRAS, 306, 599
- (8) Egami E., et al., 2006, ApJ, 647, 922
- (9) Fabricant D., et al., 2005, PASP, 117, 1411
- (10) Fadda D., et al., 2008, ApJ, 672, 9
- (11) Geach J., et al., 2006, ApJ, 649, 661
- (12) Gunn & Gott, 1972, ApJ, 176, 1
- (13) Haines C. P., et al., 2009, MNRAS, 396, 1297
- (14) Haines C. P., et al., 2009, ApJ, 704, 126
- (15) Haines C. P., et al., 2010, this volume
- (16) Leggett S., et al., 1987, MNRAS, 228, 11
- (17) Kodama T., et al., 2004, MNRAS, 354, 1103
- (18) Lin Y., et al., 2004, ApJ, 610, 745
- (19) McCarthy I., et al., 2008, MNRAS, 383, 593
- (20) Metcalfe, et al., 2005, SSRv, 119, 425
- (21) Miller et al., 2006, AJ, 131, 2426
- (22) Moore B., et al., 1999, MNRAS, 304, 465
- (23) Moran S. M., et al., 2005, ApJ, 634, 977
- (24) Moran S. M., et al., 2006, ApJ, 641, 97
- (25) Moran S. M., et al., 2007, ApJ, 671, 1503
- (26) Okabe N. & Umetsu K., 2008, PASJ,
- (27) Okabe N., et al., 2010, arXiv:0903.1103
- (28) Ott, S., 2010, in ASP Conference Series, Astronomical Data Analysis Software and Systems XIX, Y. Mizumoto, K.-I. Morita, and M. Ohishi, eds., in press
- (29) Pereira M. J., et al., 2010, this volume
- (30) Pilbratt et al., 2010, this volume
- (31) Poggianti B. & Wu, 2000, ApJ, 529, 157
- (32) Pogtlitsch, et al., 2010, this volume
- (33) Popesso, P., et al., 2005, A&A, 433, 431
- (34) Postman M., et al., 2005, ApJ, 623, 721
- (35) Rawle T. D., et al., 2010, this volume
- (36) Richard J., et al., 2010, MNRAS, 404, 325
- (37) Rieke G. H., et al., 2009, ApJ, 692, 556
- (38) Sanderson A. J. R., et al., 2009, MNRAS, 398, 1698
- (39) Smith G. P., et al., 2005, ApJ, 620, 78
- (40) Taylor & Babul, 2005, MNRAS, 364, 515