LoCuSS: A Herschel view of obscured star formation
in Abell 1835††thanks: Herschel is an ESA space observatory with science instruments provided by European-led Principal Investigator consortia and with important participation from NASA.
We present Herschel/PACS, MMT/Hectospec and XMM-Newton observations of Abell 1835, one of the brightest X-ray clusters on the sky, and the host of a strong cool core. Even though Abell 1835 has a prototypically “relaxed” X-ray morphology and no signs of ongoing merger activity in strong- and weak-lensing mass maps, it has a complex velocity distribution, suggesting that it is still accreting significant amounts of mass in the form of smaller satellite systems. Indeed, we find strong dynamical segregation of star-forming dusty galaxies from the optically selected cluster population. Most Herschel sources are found close to the virial radius of the cluster, and almost a third appear to be embedded within a filament feeding the cluster from the SW. We find that the most luminous infrared galaxies are likely involved in galaxy-galaxy interactions that may have triggered the current phase of star formation.
Key Words.:
Galaxies: clusters: individual: A1835 – Galaxies: evolution – Galaxies: star formation – Infrared: galaxies1 Introduction
Galaxy clusters have long been thought of as particularly active sites of galaxy evolution (Dressler 1980). Early optical studies suggested that clusters affect stellar populations in infalling substructure mainly by turning off star formation as galaxies encounter the dense cluster environment (Lewis et al. 2002). However, when these same objects were observed in the infrared by IRAS, ISO and Spitzer, a significant fraction of cluster galaxies was revealed to contain heavily obscured sites of star formation (see e.g. Metcalfe et al. (2005) and references therein). When this obscured activity is accounted for, clusters emerge as environments where star formation is both quenched and induced, perhaps even at different stages of the same physical process. Some studies have claimed to observe triggered star formation in strongly disrupted, merging clusters (e.g. Geach et al. 2006) but the intrinsic scatter in this correlation is large, with some seemingly relaxed clusters presenting much higher star formation activity than their actively merging counterparts (Haines et al. 2009).
Many studies in recent years have attempted to separate cluster samples into two distinct populations: merging clusters vs clusters that are dynamically relaxed. The global properties of the latter are expected to be tightly correlated with mass, and therefore directly relatable to statistical predictions from cosmological models.
While there is evidence that some X-ray cluster properties may in fact be bimodal, e.g. with respect to the presence or absence of a cool core (Sanderson et al. 2009), cosmological simulations have shown that even the most relaxed cool core clusters can still be accreting significant amounts of mass (Poole et al. 2008), at a mean rate which is approximately linearly proportional to the mass of the system (McBride et al. 2009). Generally, only the most massive of these accretion events (mass ratios ) are expected to disturb the dense cluster core. Massive cool core clusters can thus quietly accrete a significant fraction of their total mass without large disturbances to their central ICM, which makes them arguably “cleaner” targets for studies of cluster galaxy evolution.
The Local Cluster Substructure Survey (LoCuSS111http://www.sr.bham.ac.uk/locuss) Herschel key programme (Smith 2010) was designed to probe dusty star-forming galaxies in the infall regions of a sample of 30 galaxy clusters () spanning a wide range of mass and merging histories.
Abell 1835 is the most X-ray luminous cluster in this sample ( ergs/s (Zhang et al. 2008)) and the host of a strong cool core (Peterson et al. 2001). Its strong- and weak-lensing derived mass distributions (Richard et al. 2010; Okabe et al. 2010), and X-ray morphology (Smith et al. 2005) are typical of undisturbed (i.e. non-merging) cool core clusters. For example, the low substructure mass fraction in its core () suggests that it has grown in mass by in the previous few Gyr (Smith & Taylor 2008).
In this Letter, we focus on a sample of -selected spectroscopically confirmed cluster galaxies in Abell 1835. We use the Photodetector Array Camera and Spectrometer (PACS) (Poglitsch 2010) on the Herschel satellite (Pilbratt 2010) to measure far infrared fluxes and from these we estimate total infrared luminosities for these objects. We then use these data to examine the spatial and velocity distribution of obscured star formation sites in Abell 1835. We assume km s. All virial masses and radii are stated with respect to the virial overdensity, (Bryan & Norman 1998).
2 Observational data
PACS data were obtained in scan map mode on December 24th 2009, at both 100 and 160m. The details of the observing mode, data reduction procedure and source extraction and photometry can be found in (Smith 2010). The completeness flux limits are 21mJy at 100m (86 sources) and 28 mJys at 160m (91 sources).
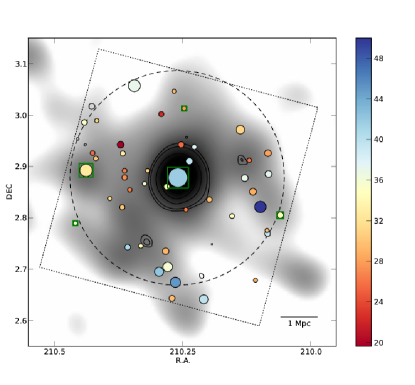
We conducted a wide-field spectroscopic survey of this field with Hectospec at MMT in February 2009, confirming cluster membership of galaxies (Hardegree-Ullman et al., in prep.). In addition, Czoske (2004) obtained redshifts for 630 cluster members with VIMOS/VLT, bringing the total number of unique redshifts for this cluster to 851. This extensive spectroscopic coverage means that, out of 91 Herschel detections with mJy, 64 have redshifts, of which 33 lie within km/s of the cluster redshift. The total number of spectroscopically confirmed cluster galaxies with detections in both 100m and 160m bands is 45, and we plot their location in Fig. 1.
X-ray maps can be used both to separate the AGNs from the starburst galaxies and to identify galaxy groups around clusters, and we have analysed the XMM observation ID 0147330201 to characterize the X-ray appearance of A1835. We decompose the 0.5-2 keV combined XMM image into unresolved and extended emission, following the wavelet technique of Finoguenov et al. (2009), before extracting point source fluxes at the locations of Herschel sources. Additionally, we make use of previously published wide-field data from Spitzer/MIPS 24m and UKIRT/WFCAM J,K bands(Haines et al. 2009), and Subaru/Suprime-CAM (Okabe et al. 2010).
3 Results
3.1 Infrared luminosities, temperatures and SFRs
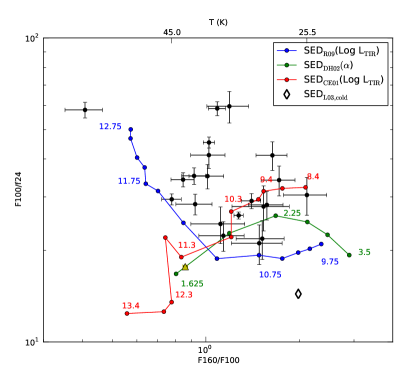
At the redshift of the cluster, , the PACS 100 and 160m bands are expected to straddle the peak of the spectral energy distribution for sources with dust temperatures of T K. The 160m/100m color should thus be sensitive to dust temperature differences, with redder objects having cooler dust components. We plot observed 160m/100m vs 100m/24m colors for the sources in our cluster in Fig. 2, and overplot the synthetic colors from commonly used templates from the literature: Rieke et al. 2009 (R09), Dale & Helou 2002 (DH02), Lagache et al. 2003 (L03), Chary & Elbaz 2001 (CE01). All the SED templates are poor representations of these galaxies, which appear too red in their 100m/24m colors. The CE01 templates appear to fit the colors of of the sample, but with templates corresponding to total infrared luminosities that are one to two orders of magnitude fainter than the actual measured luminosities – see Smith (2010) and Rawle (2010) for a more extended discussion of this excess.
We estimate total infrared luminosities, , for these galaxies in two ways: first, we fit the CE01 templates (redshifted to the cluster rest-frame) to the 24, 100 and 160 m emission and integrate the best-fit spectrum, normalized to the observed fluxes, from rest-frame 3-1100m. In order to obtain estimates for the dust temperatures in these systems, we also fit a modified blackbody spectrum to the 100m and 160m emission: , where is the Planck function, and is the frequency-dependent optical depth, . We assume as the emissivity power law index, and THz as the frequency at which the emission becomes optically thick, but note that the integrated luminosity depends very weakly on the values assumed for and , while the best fit temperature varies at most by . The derived from the blackbody fits are systematically lower than the ones obtained from the best-fit templates by a factor of , since they underestimate the mid-IR contribution to the total IR flux. The cluster members range in LTIR from , and all but one have dust temperatures in the range K.
The BCG is much brighter than the rest of the galaxies in the cluster, with fluxes of mJy (160m) and 297.83.1 mJy (100m) and an estimated of , consistent with previous Spitzer/MIPS observations of Abell 1835 (Egami et al. 2006). We derive star formation rates from the combined Hα (from our spectroscopic measurements) and LTIR emission using the following relation from Kennicutt et al. (2009): . This yields SFRs in the range: 2–20 for the general cluster population. The BCG’s high luminosity and special location at the center of a massive cool core separate it from the rest of the cluster population and we therefore exclude it from the subsequent analysis.
We find that, of all galaxies with far-infrared emission detected by Herschel, only 2 have X-ray counterparts down to L ergs s-1, which is below the classical ergs s-1 threshold for AGN definition. Only four galaxies (including the couple of X-ray point sources) in the sample are spectroscopically classified AGN according to their position in the classic BPT diagram (Baldwin et al. 1981), defined by the emission line flux ratios of [NII] 6587/Hα versus [OIII] 5007/Hβ. We thus conclude that the bulk of the infrared luminous population is being heated by star formation and not an active nucleus, and we exclude the 4 likely AGN from our analysis.
3.2 Probing the environments of obscured star formation
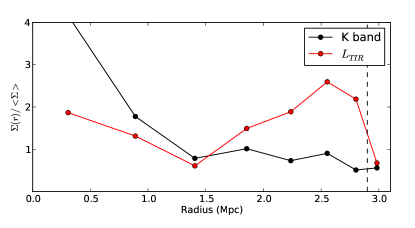
It is apparent from Fig. 1 that, apart from the BCG, there are few luminous infrared galaxies in the central regions of the cluster. In fact, the radial surface density profiles in Fig. 3 show that most of the infrared luminosity is concentrated at large (Mpc) radial distances, which is not the case for the K-band luminosity density which, as an approximate tracer of stellar mass, declines smoothly with radius.
Upon closer inspection, however, it is clear that this overdensity at the virial radius does not occur isotropically around the cluster, but rather peaks along specific directions. The velocity distribution of K-band selected cluster galaxies (black line in Fig. 4) is distinctly non-Gaussian, and shows signs of significant substructure. The most luminous infrared sources, located toward the south of the cluster, are dynamically segregated from the rest of the cluster population, clustering around an elongated structure in the foreground ( km/s) of the cluster, which is also traced out in the K-band luminosity density maps (see Fig. 1). A gradient is observed in the velocities projected along the axis of elongation, where the relative velocity with respect to the cluster center progressively decreases as the inner region of the cluster is approached.
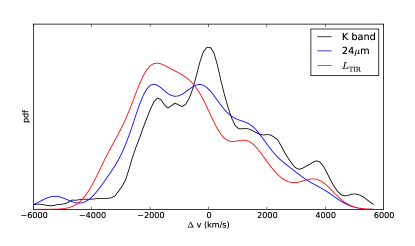
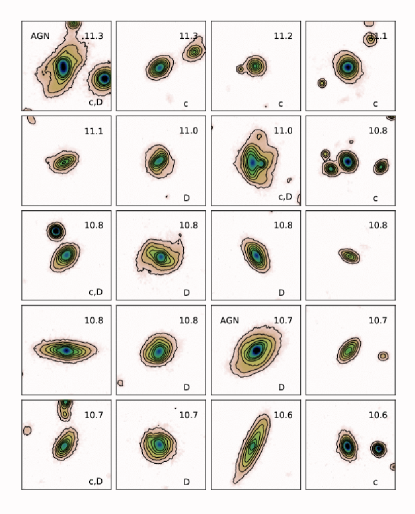
Figure 5 shows Subaru -band cutouts of the most luminous infrared galaxies, in decreasing order of . Many galaxies appear to have undergone recent interactions - half of them have close companions, and half present distorted morphologies indicative of recent merging. We can attempt to quantify the importance of mergers in our small sample by comparing the fraction, , of Herschel sources with close ( kpc and km/s) companions to that of a population of non-IR luminous cluster galaxies that has been matched, both in K-band luminosity and radial distance from the cluster center, to the IR luminous sample (excluding in both samples all identified AGNs). We find that, while the total sample of IR luminous galaxies is indistinguishable from the matched sample of IR faint galaxies ( vs , respectively), the IR bright () galaxies in Abell 1835 are marginally more likely to have a close neighbour ( vs in the respective matched sample).
4 Summary and discussion
Star formation can be triggered by several different physical processes prevalent in clusters and their infall regions; disentangling these effects is one of the main aims of the LoCuSS Herschel key programme. The most promising candidates, ICM ram pressure, galaxy mergers, and galaxy harassment can all perturb the ISM to produce a new generation of stars, but the relative importance of these processes is a strong function of clustercentric radius (c.f. Fig. 1 in Smith (2010)). The location of the peak of IR luminosity density just inside the virial radius of Abell 1835 suggests that merging may be driving the bulk of the star formation in these galaxies. This interpretation is corroborated by the large fraction of disturbed morphologies in the infrared luminous sample, and also by our preliminary analysis of their local environment: when compared to a matched sample of galaxies with no detectable infrared emission, infrared bright galaxies are more likely to have close neighbours, although the larger sample of 30 LoCuSS clusters should be used to confirm this correlation.
The density profile for Abell 1835 is not spherically symmetric: the brightest galaxies are clustered together in an elongated structure towards the south of the cluster that is dynamically segregated from the rest of the cluster. The structure’s K-band morphology and velocity gradient toward the cluster core suggests that these galaxies may be embedded within a filament that is still currently feeding the cluster with new, actively star forming galaxies.
XMM imaging of this field reveals the presence of two groups in the outskirts of Abell 1835 (see contours in Fig. 1), one of which appears to be embedded in the filament that is also feeding the bright LIRGs into the cluster. The group is dominated by a large (LL) elliptical galaxy with no detectable Herschel emission.
The two groups have X-ray luminosities of and ergs s-1 (0.1-2.4 keV), from which we estimate masses, using the weak lensing calibration of the relation of Leauthaud et al. (2010), of and respectively. Together these amount to 1/10th of the mass of the central cluster, reinforcing the view that Abell 1835 continues to grow by feeding on smaller systems from the surrounding large scale structure.
Acknowledgements.
We thank our colleagues in the LoCuSS collaboration for stimulating discussions. This work is based in part on observations made with Herschel, a European Space Agency Cornerstone Mission with significant participation by NASA. Support for this work was provided by NASA through an award issued by JPL/Caltech. CPH thanks STFC for support. GPS is supported by the Royal SocietyReferences
- Baldwin et al. (1981) Baldwin, J. A., Phillips, M. M., & Terlevich, R. 1981, PASP, 93, 5
- Bryan & Norman (1998) Bryan, G. L. & Norman, M. L. 1998, ApJ, 495, 80
- Chary & Elbaz (2001) Chary, R. & Elbaz, D. 2001, ApJ, 556, 562
- Czoske (2004) Czoske, O. 2004, in IAU Colloq. 195: Outskirts of Galaxy Clusters: Intense Life in the Suburbs, ed. A. Diaferio, 183–187
- Dale & Helou (2002) Dale, D. A. & Helou, G. 2002, ApJ, 576, 159
- Dressler (1980) Dressler, A. 1980, ApJ, 236, 351
- Egami et al. (2006) Egami, E., Misselt, K. A., Rieke, G. H., et al. 2006, ApJ, 647, 922
- Finoguenov et al. (2009) Finoguenov, A., Connelly, J. L., Parker, L. C., et al. 2009, ApJ, 704, 564
- Geach et al. (2006) Geach, J. E., Smail, I., Ellis, R. S., et al. 2006, ApJ, 649, 661
- Haines et al. (2009) Haines, C. P., Smith, G. P., Egami, E., et al. 2009, ApJ, 704, 126
- Kennicutt et al. (2009) Kennicutt, R. C., Hao, C., Calzetti, D., et al. 2009, ApJ, 703, 1672
- Lagache et al. (2003) Lagache, G., Dole, H., & Puget, J. 2003, MNRAS, 338, 555
- Leauthaud et al. (2010) Leauthaud, A., Finoguenov, A., Kneib, J., et al. 2010, ApJ, 709, 97
- Lewis et al. (2002) Lewis, I., Balogh, M., De Propris, R., et al. 2002, MNRAS, 334, 673
- McBride et al. (2009) McBride, J., Fakhouri, O., & Ma, C. 2009, MNRAS, 398, 1858
- Metcalfe et al. (2005) Metcalfe, L., Fadda, D., & Biviano, A. 2005, Space Science Reviews, 119, 425
- Okabe et al. (2010) Okabe, N., Takada, M., Umetsu, K., Futamase, T., & Smith, G. P. 2010, PASP accepted [0903.1103]
- Peterson et al. (2001) Peterson, J. R., Paerels, F. B. S., Kaastra, J. S., et al. 2001, A&A, 365, L104
- Pilbratt (2010) Pilbratt, e. a. 2010, this volume
- Poglitsch (2010) Poglitsch, e. a. 2010, this volume
- Poole et al. (2008) Poole, G. B., Babul, A., McCarthy, I. G., Sanderson, A. J. R., & Fardal, M. A. 2008, MNRAS, 391, 1163
- Rawle (2010) Rawle, e. a. 2010, this volume
- Richard et al. (2010) Richard, J., Smith, G. P., Kneib, J., et al. 2010, MNRAS, 313
- Rieke et al. (2009) Rieke, G. H., Alonso-Herrero, A., Weiner, B. J., et al. 2009, ApJ, 692, 556
- Sanderson et al. (2009) Sanderson, A. J. R., Edge, A. C., & Smith, G. P. 2009, MNRAS, 398, 1698
- Smith (2010) Smith, e. a. 2010, this volume
- Smith et al. (2005) Smith, G. P., Kneib, J., Smail, I., et al. 2005, MNRAS, 359, 417
- Smith & Taylor (2008) Smith, G. P. & Taylor, J. E. 2008, ApJ, 682, L73
- Zhang et al. (2008) Zhang, Y., Finoguenov, A., Böhringer, H., et al. 2008, A&A, 482, 451