LoCuSS: Shedding New Light on the Massive Lensing Cluster Abell 1689 – The View from Herschel††thanks: Herschel is an ESA space observatory with science instruments provided by European-led Principal Investigator consortia and with important participation from NASA.
We present wide-field Herschel/PACS observations of A 1689, a massive galaxy cluster at , from our Open Time Key Programme. We detect 39 spectroscopically confirmed 100m-selected cluster members down to . These galaxies are forming stars at rates in the range 1–10 M⊙/yr, and appear to comprise two distinct populations: two-thirds are unremarkable blue, late-type spirals found throughout the cluster; the remainder are dusty red sequence galaxies whose star formation is heavily obscured with A mag and are found only in the cluster outskirts. The specific-SFRs of these dusty red galaxies are lower than the blue late-types, suggesting that the former are in the process of being quenched, perhaps via pre-processing, the unobscured star formation being terminated first. We also detect an excess of 100m-selected galaxies extending Mpc in length along an axis that runs NE-SW through the cluster center at 5% confidence. Qualitatively this structure is consistent with previous reports of substructure in X-ray, lensing, and near-infrared maps of this cluster, further supporting the view that this cluster is a dynamically active, merging system.
Key Words.:
galaxies: clusters: individual (Abell 1689) – galaxies: evolution – galaxies: star formation – infrared: galaxies1 Introduction
Over the last 30 years a large body of evidence has formed that star formation in cluster galaxies is much lower than in the surrounding field (e.g. Lewis et al. lewis (2002)). A variety of mechanisms have been proposed to quench star formation in infalling spirals such as ram-pressure stripping or harassment (see Haines et al. haines07 (2007) for a review), but the key distinguishing evidence remains elusive. However most of these studies rely on optical spectroscopy using H or the [Oii] emission lines (e.g. Poggianti et al. pog99 (1999)). Recent mid-infrared based studies with ISO and then Spitzer (e.g. Metcalfe et al. metcalfe (2005); Coia et al. coia (2005); Geach et al. geach06 (2006); Saintonge et al. saintonge (2008)) have revealed a significant population of dusty cluster galaxies whose star formation is heavily obscured at optical wavelengths, leading to [Oii]-based SFRs underestimating the true level by 0–3 (Duc et al. duc (2002)), while the age-dependence of the dust obscuration can lead to dusty star-bursts being in fact classified spectroscopically as post-starburst galaxies (Poggianti & Wu poggianti (2000)).
Clusters are not isolated systems, but lie at the intersections of filaments, constantly accreting galaxies and galaxy groups along these filaments or directly from the field, and various studies suggest that the key sites of galaxy transformation are within these infalling structures rather than the cluster core (e.g. Balogh et al. balogh04 (2004); Moran et al. moran (2005); Fadda et al. fadda08 (2008)).
These issues have motivated the Local Cluster Substructure (LoCuSS111http://www.sr.bham.ac.uk/locuss) Herschel Key Programme to study a large statistical sample of 30 massive galaxy clusters at with panoramic FUV–FIR data from GALEX, Spitzer and Herschel (Haines et al. 2009a ; Smith et al. smith10 (2010)). These provide a complete census of star formation in cluster galaxies extending to the infall regions, which can then be related to the dynamical status of the cluster as determined from complementary lensing, X-ray and dynamical analyses (Haines et al. 2009b ; Pereira et al. pereira (2010)).
In this letter we present an analysis of the Herschel (Pilbratt et al. pilbratt (2010)) FIR imaging of Abell 1689 at , one of the first clusters studied in the infrared with ISO (Fadda et al. fadda00 (2000); Balogh et al. balogh (2002), hereafter B02; Duc et al. duc (2002), hereafter D02). Abell 1689 has many characteristics of a dynamically relaxed cluster, with a regular and highly symmetric X-ray morphology (Xue & Wu xue (2002)), the centroid of which coincides both with the brightest cluster galaxy and the centre of mass derived from strong lensing (Limousin et al. limousin (2007)). However, the significant discrepancies obtained between mass estimates derived from strong lensing and X-ray analyses (Andersson & Madejski andersson (2004)), the very high concentration value observed for the cluster, and its large () Einstein radius, all strongly favour a triaxial model in which the cluster is aligned along the line-of-sight (Oguri et al. oguri (2005); Corless, King & Clowe corless (2009)). Moreover, a substructure comprising 5% of the total cluster mass (Riemer-Sørensen et al. riemer (2009)) 1.5–2′ to the NE of the cluster centre has been identified from dynamical, X-ray and strong lensing analyses (Czoske czoske (2004); Andersson & Madejski andersson (2004); Limousin et al. limousin (2007)), while Kawaharada et al. (kawaharada (2010), hereafter K10) find evidence for an accreting filament on 10–18 arcmin scales.
We present the data in §2, results in §3, and summary and discussion in §4. Throughout we assume a cosmology with , and H km s-1 Mpc-1.
2 Data
A field of centred on Abell 1689 was mapped with the Photodetector Array Camera and Spectrometer (PACS; Poglitsch et al. poglitsch (2010)) at 100m and 160m in scan map mode on 23 December 2009. The images were reduced using hipe (Ott ott (2010)) and sources detected using SExtractor (Bertin et al. bertin (1996)) with 100 and 160m fluxes estimated using fixed circular apertures of diameter 12 and 16 arcsec respectively. The resulting catalogues are 90% complete at 18 mJy at 100m and 28 mJy at 160m. For more details see Smith et al. (smith10 (2010)).
The same field had been observed at 24m with Spitzer/MIPS to a sensitivity of 400Jy (Haines et al. 2009a ). Stellar masses and optical/NIR absolute magnitudes of cluster galaxies were determined from Sloan Digital Sky Survey and UKIRT/WFCAM -band photometry. A mosaic of 15 Hubble Space Telescope WFPC2 F616W+F814W images from B02 cover the central region, from which B02 and D02 obtained morphological classifications of the cluster galaxies.
Over March–May 2009 we obtained 1006 spectra with MMT/Hectospec, targeting probable cluster members (based on their and colour as in Haines et al. 2009a ) with over the full WFCAM field, prioritising those detected at 24m, and giving the highest priority to all sources with mJy (irrespective of their NIR colour), identifying 387 cluster members. A1689 already had extensive spectroscopic coverage, most notably from Czoske (czoske (2004)) and the survey of ISOCAM detections by D02, taking us up to a total of 989 unique cluster members. Via this strategy, we have redshifts for 75 of 83 Herschel detections with mJy, and 45 of 46 with mJy (the one remaining source appears to be at ).
For each Herschel detection we calculate the total infrared flux produced by summing together the Spitzer 24m and the two Herschel passbands, giving a global FIR measure, . The observed were compared to those predicted for each of the 9 luminosity-dependent infrared SEDs of Rieke et al. (rieke (2009)) for placed at the cluster redshift, and by interpolating between the two nearest SED models, obtain an estimate for the total infrared luminosity (5–1000m). For those sources not detected at 160m, the estimate of was made directly from . For A1689 our Herschel completeness limits correspond to . We note that our incomplete coverage over 5–80m, adjoint with an apparent 100m excess seen by Herschel (Pereira et al. pereira (2010); Rawle et al. rawle (2010); Smith et al. smith10 (2010)) in comparison to the model SEDs of Rieke et al. (rieke (2009)), could result in our values being overestimated by 10–20%. In total we detect 39 members of Abell 1689 with Herschel, with 100m fluxes and infrared luminosities in the range 10–156 mJy and 1.5–2 respectively.
We look for the AGN contribution to the Herschel cluster sources by matching to X-ray point-source catalogues from both XMM data that covers the entire Herschel map (K10) and deeper Chandra data covering the cluster core to 0.5–8 keVerg s-1 (Gilmour et al. gilmour (2009)). Just three X-ray sources are members of A1689, two of which are radio-loud ellipticals with no detectable IR emission. The last (erg s-1), identified by D02 as a Seyfert, has mJy, but no corresponding Herschel detection. By measuring directly the pixel values at the galaxy’s location, we estimate mJy. We therefore conclude that all of the Herschel sources within A1689 are powered by star formation.
3 Results
3.1 Spatial distribution of star-forming galaxies
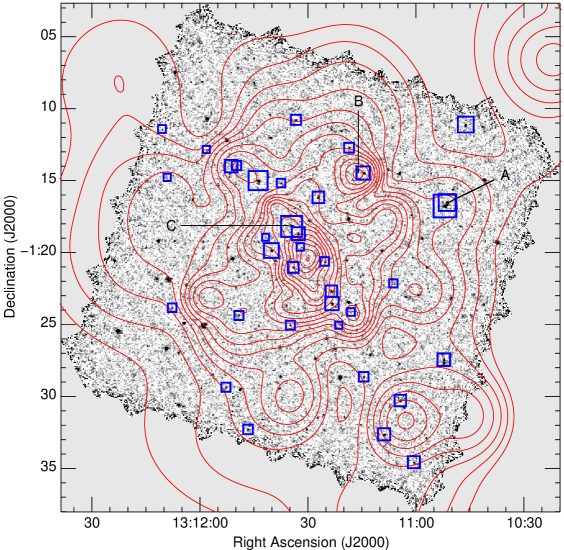
The Herschel/PACS 100m map is presented in Fig. 1, with the confirmed cluster members indicated by blue squares. The red contours instead show the -band light distribution of The cluster -band light is clearly elongated along the NE/SW direction on scales 2–10 arcmin, while a number of galaxy groups in the infall regions can also be identified. Many of the Herschel sources are also aligned along this same axis, forming an apparent filamentary structure extending over 6 Mpc across the full 100m map from the NE to the SW corner. Using the 2-dimensional Kolmogorov-Smirnov test (Fasano & Franceschini fasano (1987)) we find the spatial distribution of Herschel sources consistent with that of -band selected cluster galaxies (), but inconsistent with being uniformly distributed across the 100m map () or having a circularly symmetric distribution about the cluster centre (), confirming the apparent alignment of the Herschel sources.
B02 found the velocity distribution of the ISO-detected and emission-line galaxies in A1689 to be bimodal, avoiding the central velocity peak, and identified them as infalling. We thus investigate the dynamics of the Herschel-detected galaxies within A1689 by plotting the line-of-sight relative velocity versus clustercentric radius in the bottom-right panel of Fig. 1. Galaxies belonging to A1689 are demarcated by two clean caustics, forming the classic “trumpet”-shape flaring out to relative velocities of 000 km s-1, and allowing easy identification of the cluster population. Most of the Herschel galaxies lie along or adjacent to these caustics indicative of an infalling population (Regős & Geller regos (1989)), consistent with B02 and Lemze et al. (lemze (2009)) who find the velocity anisotropy profile for A1689 to become predominately radial at Mpc. This fits with Biviano & Katgert (biv04 (2004)) who show that late-type/emission-line cluster galaxies are on mostly radial profiles and are absent for .
3.2 Morphologies and star formation rates
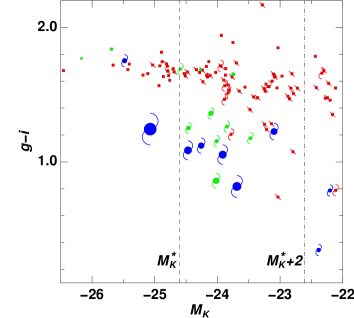
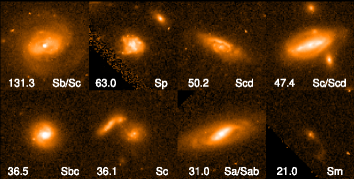
Figure 2 shows all eight Herschel-detected cluster galaxies within the HST mosaic of B02. All are unremarkable spirals, barring one low-mass merger. It is notable that these are largely late-type spirals (Sbc or later) as opposed to the early-type spirals (Sab or earlier) identified by Geach et al. (2009) as LIRGs in Cl 0024+16 at , and hence it seems unlikely we are seeing the same populations at differing epochs. In Figure 3 we plot versus for the cluster galaxies within the HST mosaic. The “red sequence” is dominated early-types (E/S0s), but those spirals found on the red sequence are mostly IR-dim, indicating that their red colour is due to lack of star-formation rather than dust extinction. Instead, the vast majority of the star-forming spirals identified by Herschel and Spitzer lie in the blue cloud, indicating that, at least in the cluster core, the identification of red sequence and blue cloud populations with passive and star-forming galaxy populations is largely valid in the infrared.
We used the star formation rate (SFR) calibration of Calzetti et al. (calzetti (2010)), which uses m) and to measure the obscured and unobscured components of star formation in a galaxy. The H luminosities of each galaxy were obtained using Eq. 5 from Hopkins et al. (hopkins (2003)), which combines the EW(H) with as the measure of the global continuum flux. We obtain SFRs in the range 1–10 M (assuming a Kroupa IMF), consistent with the ISO-based values of D02.
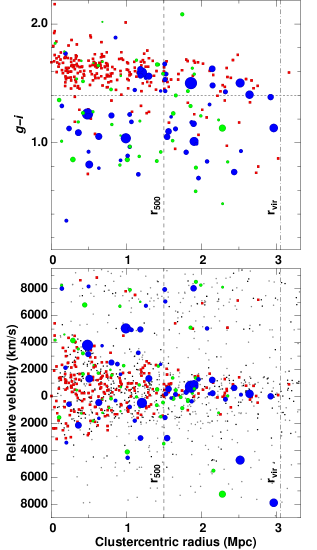
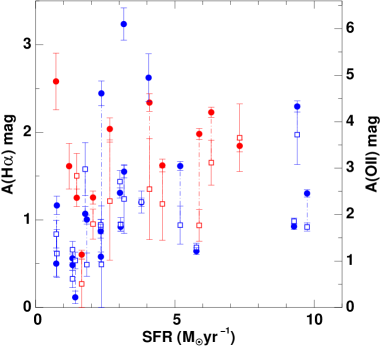
In Fig. 4 we plot the obtained SFRs and A(H) estimates for the cluster Herschel sources, in which the levels of extinction are derived either from the relative contribution of the H and 24m emission to the SFR estimator (solid circles), or the Balmer decrement measured from the optical spectrum (open squares). We identify two largely distinct populations of star-forming galaxies: the blue cloud population (; blue symbols) in which the level of extinction is close to the canonical 1 mag often used to correct H fluxes; and a dusty red population in which the star-formation is highly obscured with A(H mag, reddening the galaxy sufficiently for it to appear on the red sequence (; red symbols), although in all cases we detect significant H emission. For most galaxies we find the two methods for determining A(H) to be quite consistent, but we also identify a population of dusty red galaxies for which the Balmer decrement severely underestimates the level of obscuration (and hence the SFRs), demonstrating the need for mid/far-IR data to reveal the true nature of star formation in all galaxies.
4 Summary and Discussion
The results of the Herschel/PACS photometry can be interpreted to suggest a filament of star-forming galaxies feeding the cluster A1689 at from both sides. The direction of this filamentary structure coincides with the NE/SW axis of elongation of the cluster -band light, and the observed asymmetry/substructure seen on 1–2 arcmin scales in previous X-ray and strong lensing analyses. K10 found anisotropies in gas temperature and entropy distributions in the cluster outskirts (10–18′), with a high keV seen in the NE direction consistent with accretion flow along a filament, but low gas temperature ( keV) in all other directions. They also found evidence for a connecting large-scale structure ( deg) in the same NE direction in the form of SDSS galaxies with photometric redshifts consistent with the cluster. The 100m selection has made the filaments stand out clearly against the background and dense cluster region, in the same way as seen by Fadda et al. (fadda08 (2008)) for 24m sources in Abell 1763, due to the enhanced star-forming activity among the filament galaxies.
The SFRs of the Herschel sources in A1689 are in the range 1–10 M, much lower than the 20–40 M seen by Geach et al. (geach06 (2006), geach (2009)) for LIRGs in the rich cluster Cl 0024+16 at . If this star formation is to build the bulges needed to turn the spirals infalling into clusters at into the S0s found in local clusters it would require 1–3 Gyr at the SFRs observed here and in other clusters (Smith et al. smith10 (2010)), rather than the yr implied by Geach et al. (geach (2009))’s results.
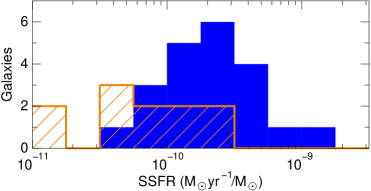
We find two populations of Herschel sources in A1689, analogous to the blue cloud and dusty-red galaxies identified by Wolf et al. (wolf05 (2005),wolf09 (2009)) in A901/2, and we find similar EW(Oii), EW(H) and specific-SFRs to them. In particular, for the dusty red galaxies we obtain EW(Oii)Å, due to having A(Oii mag placing them on the k+a/e(a) boundary, yet their specific-SFRs are systematically lower than those of the blue cloud population (Fig. 5), suggesting that they are currently being quenched. Whereas the “blue cloud” population are found throughout the cluster, the “dusty red” galaxies are found only outside the cluster core ( Mpc), where they make up half of the star-forming galaxies detected by Herschel (Fig. 1; top-right). This is consistent with the findings of STAGES that the dusty red galaxies prefer the intermediate-density environment of cluster infall regions (Gallazzi et al. gallazzi (2009); Wolf et al. wolf09 (2009)), and morphologically they found % to be Sa/Sb spirals with a bright nucleus or inner bar/disk, as well as a few cases of interactions or merger remnants, suggestive of galaxy harassment, interactions or mergers for their origin.
Four of the brightest eight Herschel detections appear associated with groups: two are within a compact system of 3 galaxies ( km s-1; labelled A in Fig. 1); one within a km s-1 group (16 members; group B); and the last within the substructure identified by Czoske (czoske (2004); group C). These, plus similar results obtained by Pereira et al. (pereira (2010)) for Abell 1835, suggest that merger-induced starbursts and transformations in low-mass groups (pre-processing) could represent a significant contribution to the high-SFR cluster galaxy population, and an important evolutionary pathway for the formation of S0s. The availability of FUV–FIR imaging plus extensive spectroscopy for a sample of 30 clusters spanning the full range of morphologies and dynamical states within LoCuSS will allow us in future to estimate the relative fractions of infalling galaxies accreted by clusters from filaments, groups and the field, and measure the importance of pre-processing inside groups.
Acknowledgements.
CPH thanks STFC for support. GPS is supported by the Royal Society. Support for MJP and EE was provided by NASA through an award issued by JPL/Caltech.References
- (1) Andersson, K. E. & Madejski, G. M. 2004, ApJ, 607, 190
- (2) Balogh, M. L., et al. 2002, MNRAS, 335, 10 [B02]
- (3) Balogh, M. L., et al. 2004, MNRAS, 348, 1355
- (4) Bertin, E. & Arnouts, S. 1996, A&AS, 117, 393
- (5) Biviano, A. & Katgert, P. 2004, A&A, 779, 791
- (6) Calzetti, D., et al. 2010, ApJ, 714, 1256
- (7) Coia, D., et al. 2005, A&A, 431, 433
- (8) Corless, V. L., King, L. J. & Clowe, D. 2009, MNRAS, 393, 1235
- (9) Czoske, O. 2004, in IAU Colloq. 194, Outskirts of Galaxy Clusters: Intense life in the Suburbs, ed. A. Diaferio (Cambridge Univ. Press, Cambridge) 183
- (10) Duc, P.-A., et al. 2002, A&A, 382, 60 [D02]
- (11) Fadda, D., et al. 2000, A&A, 361, 827
- (12) Fadda, D., et al. 2008, ApJ, 672, L9
- (13) Fasano G., Franceschini, A., 1987, MNRAS, 225, 155
- (14) Gallazzi, A., et al. 2009, ApJ, 690, 1883
- (15) Geach, J. E., et al. 2006, ApJ, 649, 661
- (16) Geach, J. E., Smail, I., Moran, S. M., Treu, T. & Ellis, R. S. 2009, ApJ, 691, 783
- (17) Gilmour, R., Best P. & Almaini O. 2009, MNRAS, 392, 1509
- (18) Haines, C. P., et al. 2007, MNRAS, 381, 7
- (19) Haines, C. P., et al. 2009a, ApJ, 704, 126
- (20) Haines, C. P., et al. 2009b, MNRAS, 396, 1297
- (21) Hopkins, A. M., et al. 2003, ApJ, 599, 971
- (22) Kawaharada, M. et al. 2010, ApJ, 714, 423 [K10]
- (23) Lemze, D., et al. 2009, ApJ, 701, 1336
- (24) Lewis, I., et al. 2002, MNRAS, 334, 673
- (25) Limousin, M., et al. 2007, ApJ, 668, 643
- (26) Metcalfe, L., Fadda, D., Biviano, A. 2005, SSRv, 119, 425
- (27) Moran, S. M., et al. 2005, ApJ, 634, 977
- (28) Oguri, M., Takada, M., Umetsu, K. & Broadhurst, T. 2005, ApJ, 632, 841
- (29) Okabe, N., et al. 2010, PASP accepted, preprint (arXiv:0903.1103)
- (30) Ott, S. 2010, in ASP Conference Series, Astronomical Data Analysis Software and Systems XIX, eds. Y. Mizumoto, K.-I. Morita, & M. Ohishi, in press
- (31) Pereira, M. J., et al. 2010, this volume, preprint (arXiv:1005.3813)
- (32) Pilbratt, G., et al. 2010, this volume, preprint (arXiv:1005.5331)
- (33) Poggianti, B. M. et al. 1999, ApJ, 518, 576
- (34) Poggianti, B. M. & Wu, H. 2000, ApJ, 529, 157
- (35) Poglitsch, A. et al. 2010, this volume, preprint (arXiv:1005.1487)
- (36) Rawle, T. D., et al. 2010, this volume, preprint (arXiv:1005.3822)
- (37) Regős, E. & Geller M. J. 1989, AJ, 98, 755
- (38) Rieke, G. H., et al. D. 2009, ApJ, 692, 556
- (39) Riemer-Sørensen, S., et al. 2009, ApJ, 693, 1570
- (40) Saintonge, A., Tran K.-V. H., Holden, B. P. 2008, ApJ, 685, L113
- (41) Smith, G. P., et al. 2010, this volume, preprint (arXiv:1005.3816)
- (42) Wolf, C., Gray, M. E. & Meisenheimer, K. 2005, A&A, 443, 435
- (43) Wolf, C., et al. 2009, MNRAS, 393, 1302
- (44) Xue, S.-J. & Wu, X.-P. 2002, ApJ, 576, 152