Physical properties of the Sh2-104 H ii region as seen by Herschel††thanks: Herschel is an ESA space observatory with science instruments provided by European-led Principal Investigator consortia and with important participation from NASA.
Abstract
Context. Sh2-104 is a Galactic H ii region with a bubble morphology, detected at optical and radio wavelengths. It is considered the first observational confirmation of the collect-and-collapse model of triggered star-formation.
Aims. We aim to analyze the dust and gas properties of the Sh2-104 region to better constrain its effect on local future generations of stars. In addition, we investigate the relationship between the dust emissivity index and the dust temperature, .
Methods. Using Herschel PACS and SPIRE images at , , , and m we determine and throughout Sh2-104, fitting the spectral energy distributions (SEDs) obtained from aperture photometry. With the SPIRE Fourier transform spectrometer (FTS) we obtained spectra at different positions in the Sh2-104 region. We detect -ladders of 12CO and 13CO, with which we derive the gas temperature and column density. We also detect proxies of ionizing flux as the Nii and Ci transitions.
Results. We find an average value of throughout Sh2-104, as well as a difference between the photodissociation region (PDR, K) and the interior (K) of the bubble. We recover the anti-correlation between and dust temperature reported numerous times in the literature. The relative isotopologue abundances of CO appear to be enhanced above the standard ISM values, but the obtained value is very preliminary and is still affected by large uncertainties.
Key Words.:
stars: formation - ISM: dust,extinction - ISM: bubbles - ISM: H ii Regions - Infrared: ISM - ISM: individual: Sh2-1041 Introduction
Sharpless 104 (Sh2-104, Sharpless 1959) is an optically visible Galactic H ii region with a bubble morphology, excited by an O6V star (Crampton et al., 1978; Lahulla, 1985). It is located kpc from the Sun (Deharveng et al., 2003), with galactic coordinates (J2000).
Deharveng et al. (2003) proposed Sh2-104 as a strong candidate for massive triggered star formation through the collect-and-collapse process (Elmegreen & Lada, 1977). The ionized region is also visible at radio wavelengths (Fich, 1993), and an ultracompact (UC) H ii region, coincidant with the IRAS 20160+3636 source, lies at its eastern border (Condon et al. 1998).
We present new submm images and spectra taken towards Sh2-104 with the Herschel Space Observatory (Pilbratt et al., 2010). These observations allow us to map a wavelength range not easily accessed before, providing new insights into the dust and gas properties of Sh2-104.
2 Observations
The Herschel observations were taken on 2009 December 17 simultaneously with PACS (Poglitsch et al., 2010) and SPIRE (Griffin et al., 2010), as part of the guaranteed-time key-projects “Evolution of Interstellar Dust” of SPIRE (Abergel et al., 2010), and HOBYS of PACS (Motte et al., 2010). A region was imaged with PACS at and m (at resolutions of and ), and with SPIRE at , and m (at resolutions of , and ). Spectra were taken with the SPIRE-FTS long and short wavelength receivers (SLW and SSW, respectively) at seven different positions with sparse sampling, covering the m range. The resolution at the receivers’ central pixels varies between for SSW and for SLW. The data were reduced with the HIPE software version 2.0 with the latest standard calibration (Swinyard et al., 2010).
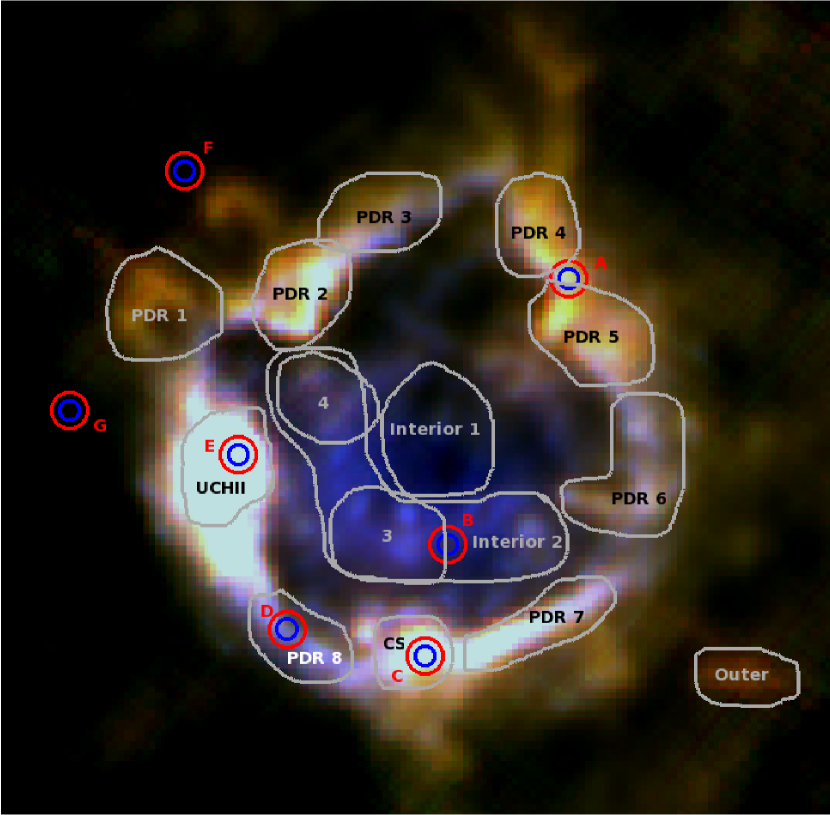
Figure 1 shows a color-composite image of Sh2-104 with PACS m (blue), SPIRE m (green) and SPIRE m (red). Different regions of interest, addressed in the following sections, are superimposed. We can see that the interior of the bubble is brighter in the PACS band, showing the hotter temperatures of the material in this region. On the other hand, outside the bubble the material is colder and emits stronger in the SPIRE bands.
3 Dust properties
We assume the dust emission in Sh2-104 can be modeled by an (optically thin) gray-body and that the emissivity of the dust grains can be fitted with a power law
| (1) |
where is the measured flux density at frequency , is the observing beam solid angle, is the Planck function for temperature at frequency , is the dust opacity, is the dust emissivity index, and is the dust column density (Hildebrand, 1983). The value of is believed to range between and , but is an open issue that is still discussed, as is its dependence on the dust temperature (see e.g., Ossenkopf & Henning 1994). Dupac et al. (2003) and Désert et al. (2008) found an inverse relationship between and . On the other hand, Shetty et al. (2009) suggested that this result arises from noise and the combination of multiple emission components along the line of sight.
| Region | Tdust (K) | Tdust (K) | |
|---|---|---|---|
| Free | |||
| CS | 25 3 | 1.5 0.3 | 25.5 0.9 |
| Interior 1 | 43 12 | 1.2 0.4 | 35.7 2.1 |
| Interior 2 | 39 9 | 1.3 0.3 | 33.5 1.7 |
| Interior 3 | 47 15 | 1.0 0.4 | 34.2 1.9 |
| Interior 4 | 35 8 | 1.3 0.4 | 30.4 1.4 |
| Outer | 17 2 | 1.7 0.4 | 17.3 0.4 |
| PDR 1 | 20 2 | 1.7 0.4 | 21.7 0.6 |
| PDR 2 | 22 3 | 1.7 0.3 | 24.1 0.8 |
| PDR 3 | 23 3 | 1.7 0.4 | 24.6 0.8 |
| PDR 4 | 22 3 | 1.5 0.3 | 22.3 0.7 |
| PDR 5 | 22 3 | 1.5 0.3 | 22.9 0.7 |
| PDR 6 | 24 3 | 1.8 0.3 | 26.0 0.9 |
| PDR 7 | 25 3 | 1.7 0.3 | 26.9 1.0 |
| PDR 8 | 26 4 | 1.7 0.4 | 28.6 1.2 |
| UCHII | 29 5 | 1.8 0.3 | 32.7 1.5 |
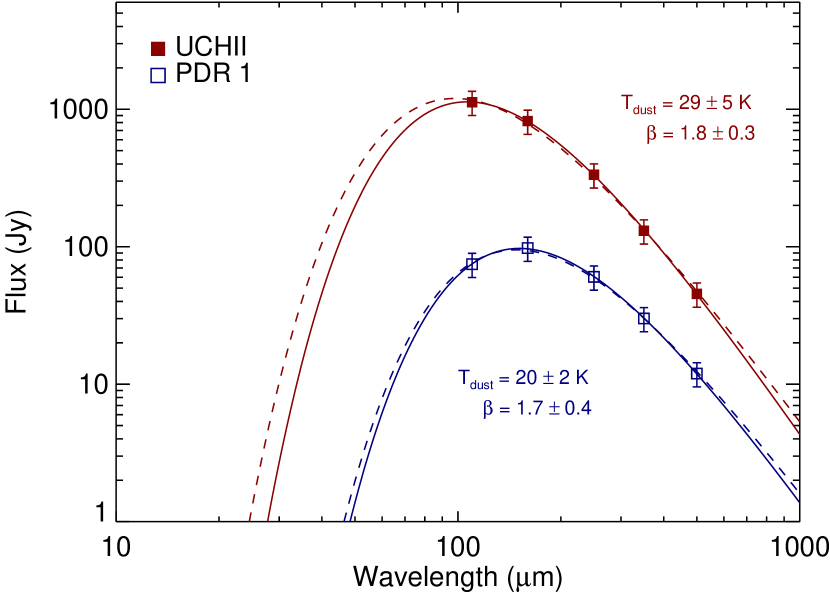
To determine the dust temperature structure of Sh2-104, we performed aperture photometry measurements on selected areas in the field. The apertures are shown in Fig. 1 and sample the interior of the bubble and the photodissociation region (PDR), including the UCH ii region associated with IRAS 20160+3636. We used a single aperture (not shown) to account for the background emission. We fitted the PACS+SPIRE emission for all regions. These data represent the cold emission component, therefore we fitted a single temperature. We did this first allowing to vary, and later fixing . The resulting and values are shown in Table 1, their uncertainties are the formal values from the fitting procedure. Figure 2 shows examples of the fitted spectral energy distributions (SEDs) for the regions UCHII and PDR 1. Apart from the clear difference in , it can be seen that for UCHII the PACS+SPIRE emission does not allow to sample the peak of the SED, which is reflected in a larger error in the fit. This is also seen in the four Interior # regions, suggesting the presence of a warmer emission component that contributes to the shorter- emission. Observations in the mid-IR can provide a constraint on this component, and a 2-temperatures fitting would be more appropriate to determine the and values.
The temperatures throughout the PDR are between and K, and the UCH ii region is marginally warmer. The region outside the bubble (region Outer) is the coldest, while the regions mapping the interior of the bubble are hotter, with an average temperature of K. The average obtained is , therefore the temperatures obtained from the fit with a fixed do not significantly differ from those obtained with a free (see Table 1).
Figure 3 shows the distribution of the spectral indices vs. dust temperature, along with the relationships found by Dupac et al. (2003) and Désert et al. (2008). Within the uncertainties, our results agree with both relationships. We can also identify two groups, one with temperatures between and K and an emissivity index between and , and the other with K and . These two groups show that on average higher values are preferentially associated with colder material.

Although anti-correlation between and is reported in the literature (e.g., Dupac et al. 2003; Yang & Phillips 2007; Désert et al. 2008), it is yet not clear which physical processes are behind it. Other authors studying this relationship examine the emission from different regions scattered in the sky. In contrast, we are finding this anti-correlation in the analysis of one contiguous complex object at a specific location in the sky. A relationship may indicate a change of the dust properties (Stepnik et al., 2003). Grain fluffiness in particular increases the emissivity index while keeping a relatively low temperature (e.g., Stognienko et al. 1995; Fogel & Leung 1998).
Fluffy grains result from grain coagulation and growth. The grain coagulation timescale and feasibility depend on factors such as the existence of ice mantles, grain size, and relative grain velocities.
We are finding the highest values and lowest values toward the PDR of Sh2-104, which would imply then that the fluffiest and largest grains are located in the PDR. The question remains whether the PDR dust coagulated after the creation of the H ii region, or if the birth of the H ii region has destroyed the already coagulated dust located in the ionized cavity.
4 Gas properties
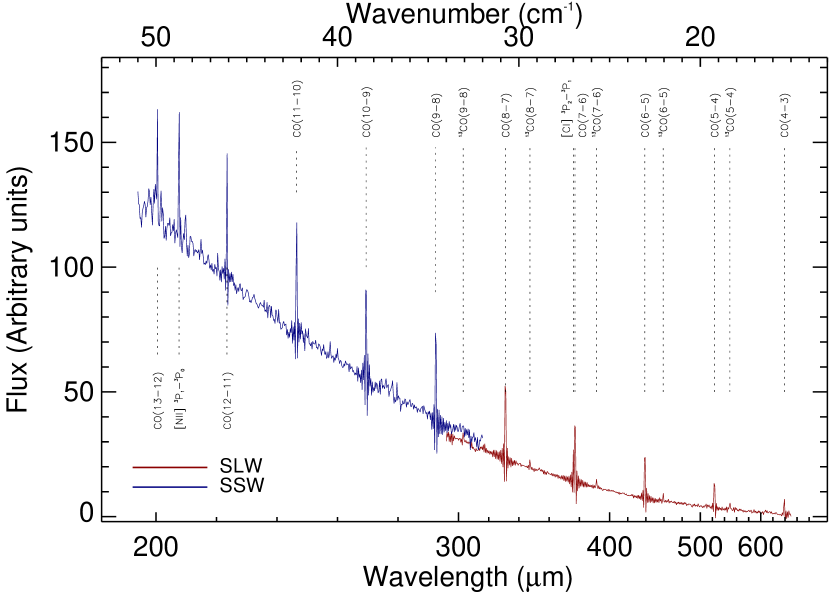
The seven pointings of the central pixels observed with SPIRE-FTS are marked with red (SLW) and blue (SSW) circles in Fig. 1. In total we detected the transitions described in Table 2. The richest spectrum (Fig. 4) was obtained towards pointing E, which targets the UCH ii region associated with IRAS 20160+3636. The most prominent features are the CO -ladder and the Nii transition, an important ionized-gas coolant and a proxy for the H flux (see e.g., Oberst et al. 2006).
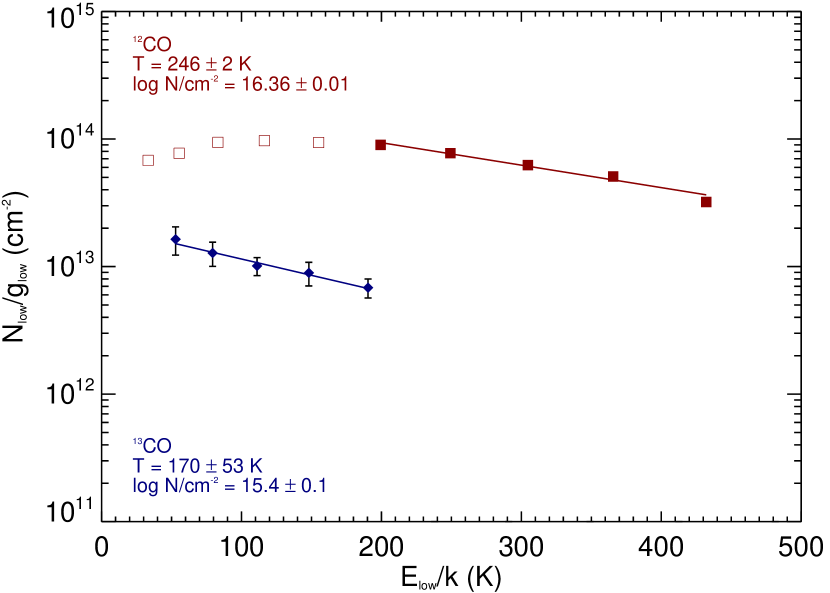
In the simple hypothesis of optically thin emission, we plotted 12CO and 13CO excitation diagrams, following the formulation of Johansson et al. (1984). An example is shown in Fig. 5 for pointing E. The slope of the linear fit for 12CO results in a temperature of K, and K for 13CO. The total column densities derived are and , respectively. The fits in Fig. 5 do not include all the measurements. The downturn seen in the lower levels of 12CO is interpreted as the optically thick/thin regime turnover, and is most likely a real physical feature and not an instrumental or calibration effect, because it is only seen for that species and not, for example, for 13CO. If the lines were emitted from an optically thick medium, their intensity would be underestimated, thus their respective column densities would also be a lower limit. Therefore, the optically thin assumption would hold for 12CO only for transitions higher than , and those are the points included in the fit.
For 13CO on the other hand only the lines with wavelengths in the SPIRE-FTS SLW range are detected. These correspond to the to transitions. The 13CO lines in the SPIRE-FTS SSW wavelenght range ( to ) are detected as upper limits, because the line positions are found displaced from their expected positions, indicating that we are probably seeing some “outlier” noise features rather than the lines themselves. Therefore, we fit and show in Fig. 5 only the five 13CO transitions detected with SPIRE-FTS SLW. Following the reasoning of the previous paragraph, the 13CO transitions are most likely optically thin.
| Transition | Rest (m) | Eup (K) | Transition | Rest (m) | Eup (K) |
|---|---|---|---|---|---|
| CO | 13CO | ||||
| CO | 13CO | ||||
| CO | 13CO | ||||
| CO | 13CO | ||||
| CO | 13CO | ||||
| CO | Ci | ||||
| CO | Ci | ||||
| CO | CH | ||||
| CO | Nii | ||||
| CO |
The two distinct gas temperatures obtained with 12CO and 13CO suggest two different gas components or a stratification of the emitting region. The colder component is traced by the optically-thin 13CO transitions at energy levels for which 12CO is optically thick, while the hotter component is traced by the more energetic, optically-thin 12CO transitions. Therefore it is likely that the colder gas is located at grater depths in the PDR than the hotter gas.
Assuming similar emitting volumes and beam filling factors as well as optically thin emission, our CO and 13CO column density values imply an abundance ratio , which is several times lower than the reported elemental value of (Wilson, 1999). This would imply an enhancement of the 13CO isotopologue abundance.
However, several factors can contribute to the low abundance ratio we find. Perhaps the most important one would be the assumption of optically thin emission for 12CO. We used the high-energy transitions to derive its column density, and although in a first analysis they appear to be optically thin, it might not be the case (see e.g., Habart et al. 2010). To address this issue we will present and analyse PDR models of the Sh2-104 region in a forthcoming paper.
5 Summary
With Herschel PACS and SPIRE data we have analysed dust and gas properties of the bubble-shaped H ii region Sh2-104. Aperture photometry of PACS+SPIRE images allowed us to derive the dust emissivity index and the dust temperature throughout Sh2-104. We found two different groups, one at colder temperatures and higher , and the other at warmer temperatures and lower . We recover the inverse relationship reported in the literature, but the uncertainty in our fit prevents us from finding a precise depence. As an example, the different relationships found by Dupac et al. (2003) and Désert et al. (2008) are both compatible with our results. PACS and SPIRE have allowed us to constrain the “cold” side of the SED. We have estimated both and simultaneously, but the uncertainties remain relatively high. With the data at hand we can only fit a single temperature component, which disregards the contribution of warmer components to the PACS shorter wavelengths. The existance of a anti-correlation could be due to differences of the dust grain properties between the PDR and the H ii cavity.
SPIRE-FTS spectra at different pointings throughout Sh2-104 have unveiled the CO chemistry of the region in more detail. We detect the 12CO and 13CO -ladders up to the and transitions respectively, revealing the warm gas component in the region. Rotational diagrams towards the UCH ii region in the PDR of Sh2-104 show that the 13CO emission is optically thin and also the 12CO for transitions above the level. The emission shows two different gas components, a colder one with a temperature of K and a hotter one at a temperature of K. The CO column densities derived would suggest an enhancement of the 13CO isotopologue abundance ratio with respect to the elemental value, but the uncertainties of the different assumptions are still too large to confirm that result. In a follow-up paper we will show models of the PDR of Sh2-104, which will provide better constraints on the gas temperature, density and column density structure.
Acknowledgements.
SPIRE has been developed by a consortium of institutes led by Cardiff Univ. (UK) and including Univ. Lethbridge (Canada); NAOC (China); CEA, LAM (France); IFSI, Univ. Padua (Italy); IAC (Spain); Stockholm Observatory (Sweden); Imperial College London, RAL, UCL-MSSL, UKATC, Univ. Sussex (UK); Caltech, JPL, NHSC, Univ. Colorado (USA). This development has been supported by national funding agencies: CSA (Canada); NAOC (China); CEA, CNES, CNRS (France); ASI (Italy); MCINN (Spain); Stockholm Observatory (Sweden); STFC (UK); and NASA (USA). PACS has been developed by a consortium of institutes led by MPE (Germany) and including UVIE (Austria); KUL, CSL, IMEC (Belgium); CEA, LAM (France); MPIA (Germany); IFSI, OAP/AOT, OAA/CAISMI, LENS, SISSA (Italy); IAC (Spain). This development has been supported by the funding agencies BMVIT (Austria), ESA-PRODEX (Belgium), CEA/CNES (France), DLR (Germany), ASI (Italy), and CICT/MCT (Spain). Part of this work was supported by the ANR (Agence Nationale pour la Recherche) project “PROBeS”, number ANR-08-BLAN-0241.References
- Abergel et al. (2010) Abergel, A., et al. 2010, A&A, this volume.
- Benjamin et al. (2003) Benjamin, R. A., Churchwell, E., Babler, B. L., et al. 2003, PASP, 115, 953
- Churchwell et al. (2006) Churchwell, E., Povich, M. S., Allen, D., et al. 2006, ApJ, 649, 759
- Churchwell et al. (2007) Churchwell, E., Watson, D. F., Povich, M. S., et al. 2007, ApJ, 670, 428
- Condon et al. (1998) Condon, J. J., Cotton, W. D., Greisen, E. W., et al. 1998, AJ, 115, 1693
- Crampton et al. (1978) Crampton, D., Georgelin, Y. M., & Georgelin, Y. P. 1978, A&A, 66, 1
- Deharveng et al. (2003) Deharveng, L., Lefloch, B., Zavagno, A., et al. 2003, A&A, 408, L25
- Désert et al. (2008) Désert, F., Macías-Pérez, J. F., Mayet, F., et al. 2008, A&A, 481, 411
- Dupac et al. (2003) Dupac, X., Bernard, J., Boudet, N., et al. 2003, A&A, 404, L11
- Elmegreen & Lada (1977) Elmegreen, B. G. & Lada, C. J. 1977, ApJ, 214, 725
- Fich (1993) Fich, M. 1993, ApJS, 86, 475
- Fogel & Leung (1998) Fogel, M. E. & Leung, C. M. 1998, ApJ, 501, 175
- Habart et al. (2010) Habart, E., et al. 2010, A&A, this volume.
- Hildebrand (1983) Hildebrand, R. H. 1983, QJRAS, 24, 267
- Griffin et al. (2010) Griffin, M., et al. 2010, A&A, this volume.
- Johansson et al. (1984) Johansson, L. E. B., Andersson, C., Ellder, J., et al. 1984, A&A, 130, 227
- Lahulla (1985) Lahulla, J. F. 1985, A&AS, 61, 537
- Motte et al. (2010) Motte, F., et al. 2010, A&A, this volume.
- Oberst et al. (2006) Oberst, T. E., Parshley, S. C., Stacey, G. J., et al. 2006, ApJ, 652, L125
- Ossenkopf & Henning (1994) Ossenkopf, V. & Henning, T. 1994, A&A, 291, 943
- Pilbratt et al. (2010) Pilbratt, G., et al. 2010, A&A, this volume.
- Poglitsch et al. (2010) Poglitsch, A., et al. 2010, A&A, this volume.
- Sharpless (1959) Sharpless, S. 1959, ApJS, 4, 257
- Shetty et al. (2009) Shetty, R., Kauffmann, J., Schnee, S., & Goodman, A. A. 2009, ApJ, 696, 676
- Stepnik et al. (2003) Stepnik, B., Abergel, A., Bernard, J., et al. 2003, A&A, 398, 551
- Stognienko et al. (1995) Stognienko, R., Henning, T., & Ossenkopf, V. 1995, A&A, 296, 797
- Swinyard et al. (2010) Swinyard, B., et al. 2010, A&A, this volume.
- Visser et al. (2009) Visser, R., van Dishoeck, E. F., & Black, J. H. 2009, A&A, 503, 323
- Wilson (1999) Wilson, T. L. 1999, Reports on Progress in Physics, 62, 143
- Yang & Phillips (2007) Yang, M. & Phillips, T. 2007, ApJ, 662, 284