Infrared study of the charge-ordered multiferroic LuFe2O4
Abstract
The reflectivity of a large LuFe2O4 single crystal has been measured with the radiation field either perpendicular or parallel to the axis of its rhombohedral structure, from 10 to 500K, and from 7 to 16000 cm-1. The transition between the two-dimensional and the three-dimensional charge order at = 320 K is found to change dramatically the phonon spectrum in both polarizations. The number of the observed modes above and below , according to a factor-group analysis, is in good agreement with a transition from the rhombohedral space group to the monoclinic . In the sub-THz region a peak becomes evident at low temperature, whose origin is discussed in relation with previous experiments.
pacs:
71.30.+h, 74.25.Gz, 78.30.-jI Introduction
The multiferroics are materials which exhibit, in a common range of temperatures, both ferroelectricity and magnetic order (ferromagnetism, ferrimagnetism or antiferromagnetism). Much effort has been devoted to understand the relationship between their magnetic and electronic degrees of freedom, Eerenstein ; Spaldin ; Hill in view of the potential applications. Indeed, the conventional mechanisms of ferroelectricity and magnetism are not compatible with each other, and this makes the multiferroic materials relatively rare. One should then invoke novel mechanisms of ferroelectricity, as those associated with specific charge configurations in charge-ordered materials. Brink One of such compounds is the mixed-valence LuFe2O4 (LFO). Its structure belongs to the rhombohedral space group and includes triangular double layers of Fe-O stacked along the axis. A two-dimensional Fe2+/Fe3+ charge order (CO), which forms between about 500 K and = 320 K in those double layers, builds up in each Fe-O plane a net dipole moment. Tanaka ; Ikeda2 ; Ikeda Below , the CO becomes more robust and three-dimensional (3-D).
Dielectric measurements in low electric fields show that the 3-D phase of LFO is ferroelectric, Ikeda while X-ray scattering indicates that the dipole moments of adjacent bilayers are antiparallel, Angst so that the net polarization is zero. These contradictory findings can be reconciled by considering that the antiferroelectric ground state and the ferroelectric state may be so close in energy Angst that even a small electric field stabilizes the latter one. Concerning the magnetic behavior of LFO, a two-dimensional ferrimagnetic order is established below TN 240 K Yamada . However, a surprising decrease in the magnetic correlation length is observed below TL = 175 K. Christi Finally, it has been found that the dielectric constant decreases sharply both under weak magnetic Subramanian and electric Li2 fields, which also cause a drop in the resistivity by several orders of magnitude. Li This colossal electroresistance, which is also observed at room temperature, makes LFO attractive for its potential applications.
The optical response of LFO with the radiation field E c has been investigated by Xu et al., Xu together with other properties, between 30 meV and 6.5 eV and from 4 to 540 K. At zero field the authors observe two main peaks in the near-infrared/visible range, which is dominated by electronic excitations. The band at 1.1 eV is assigned to Fe2+/Fe3+ charge transfer, and that at about 3.5 eV to a superposition of OFe- and OLu charge transfer. The edge of the 1.1 eV peak creates the insulating optical gap at 0.5 eV. A third feature in the mid infrared, peaked at about 0.3 eV, is attributed by the authors to on-site Fe3+ excitations. Li et al. THz have instead explored the sub-THz response of LFO by time-domain spectroscopy, observing at low two collective excitations that they assigned to a central mode and to a soft mode of the ferroelectric phase.
In the present experiment we have investigated both the sub-THz and the infrared optical conductivity of LuFe2O4 by Fourier-Transform spectroscopy. We performed reflectivity measurements on a large single crystal from 7 to 16000 cm-1 (i. e., from about 1 meV to 2 eV), in the temperature range 10 - 500 K, with the radiation field E polarized both c and c. We could thus observe in detail the optical phonon spectrum of LuFe2O4, and the striking modifications that it undergoes when crossing . In the sub-THz spectral range we detected at low a peak at 10 cm-1, which corresponds approximately to the central mode reported in Ref. THz, . We propose for that spectral feature an alternative interpretation which is related to charge order rather than to ferroelectricity.
II Experiment
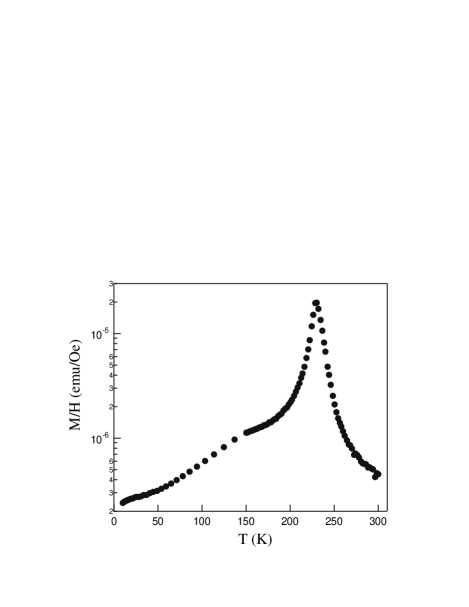
The measurements were performed on a large (8x3x2 mm3) single crystal of LuFe2O4, grown by optical floating zone melting method in a flowing argon atmosphere, Sun09 and characterized by X-ray diffraction and Laue imaging at room temperature. The magnetic susceptibility of the sample, as measured in zero-fied cooling, is shown in Fig. 1. In addition to the sharp peak at = 230 K, also reported previously, THz we observe a change of slope at about 150 K which may be related to the change in the magnetic correlation length observed in neutron scattering experiments around 175 K.
The largest crystal surface contained the axes and (or ). Its reflectivity was measured between 7 and 16000 cm-1 by Michelson interferometers, with the radiation field E polarized either c or c. Below 300 K the sample was theromoregulated within 2 K in a He-flow cryostat, above 300 K in an evacuated capsule and in thermal contact with a heater. Both sample holders included a mobile hot filament for gold evaporation. Indeed, after measuring the intensity reflected by the sample, at each temperature gold was evaporated in situ, and the intensity reflected by the golden sample was measured for reference. The reflectivity was thus obtained. The sub-THz measurements were performed by the same procedure but using the coherent syncrotron radiation extracted from a bending magnet of the BESSY-II storage ring when working in its low- mode. Abo The real part of the optical conductivity was calculated by the use of Kramers-Kronig transformations. Standard extrapolations were applied to at all temperatures, at frequencies both lower and higher than the measured interval.
III Results and discussion
III.1 Reflectivity and high-frequency conductivity
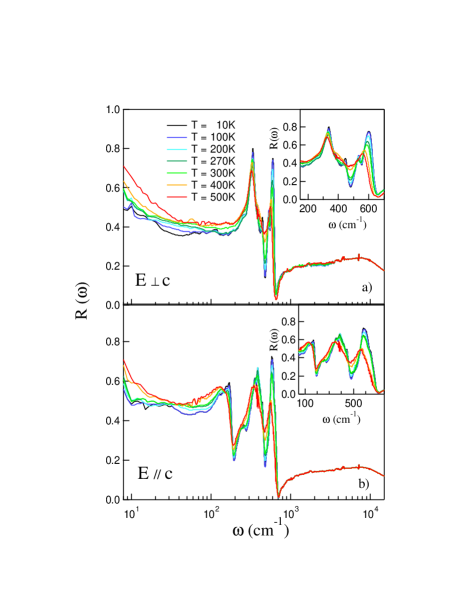
The reflectivity of the LFO crystal is reported in Fig.2 for E c (a) and E c (b). In both panels shows a rich and detailed optical-phonon spectrum, also reported on a linear scale in the insets, which changes drastically at . In the E c configuration, at the lowest frequency and high , the non-zero slope of reveals a small and narrow Drude-like term, thermally activated. Below , in the sub-THz region one instead detects a weak but well defined peak at about 10 cm-1. The mid- and the near-infrared ranges are finally occupied by a broad, practically -independent band with a maximum around 8000 cm-1 (1 eV).
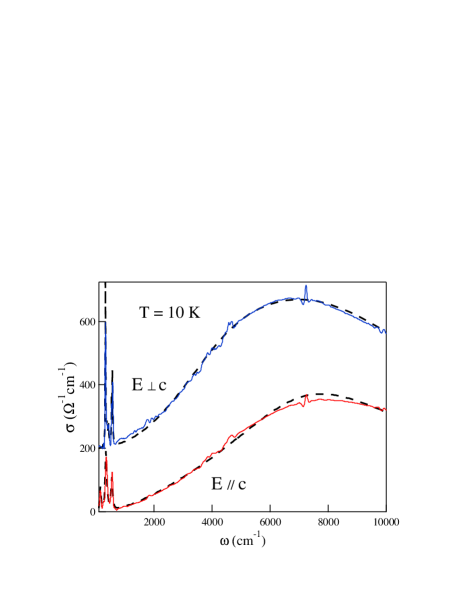
This broad peak is better seen in Fig. 3, which shows the real part of the optical conductivity, as extracted from by the Kramers-Kronig transformations. The Figure reports the data at 10 K, but the high-frequency conductivity is virtually independent of temperature. The best fit, also plotted in the Figure, requires a strong oscillator peaked at 7200 cm-1 (0.9 eV) for E c and at 8400 cm-1 (1.05 eV) for E c. The former one is in fair agreement with the contribution at 1.1 eV reported in Ref. Xu, and assigned to the lowest-energy allowed electronic transition, Xiang namely the Fe2+ Fe3+ charge transfer. This may occur between one of the doubly degenerate levels, which slightly differ in energy from each other, and the -symmetry singlet at higher energy. Nagano
The authors of Ref. Xu, also report a much weaker contribution at 0.3 eV, detected in transmission measurements on thin samples. They assign it to on-site Fe3+ excitations, but it might also be due to the photoionization of the polaronic charges in the CO state. Calvani Indeed, the mobility of the charges in the CO regime is treated in Ref. Xu, in terms of small-polaron hopping. In the present reflectivity spectra we do observe a weak, lower-energy sideband of the main peak, that however the fit places (at 10 K) at 4000 cm-1 (0.5 eV) for E c and at 4500 cm-1 (0.55 eV) for E c.
III.2 Optical conductivity in the phonon region
The high-temperature, rhombohedral unit cell of LuFe2O4 contains 3 formula units, rotated by 1200 around c with respect to one another, having the same 3 acoustic and 18 optical modes. The authors of Ref. Harris, assumed 3 and 3 (doubly degenerate) optical phonons in the plane, 3 and 3 (non-degenerate) optical modes for the axis, and calculated their frequencies (the modes are infrared active, the ’s are Raman active). However, a factor group analysis Hateley leads us to a more complex phonon scenario for LuFe2O4, as it is shown in Table I.
| Atoms | Wyckoff | site | Irreducible |
|---|---|---|---|
| notation | symmetry | representation | |
| Fe, Fe | 1(a), 1(b) | 2+2 | |
| Lu,O | 2(c) | + | |
| O,O,O | 3(d) | + |
| Infrared | Raman | Acoustic | Silent | |
|---|---|---|---|---|
| active | active | |||
| plane | ||||
| axis |
The resulting modes are classified in Table II with respect to their polarization and activity. In the high- symmetry, the infrared-active modes are predicted to be 5 in the plane, 4 along the axis. At low , the CO reduces the crystal symmetry to the monoclinic , Angst which includes one site of symmetry (1), two (2), two (2), and two (2). Here, the number in parenthesis indicates how many atoms each site can accommodate. One thus obtains eight possible irreducible representations , depending on the site occupation. The ’s with lead to 12 one-dimensional infrared-active modes, those with to 15 such modes. However, six out of them require that a site with inversion symmetry is occupied. As such an atom does not exist even in the high- phase, they can all be excluded. The remaining two irreducible representations of the crystal vibrations, in the low- phase, are
| (1) |
They differ for the Raman spectrum but predict the same 12 infrared-active, non-degenerate, modes. One thus obtains a reliable prediction on the effect of the symmetry reduction below on the phonon spectrum.
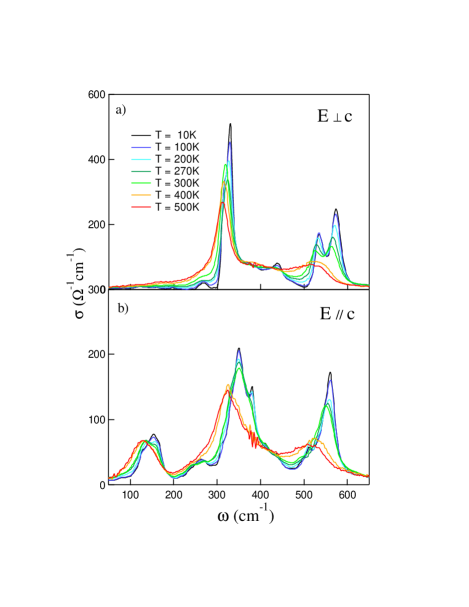
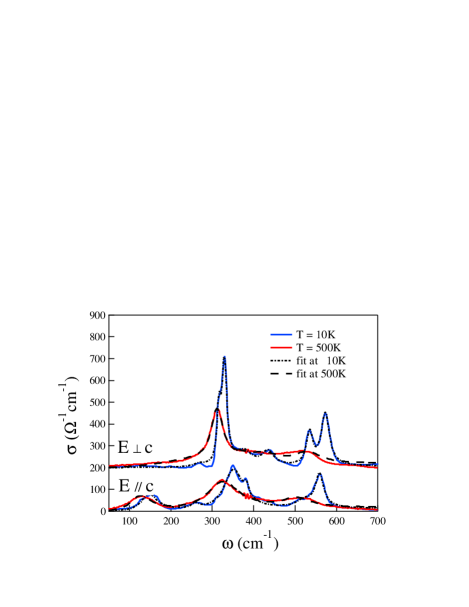
This effect is clearly seen in Fig.4, which shows the optical conductivity of LFO measured in the far infrared. Below 320 K, for E c the broad contribution at 530 cm-1 splits into two components separated by about 40 cm-1; for E c all lines shift abruptly to higher frequencies and new components do appear. Incidentally, no phonon line displays Fano-like asymmetries, Lupi98 thus confirming the absence of a free-carrier background in the phonon energy range.
In order to obtain a closer comparison with theory, the optical conductivity was fit, through the relation , to the imaginary part of the Lorentzian dielectric function
| (2) |
Therein, accounts for the high-frequency contributions to , while , and are the central frequency, strength and damping of the j-th mode, respectively. The accuracy of the procedure can be evaluated in Fig. 5, where the fitting curves are compared with the experimental at both extreme temperatures.
The parameters obtained by fitting Eq. 2 to the optical conductivity of Fig. 4 with the minimum possible number of oscillators, both in the rhombohedral cell at 500 K, and in the monoclinic cell at 10 K, are listed in Table III. Therein, a good agreement with the factor-group predictions reported in Table II and in Eq. 1 is displayed. At high one obtains a good fit by using 5 Lorentzians in the plane, 3 along the axis, to be compared with the 5 and 4 infrared modes, respectively, predicted in Table II. At low , in the monoclinic symmetry, the best fit requires 6 modes for E c and 6 for E c , in excellent agreement with the 12 infrared active phonons predicted in total by Eq. 1. A shoulder which appears at 316 cm-1 both for E c and E c is unlikely to be due to a normal mode of the crystal.
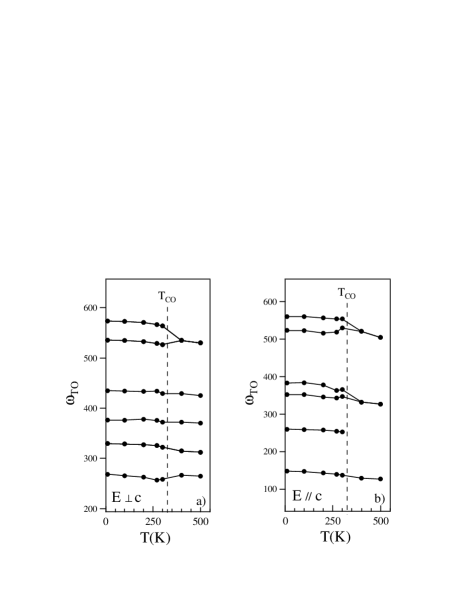
The temperature evolution of the main phonon frequencies is shown in Fig. 6 for both the plane and the axis. Therein one may clearly see the branching at of the highest-energy mode of the plane and of two modes of the axis. In all these cases, a narrower line originates from the high- absorption at a moderately higher frequency, while a new mode springs up at a much higher frequency.
| Mode | |||||||
|---|---|---|---|---|---|---|---|
| E c | |||||||
| 10K | 500K | ||||||
| 92 | |||||||
| a1 | 268 | 30 | 150 | 264 | 34 | 190 | |
| 316 | |||||||
| a2 | 329 | 14 | 642 | 332 | 312 | 35 | 700 |
| a3 | 376 | 50 | 441 | 370 | 43 | 215 | |
| a4 | 435 | 34 | 361 | 425 | 85 | 441 | |
| a5 | 535 | 18 | 408 | 474 | 530 | 75 | 473 |
| a6 | 573 | 23 | 579 | ||||
| E c | |||||||
| 10K | 500K | ||||||
| c1 | 148 | 46 | 461 | 161 | 127 | 59 | 493 |
| c2 | 259 | 22 | 175 | ||||
| 316 | |||||||
| c3 | 352 | 56 | 787 | 310 | 326 | 95 | 856 |
| c4 | 383 | 12 | 196 | ||||
| c5 | 523 | 55 | 341 | 465 | 504 | 83 | 466 |
| c6 | 559 | 24 | 467 |
III.3 Optical response in the sub-THz region
As already mentioned, we have extended our investigation well below the phonon region, in the sub-THz range, by use of coherent synchrotron radiation. We could thus greatly enhance the signal-to-noise ratio on the reflectivity, while maintaining a low perturbation on the system. The thus obtained can be seen in Fig. 2 thanks to its logarithmic frequency scale. Therein, at 100 and 10 K a well defined peak appears at = 10 cm-1. This extremely low-frequency feature is then associated with the three-dimensional charge order, further reinforced by the ferrimagnetic transition at 240 K. The resulting sub-THz optical conductivity is reported in Fig. 7, with the feature at again evident at low temperature. In Ref. THz, , a peak was detected in the extracted from time-resolved sub-THz spectroscopy. THz At 50 K it was reported at 13 cm-1 (left arrow in Fig. 7), in agreement within errors with the present . The authors of Ref. THz, attributed their peak to a central mode of the ferroelectric LFO phase. They observed a further, broad contribution around 40 cm-1 (right arrow in Fig. 7), which was assigned to a soft mode. In Fig. 7, at 10 K, a second absorption possibly appears between 20 and 30 cm-1.
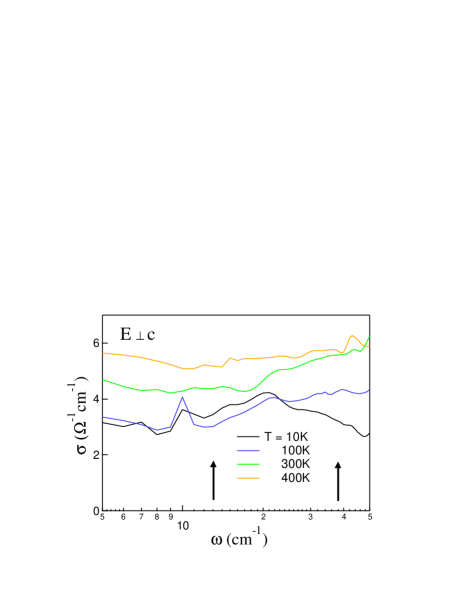
The present observations may be consistent with those of time-resolved spectroscopy, if one considers that in polycrystalline samples, as is the case of Ref. THz, , the soft mode stiffens with respect to that observed in single crystals. Petzelt However, if one considers that LuFe2O4, as already mentioned, does not exhibit bulk ferroelectricity at zero field, there are alternative explanations for the present peak at 10 cm-1 (and for the broad band at higher frequency, if confirmed by further experiments). Indeed, similar features have been observed in several systems where the charge order can be described in terms of charge density waves (CDW) and this is also the case of LFO. Yamada For example, in the manganite La0.25Ca0.75MnO3, below the charge ordering temperature a narrow peak at 7.5 cm-1 is observed, followed by a broad absorption at 30 cm-1. Nucara The former feature has been interpreted as a collective excitation (phason) of the CDW, which displaces from zero to a finite frequency when either it is pinned to lattice impurities or the charge order is commensurate with the lattice. The broader band was ascribed to a combination band of the phason with the amplitudon, another excitation which is present in a CDW. Nucara According to other authors, the highest-frequency feature is instead due to an acoustic phonon, which becomes infrared active at zero wavevector due to the folding of the Brillouin zone determined by the CO. Dressel Further sub-THz experiments are probably needed, before reaching a common interpretation of the elusive excitations which are detected at those low frequencies in the charge-ordered systems.
IV Conclusion
In conclusion, we have reported here a study of the charge-ordered multiferroic LuFe2O4 in the infrared and the sub-THz range, with special focus on the optical phonon region. Therein we have observed the dramatic effect of the symmetry reduction - caused by the transition at = 320 K between the 2-D and 3-D charge order - both on the modes of the plane and on those of the axis of the rhombohedral structure. Below some phonon bands split into pairs of narrower lines, while new modes do appear. The number of the observed phonon lines, both above and below , is in good agreement with a factor-group analysis of the respective cell symmetries. No evident effects on the phonon spectrum is instead detected when crossing the ferrimagnetic transition at 240 K. In the sub-THz region, a very weak electric conduction, thermally activated, is detected at high temperature, while a peak becomes evident in the low-temperature optical conductivity, possibly accompanied by a broad absorption at higher frequency. For that feature, similar to the one reported previously in time-domain experiments, we have proposed an interpretation related to the charge order rather than to ferroelectricity, and based on a comparison with similar sub-THz spectra recently obtained in charge-ordered manganites at low temperature.
References
- (1) W. Eerenstein, N. D. Mathur and J. F. Scott, Nature 442, 759 (2006).
- (2) N. A. Spaldin and M. Fiebig, Science 309, 391 (2005).
- (3) N.A. Hill, J. Phys. Chem. B, 104 (29), 6694 (2000).
- (4) J. van den Brink and D. I. Khomskii, J. Phys. - Cond. Mat. 20, 434217 (2008).
- (5) M. Tanaka, K. Siratori, and N. Kimizuka, J. Phys. Soc. Jpn, 53, 760 (1984).
- (6) N. Ikeda, K. Kohn, N. Myouga, E. Takahashi, H. Kitoh and S. Takekawa, J. Phys. Soc. Japan 69, 1526 (2000).
- (7) Naoshi Ikeda, Hiroyuki Ohsumi, Kenji Ohwada, Kenji Ishii, Toshiya Inami, Kazuhisa Kakurai, Youichi Murakami, Kenji Yoshii, Shigeo Mori, Yoichi Horibe, and H. Kito, Nature 436, 1136 (2005).
- (8) M. Angst, R.P. Hermann, A.D. Christianson, M.D. Lumsden, C. Lee, M.-H. Whangbo, J.-W. Kim, P.J. Ryan, S.E. Nagler, W. Tian, R. Jin, B.C. Sales, D. Mandrus, Phys. Rev. Lett. 101, 227601 (2008).
- (9) Y. Yamada, S. Nohdo, and N. Ikeda, J. Phys. Soc. Japan 66 3733 (1997); Y. Yamada, K. Kitsuda, S. Nohdo, and N. Ikeda, Phys. Rev. B 62 12167 (2000).
- (10) A. D. Christianson, M. D. Lumsden, M. Angst, Z. Yamani, W. Tian, R. Jin, E. A. Payzant, S. E. Nagler, B. C. Sales, and D. Mandrus, Phys. Rev. Lett., 100, 107601 (2008).
- (11) M. A. Subramanian, T. He, J. Chen, N.S. Rogado, T.G. Calvarese, and A.W. Sleight, Adv. Mater. 18, 1737 (2006).
- (12) C. Li, X.-Q. Zhang, Z.-H. Cheng, and Y. Sun, Appl. Phys. Lett. 92, 182903 (2008).
- (13) C. Li, X. Zhang, Z. Cheng and Y. Sun, Appl. Phys. Lett. 93, 152103 (2008).
- (14) X. S. Xu, M. Angst, T. V. Brinzari, R. P. Hermann, J. L. Musfeldt, A. D. Christianson, D. Mandrus, B. C. Sales, S. McGill, J.-W. Kim, and Z. Islam, Phys. Rev. Lett. 101, 227602 (2008).
- (15) S.Z. Li S.J. Luo R. Fu B.B. Jin K.F. Wang J.-M. Liu J.F. Ding X.G. Li, Appl. Phys. A 96, 893 (2009).
- (16) C. H. Li, F. Wang, Y. Liu, X. Q. Zhang, Z. H. Cheng, and Y. Sun, Phys. Rev. B 79, 172412 (2009).
- (17) M. Abo-Bakr, J. Feikes, K. Holldack, P. Kuske, W. B. Peatman, U. Schade, G. Wüstefeld, and H. W. Hübers, Phys. Rev. Lett. 90, 094801 (2003).
- (18) H. J. Xiang and M.-H. Whangbo, Phys. Rev. Lett. 98, 246403 (2007).
- (19) A. Nagano, M. Naka, J. Nasu, and S. Ishihara, Phys. Rev. Lett. 99, 217202 (2007).
- (20) P. Calvani, Riv. Nuovo Cimento Soc. Ital. Fis. 24, 1 (2001).
- (21) A. B. Harris and T. Yildirim, Phys. Rev. B 81, 134417 (2010).
- (22) G. W. Hateley, F. R. Dollish, N. T. McDevitt, and F. F. Bentley, Infrared and Raman selection rules for molecular and lattice vibrations, John Wiley & Sons, New York 1972.
- (23) S. Lupi, M. Capizzi, P. Calvani, B. Ruzicka, P. Maselli, P. Dore, and A. Paolone, Phys. Rev. B 57, 1248 (1998).
- (24) J. Petzelt, J. Hlinka,, S. Kamba, T. Ostapchuk, D. Nouijni, and I. Rythchetsky, Ferroelectrics 334, 199 (2006).
- (25) A. Nucara, P. Maselli, P. Calvani, R. Sopracase, M. Ortolani, G. Gruener, M. Cestelli Guidi, U. Schade, and J. García, Phys. Rev. Lett. 101, 066407 (2008).
- (26) T. Zhang, E. Zhukova, B. Gorshunov, D. Wu, A.S. Prokhorov, V.I. Torgashev, E.G. Maksimov, M. Dressel, Phys. Rev. B 81 125132 (2010).