Direct Determination of Electron-Phonon Coupling Matrix Element in a Correlated System
Abstract
High-resolution electron energy loss spectroscopy measurements have been carried out on an optimally doped cuprate Bi2Sr2CaCu2O8+δ. The momentum-dependent linewidth and the dispersion of an optical phonon are obtained. Based on these data as well as the detailed knowledge of the electronic structure from angle-resolved photoemission spectroscopy, we develop a scheme to determine the full structure of electron-phonon coupling for a specific phonon mode, thus providing a general method for directly resolving the EPC matrix element in systems with anisotropic electronic structures.
pacs:
71.27.+a, 71.38.-k, 74.72.-h, 79.20.UvThe interaction between electrons and various collective excitations (bosons) is the central ingredient for understanding many of the novel physical properties in condensed matter systems RMP62-1027 ; PR338-1 ; JPCM20-043201 . For simple systems with isotropic electronic structures, such an interaction (electron-boson coupling, EBC) can be characterized by the Eliashberg spectral function Grimvall , which describes the energy of the bosonic modes involved in the coupling as well as their coupling strengths. Direct experimental determination of the Eliashberg function has proven to be important. For instance, in Pb, it played a crucial role in establishing the BCS theory of superconductivity JMRowell . Experimentally, there exists several techniques for determining the Eliashberg function, such as the McMillan-Rowell inversion method on the tunneling data of the conventional superconductors JMRowell ; McMillan , and more recently, the maximum entropy method (MEM) in analyzing the quasi-particle dispersion kink observed in high-resolution angle-resolved photoemission spectroscopy (ARPES) measurements JunrenMEM ; XJZhouMEM ; NonBi2201 . These approaches attempt to elucidate the EBC by probing its effects on the electrons. On the other hand, the effects of the EBC on bosonic modes is not commonly investigated.
For more complex systems, neither the isotropic Eliashberg function nor the anisotropic Eliashberg function determined from ARPES is sufficient for fully characterizing EBC. A notable example is the high- cuprate, who has highly anisotropic electronic structure and the unconventional superconductivity. By probing the electrons alone, one can at the best determine the with the dependence on the direction alone using ARPES and the aforementioned MEM analysis Chien2009 . However, unlike the case of the conventional -wave superconductors, the so-determined Eliashberg function cannot be directly related to the strength of the unconventional pairing. This is because the Eliashberg function determined from the quasi-particle dispersion and the one dictating the pairing strength belong to different symmetries Bulut1996 . For these systems, it is necessary to resolve the full structure of the EBC, i.e., the matrix element , which characterizes the probability amplitude for the electron transition from to induced by the interaction with bosons PRL93-117003 ; PRL93-117004 . Because the electronic measurements such as ARPES only contain the information of the electron final state , with the contributions from the different initial states integrated, it is in general impossible to determine the full structure of by probing electrons alone. The manifestation of the EBC on the bosonic modes needs to be probed.
In this paper, we develop a method to resolve the full structure of EBC by probing the bosonic modes with high resolution electron energy loss spectroscopy (HREELS), in combination with the existing ARPES data for the electronic properties. The momentum-dependent linewidth as well as the dispersion of an optical phonon was recorded as a function of the direction relative to the crystalline orientation. The initial and final states involved in the coupling and the corresponding strength are simultaneously determined. The developed scheme is general and applicable to many systems with anisotropic electronic structures.
We have used a prototype high-temperature superconductor (HTSC) Bi2Sr2CaCu2O8+δ (referred to as BSCCO in the following) PSS242-11 ; CampuzanoPRL83 as a test system. The electron band structure, Fermi surface, and surface properties have been well characterized RMP75-473 . Many experimental studies have revealed the signature of the interaction between electrons and a collective bosonic mode. ARPES shows the electron self-energy renormalization in the form of kinks in the dispersion at the energy scales of 70 meV below the Fermi energy in the nodal region N412-510 ; PRL85-2581 ; PRL87-177007 ; PRL96-017005 and 40 meV near the antinodal region PRB68-174520 ; PRL93-117003 . Direct measurements of phonon spectra have been carried out with Raman spectroscopy PRB53-11796 , infrared spectroscopy (IR) PRB69-054511 , HREELS PRB48-12936 , inelastic neutron scattering (INS) PSS242-30 and inelastic x-ray scattering (IXS) PRL100-227002 for BSCCO and other cuprates HTSCs. However, a systematic study of the momentum-dependent phonon renormalization is still missing and it is needed to elucidate the details of EBC.
The experiments were carried out in a commercial system containing variable temperature scanning tunneling microscope (STM) and HREELS (LK-5000). The base pressure was better than 110-10 mbar. The superconducting property of the optimal doped BSCCO single crystal was carefully characterized with the transition temperature at Tc = 91 K. The sample was cleaved in situ in vacuum and the surface was characterized with STM and low energy electron diffraction (LEED). Fig. 1 (a) shows that the cleaved surface was atomically flat with the Bi-O plane exposed. The cleavage quality was further verified by the presence of the (15) superstructure that was visible in both the LEED patterns and STM images, which also indicates the relative angle of the crystalline orientation to the measurements geometry. The HREELS measurements were taken with the electron incident angle of 65o, and excitation energy varied from 3.5 eV to 50 eV to achieve different detecting depth. All the observed spectral features showed no excitation energy dependence for a fixed momentum transfer parallel to the surface. Here we report the results taken with the excitation energy of 50 eV offering a wide momentum transfer range. The HREELS sample stage was coupled to a constant-flow liquid helium cryostat. And the measurements were taken at different temperatures from 60 to 300 K, across the superconducting Tc.

Angle-resolved HREELS of the optimal doped BSCCO sample were measured along different directions relative to the crystalline orientation, as shown in Fig. 1. At Brillouin zone (BZ) center (the in-plane momentum transfer = 0), two main features are resolved near 50 meV (F1) and 80 meV (F2), respectively. Feature F1 corresponds to the out-of-plane vibration of oxygen atoms in Bi-O plane PRB53-11796 ; PRB69-054511 ; PRB48-12936 , with two shoulders at both sides with energy of 41 meV and 62 meV that have been reported earlier PRB48-12936 . Feature F2, to be focused on in the following, appears as a main peak at 80 meV with a broad tail centered at 88 meV. The vibration along c axis of the apical oxygen atoms in the Cu-O semi-octahedra is responsible for the main peak PRB53-11796 ; PRB69-054511 ; PRB48-12936 , while the high-energy tail might be related to the disorder PRB53-11796 . Also considering the selection rule of HREELS, we are able to rule out other energy loss mechanisms that fall into this energy range, such as the phonons of in-plane breathing modes of oxygen in Cu-O2 plane since they are not dipole active along the surface normal and therefore undetectable by HREELS at BZ center. Along any measurement direction, we detect no obvious temperature dependence across superconducting Tc.
As shown in Fig. 1 (c), the most prominent characteristic of the momentum-resolved HREELS presents along nodal direction ( = 45o) where the energy dispersion of the 80-meV feature F2 softens significantly from BZ center towards the boundary. Such a behavior has been quantitatively analyzed note1 . The momentum-dependent phonon energy and linewidth (full-width at half maximum, FWHM) along different directions relative to the crystalline orientation are shown in Fig. 2. An abrupt decrease from 81 meV to 74 meV occurs to the phonon energy with an onset at q 0.45 Å-1 (0.54 /a with a = 3.82 Å). With the same onset, the FWHM increases suddenly from 8 meV at q 0.45 Å-1 to 18 meV at q 0.8 Å-1, indicating the intrinsic strong interaction between the apical oxygen phonon and electrons in BSCCO.
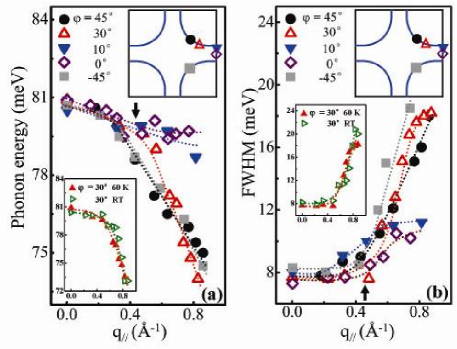
The phonon dispersion and linewidth data show dramatic dependence on the measurement direction with respect to crystalline orientation (). As decreases from 45o (the nodal region), the anomalous behavior persists until gets close to the antinodal region ( 10o), when neither the energy nor the linewidth shows prominent momentum-dependence at temperatures above or below Tc [also see Fig. 1 (d)]. Therefore the phonon dispersion and linewidth measured with different values can be divided into two groups, respectively. Near the nodal region, the phonon energy decreases and the linewidth increases suddenly with the same onset. In contrast, near the antinodal region, the phonon linewidth increases slowly by less than 3 meV while the energy are almost momentum-independent.
Such a dramatic behavior seen in the phonon spectra must reflect the underlying structures of the electron-phonon coupling (EPC) for this mode. In general, the momentum-dependent broadening of the phonon linewidth induced by EPC can be connected to the electron polarizability by the EPC matrix element Grimvall :
| (1) |
where is the phonon energy. And we have assumed , which is a good approximation for the particular out-of-plane apical oxygen phonon mode. The imaginary part of is given by:
| (2) |
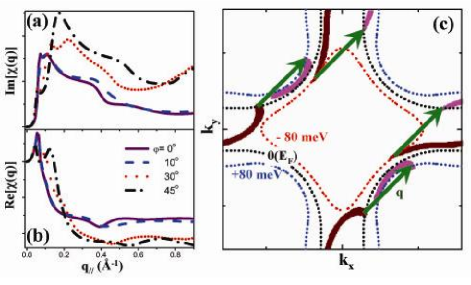
where is the spectral function of quasi-electron, is the Fermi distribution function, and is the energy dispersion of the quasi-electrons. We have further simplified the expression in the second line of Eq. 2 by assuming that the spectral function of the quasi-electron has the form of , with a parameter characterizing the life-time of the quasi-electron due to the many body interactions. The quasi-particle dispersion of the BSCCO system has been measured previously (ARPES) and fitted in a tight-binding phenomenological model RMP75-473 ; PRB52-615 . Im[] can then be calculated numerically. Fig. 3 (a) shows the calculated Im[], which displays rather complicated features originated from the highly anisotropic electronic structure.
In addition to , the experimentally observed linewidth also include a momentum-independent background , which is most likely originated from surface roughness of the cleaved sample and the instrumentation broadening:
| (3) |
We estimate such a background using the value of the experimental data near : , since there should have been no EPC without momentum transfer. With the background subtracted, the EPC matrix element can then be determined straightforwardly with Eq. 1-3. We note that only the electron transition satisfying both energy and momentum conservations, i.e., and , contributes to the EPC-induced broadening. This imposes a stringent constraint on the possible initial and final states of electron for a given phonon momentum , as shown in Fig. 3 (c). Therefore, the determined should be considered as a subset of the more general .
The determined EPC matrix element are shown in Fig. 4 (a) along different directions. With the least square method, the data can be well fitted by:
| (4) |
which is consistent with an phonon mode that couples to electrons in the lattice with symmetry. Here and are constants, representing the coupling strength between an atom displacement and its nearest and next-nearest neighboring sites, respectively. It can be seen that the experimental data, in particular, the dramatically different behaviors for nodal and anti-nodal directions, are quantitatively reproduced by our model.
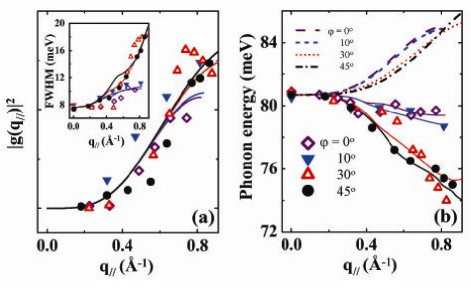
To further test our analysis, we calculate the phonon softening induced by EPC:
| (5) | |||
where is the real part of electron polarizability, as plotted in Fig. 3 (b). Figure 4 (b) shows the experimentally observed phonon dispersion that can be reproduced by assuming a bare phonon dispersion as the experimental background. In particular, the anisotropy of the phonon softening is reproduced: when , the phonon energy softens dramatically at the onset q 0.4 Å-1, while such a softening gets much weaker when . In Fig. 4 (b), represents the phonon dispersion if the EPC is turned off in our model, which is almost isotropic.
In conclusion, the measured phonon structure combined with a detailed knowledge of the electronic structure from ARPES can be used to determine the EPC matrix element directly. Our approach is completely general and could be applicable for other complex systems with highly anisotropic electronic structures. Our study also highlight the necessity of probing bosons for revealing the full structure of EBC in these complex systems.
Acknowledgements.
This work is supported by China NSF-10704084, “973”program of China MOST (No. 2006CB921300 and No. 2007CB936800), NSF (DMR-0346826, DMR-0451163 and DMS & E). Zhang and Guo gratefully acknowledge the support of K. C. Wong Education Foundation, Hong Kong.References
- (1) J. P. Carbotte, Rev. Mod. Phys. 62, 1027 (1990).
- (2) M. L. Kuli, Phys. Rep. 338, 1 (2000).
- (3) O. Gunnarsson and O. Rösch, J. Phys.: Condens. Matter 20, 043201 (2008).
- (4) Göran Grimvall, The electron-phonon interaction in metals, pp. 196, North-Holland Publishing Company (1981).
- (5) J. M. Rowell et al., Phys. Rev. Lett.10, 334 (1963); D. J. Scalapino et al., Phys. Rev. 148, 263 (1966).
- (6) W. L. McMillan and J. M. Rowell, Superconductivity, Volume 1, edited by R. D. Park, Marcel Dekker, New York (1969).
- (7) J. R. Shi et al., Phys. Rev. Lett. 92, 186401(2004).
- (8) X. J. Zhou et al., Phys. Rev. Lett. 95, 117001(2005).
- (9) W. Meevasana et al., Phys. Rev. Lett. 96, 157003(2006).
- (10) T. Chien et al., Phys. Rev. B 80, 241416(R) (2009).
- (11) N. Bulut and D. J. Scalapino, Phys. Rev. B 54, 14971 (1996).
- (12) T. P. Devereaux et al., Phys. Rev. Lett. 93, 117004 (2004).
- (13) T. Cuk et al., Phys. Rev. Lett. 93, 117003 (2004).
- (14) J. C. Campuzano et al., Phys. Rev. Lett. 83, 3709 (1999).
- (15) T. Cuk et al., Phys. Stat. Sol. (b) 242, 11 (2005).
- (16) A. Damascelli et al., Rev. Mod. Phys. 75, 473 (2003).
- (17) A. Lanzara1 et al., Nature 412, 510 (2001).
- (18) P. V. Bogdanov et al., Phys. Rev. Lett. 85, 2581 (2000).
- (19) P. D. Johnson et al., Phys. Rev. Lett. 87, 177007 (2001).
- (20) J. D. Koralek et al., Phys. Rev. Lett. 96, 017005 (2006).
- (21) A. D. Gromko et al., Phys. Rev. B 68, 174520 (2003).
- (22) Masato Kakihana et al., Phys. Rev. B 53, 11796 (1996).
- (23) N. N. Kovaleva et al., Phys. Rev. B 69, 054511 (2004).
- (24) R. B. Phelps and P. Akavoor, Phys. Rev. B 48, 12936 (1993).
- (25) L. Pintschovius et al., Phys. Stat. Sol. (b) 242, 30 (2005).
- (26) J. Graf et al., Phys. Rev. lett. 100, 227002 (2008).
- (27) The high-energy shoulder of F2 can be deconvoluted from the main feature by fitting the raw spectra with two standard spectral functions. The deconvolution makes no qualitative difference to the q∥-dependent energy or linewidth from the raw data. We presented the deconvoluted results in this letter.
- (28) M. R. Norman et al., Phys. Rev. B 52, 615 (1995).