IFU Spectroscopy of the Stellar Disk Truncation Region of NGC 6155111 This paper includes data taken at The McDonald Observatory of The University of Texas at Austin.
Abstract
Like the majority of spiral galaxies, NGC 6155 exhibits an exponential surface brightness profile that steepens significantly at large radii. Using the VIRUS-P IFU spectrograph, we have gathered spatially resolved spectra of the system. Modifying the GANDALF spectral fitting routine for use on the complex stellar populations found in spirals, we find that the average stellar ages increase significantly beyond the profile break radius. This result is in good agreement with recent simulations that predict the outskirts of disk galaxies are populated through stellar migration. With the ability to bin multiple fibers, we are able to measure stellar population ages down to mag/sq arcsec.
Subject headings:
galaxies: formation — galaxies: structure — galaxies: stellar content — galaxies: individual(NGC 6155) — galaxies: spiral1. Introduction
The nature of how and where stellar disks end can shed light on the limits of star formation and the importance of secular evolution. Stellar disks tend to be embedded in much larger HI disks (Bosma, 1981; Broeils & Rhee, 1997; Begum et al., 2005), showing that while there are baryons in the outskirts of galaxies, they are not being converted into stars efficiently. It is often assumed that there is a surface density threshold for star formation (Kennicutt, 1989) which would provide a natural mechanism for truncating the stellar component of galaxies.
The surface brightness profiles of spiral galaxies are commonly fit with exponentials (Freeman, 1970). While the exponential function is a convenient description, few astronomers would suggest that stellar disks extend to infinite radii. Observations of edge-on systems originally suggested that stellar disks have well defined truncation radii (van der Kruit & Searle, 1981; Kregel & van der Kruit, 2004). Using large samples of nearly face-on galaxies, Pohlen & Trujillo (2006) found a variety of behaviors at large galactic radii. Pohlen & Trujillo (2006) find that only 10% of disks are well fit by a single exponential light profile, while in 60% of their sample the surface brightness profile is well fit by a downbending broken exponental, with a break radius 1.5-4.5 times the inner scale length. The final 30% of their sample are described with a broken upbending exponential profile. Unlike the edge-on studies, they do not find evidence for sharp truncations.
Roškar et al. (2008) present a possible formation mechanism for surface brightness profile breaks. They find that a star formation threshold seeds the onset of a truncation, but radial migration populates the disk beyond the break producing a down-bending broken profile. Since the stellar migration is a random walk, only ancient stars have had enough time to get to very large radii beyond where star formation shuts off. These simulations thus predict that the break radius should correspond with an increase in the average stellar ages. The formation and appearance of outer disks has since been investigated in cosmological simulations by several groups who also find an upturn in age at the break radius (Sánchez-Blázquez et al., 2009; Martínez-Serrano et al., 2009). However, the relative importance of radial migration and in-situ star formation in a fully-cosmological setting remains an open question.
While simulations find that profile breaks can be caused by a combination of a star formation threshold and stellar migration, observations suggest that star formation can proceed even in the outskirts of disks. Deep imaging by Ferguson et al. (1998b) show signs of extended star formation. Thilker et al. (2007) also find that % of spiral galaxies have UV emission extending beyond their traditional star formation threshold radius. Similarly, Herbert-Fort et al. (2009) find clustering of point sources around NGC 3184, implying star cluster formation in the outer disk.
Recent observations of resolved stars have found a variety of results for stellar truncation regions. Williams et al. (2009a) find that in low-mass M33 the the age gradient changes from negative to positive at the truncation radius. Meanwhile, de Jong et al. (2007) find that the truncation region in NGC 4244 is the same for stars of all ages. de Jong et al. (2007) interpret this as a sign the truncation is the result of a dynamical interaction, but these results were subsequently shown to be consistent with the radial migration model (Roškar et al., 2008). See Vlajić (2010) for a review of the recent advances in studying the outskirts of spiral disks. The observational results point to an interesting conundrum that while many studies find active star formation in the outskirts of disk galaxies, the stars in the region are often older than the inner disk.
To date, truncation regions have been studied with broadband colors and resolved stars. There are a limited number of systems we can resolve, and faint broadband surface photometry is dominated by systematic errors associated with flat-fielding and sky subtraction. While there have been searches targeting emission lines (Ferguson et al., 1998a; Christlein et al., 2010), in this letter we present the first spectroscopic study of stellar continuum spectral features across a surface brightness profile break.
2. Observations
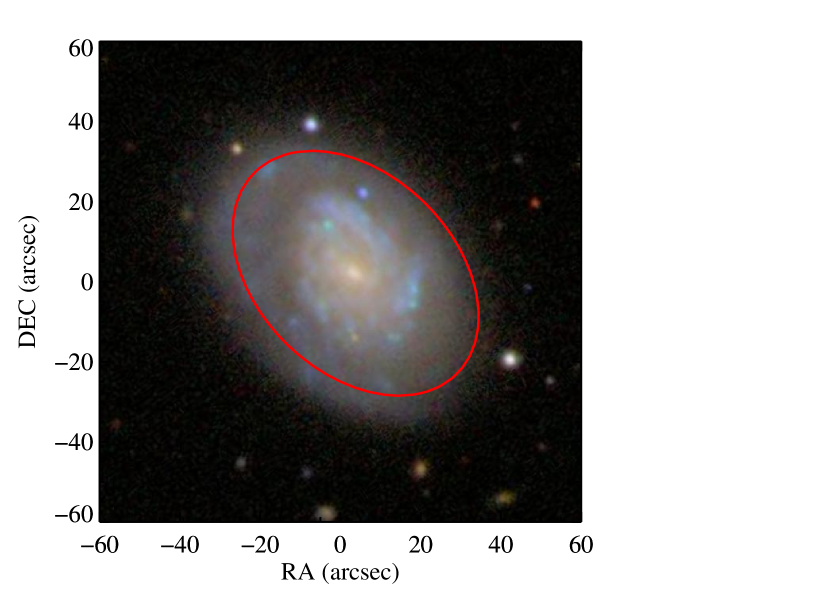
Observations of NGC 6155 (RA 16:26:08, DEC +48:22:01, J2000) were taken with the Visible Integral field Replicable Unit Spectrograph Prototype (VIRUS-P) (Hill et al., 2008) on the McDonald Observatory 2.7m Harlan J. Smith telescope on April 9 and 11, 2008. VIRUS-P is a 1.7′x 1.7′ field-of-view IFU spectrograph with 246 4.3′′ diameter fibers. Observations were taken in a three-step dither pattern to attain full spatial coverage. We observed four 20 minute exposures at each dither position for a total of four hours of exposure time. The data were reduced with the VACCINE package (Adams et al. in prep) in combination with custom IDL routines. Wavelength calibration was performed using observations of Hg and Cd arc lamps. Twilight sky exposures were used to generate flat-field frames. We observed the stars Feige 34 and BD+33 2642 to establish flux calibration. The final result is a data cube with 738 spectra filling a 1.7′x 1.7′ field of view and a FWHM resolution of 5.3 Å with 2.2 Å pixels and a wavelength range of 3550-5580 Å. We mask a 10 Å region around the bright 5577 Å O I skyline.
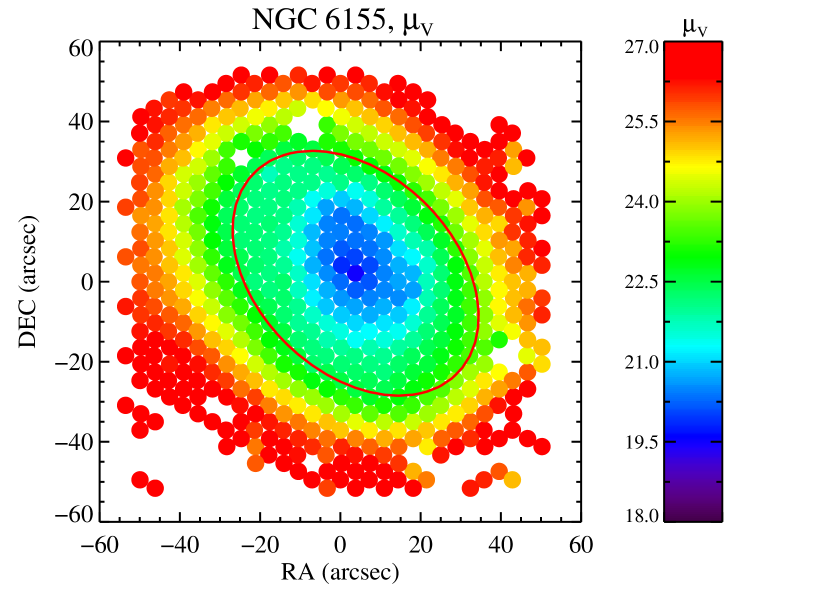
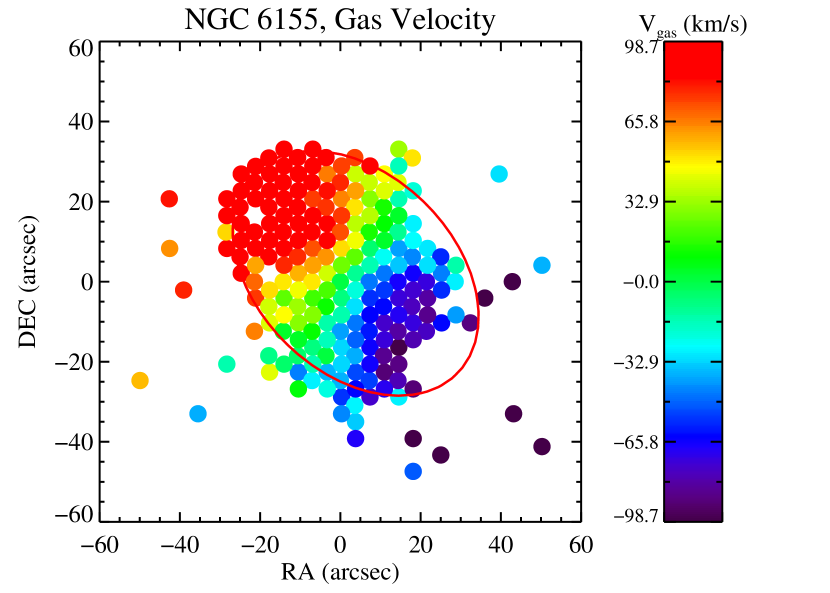
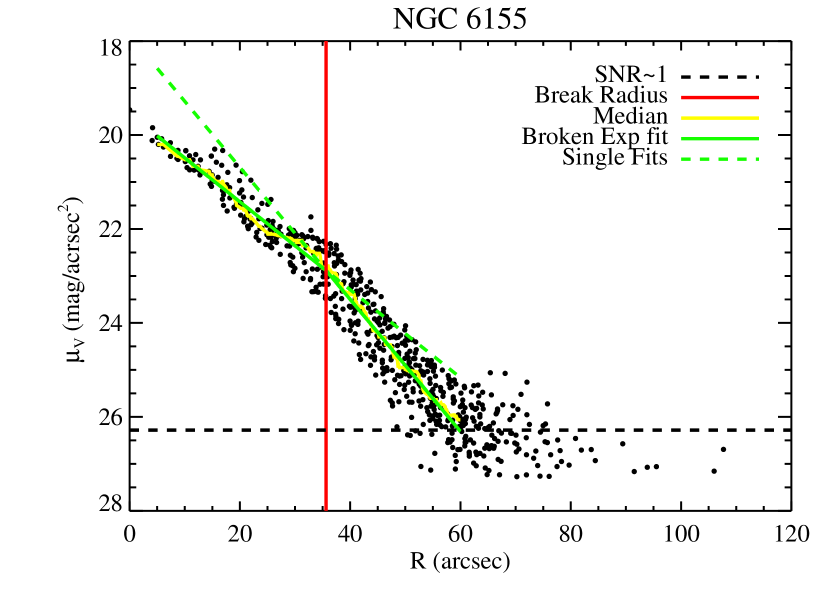
Using the -band surface brightness measured from our data cube we find an inclination of 46 degrees and position angle of 135 degrees (East of North). These values are consistent with the measured velocity field. The radial surface brightness profile is well fit with a broken exponential with a break radius of 36′′, where the scale length changes from 11.6′′ to 7.7′′. We fit the region of 5′′ R 60′′ to avoid any central bulge and outer regions of low SNR. Pohlen & Trujillo (2006) fit the SDSS image of NGC 6155 and find a break radius of 34′′ and scale lengths of 12.2 (13.1) and 8.1 (7.3) in the () band. Our values are an excellent match to the Pohlen & Trujillo (2006) fits, especially considering our lower spatial resolution. Figure 1 shows our fiber photometry, the velocity field measured from gas emission lines (, [O iii], and [O ii]), and our radial profile fit.
We re-binned the spectra to a common velocity. Spectra were then co-added in 4′′ elliptical annuli of constant galactic radius to reach adequate SNR at large radii. Fibers that contained bright stars or background galaxies were masked. Our final binned spectra have SNR/Å320 in the inner regions and beyond the break radius. We assume a Virgo infall corrected redshift to NGC 6155 of 2549 km s-1(38.3 Mpc).
3. Stellar Population Synthesis
Historically, prominent individual spectral absorption features have been used to constrain the flux-weighted average age of stellar populations. Systems based on stellar absorption features like Lick indices have proven useful for old elliptical stellar populations (e.g., Worthey et al., 1994; Trager et al., 2000), but become difficult to interpret when there are multiple stellar populations or extended star formation histories (Serra & Trager, 2007).
There are now a host of packages developed to measure star formation histories (SFHs) from integrated spectra (e.g., Ocvirk et al., 2006; MacArthur et al., 2009; Tojeiro et al., 2007; Koleva et al., 2009; Chilingarian et al., 2007). All of these codes attempt to model observed galactic spectra as a linear combination of single-burst simple stellar populations (SSPs). While it should be possible in theory to reconstruct a star formation history as a series of SSPs, in practice, we find that the problem becomes degenerate at low SNR. There is also a strong degeneracy between including dust extinction and the presence of an old red stellar population. In general, we find that it is very difficult to constrain an average stellar age using a linear combination of SSPs.
Unlike spheroidal systems that can be well described as having only old stars, spiral disks overwhelmingly display a mix of very old and newly formed stars. Observations of resolved stars in nearby spiral galaxies show that star formation histories are extended at all radii (Williams et al., 2009a, b; Gogarten et al., 2010; Barker et al., 2007). Similarly, the solar neighborhood in the Milky Way contains young stars, intermediate age stars like the sun, and very old thick disk stars.
Motivated by the observational results that even the outskirts of galaxies have a mix of stellar ages, we have constructed a large library of extended SFHs and find the best fitting single spectrum. We use the latest stellar synthesis package from Charlot & Bruzual (Charlot & Bruzual, 2007; Bruzual, 2007) to generate a suite of composite stellar population spectra. For all the models, we assume an exponential star formation history of the form
| (1) |
where is the star formation rate and is the star forming time-scale. We include both positive and negative values of . All the models are computed at an age of 13 Gyr. We generate 1664 total model spectra, with values of ranging from -200 Gyr to -0.25 Gyr, and 0.5 Gyr to 200 Gyr. Negative values of represent an increasing star formation rate. Small absolute values of represent extreme stellar populations (dominated by very old stars or newly formed stars), while large absolute values of are effectively constant star formation histories. Our models span mass-weighted ages of 15 Myr to 12.7 Gyr. The metallicity values run from Z=10-4 to 0.1 (with solar defined as Z=0.02). We use the Padova 1994 stellar evolutionary tracks and a Chabrier initial mass function (IMF).
We do not include any metallicity evolution in the models, thus our fits only return a flux-weighted average metallicity. The advantage of our method is that it runs fairly quickly because of the limited parameter space and the SFHs are motivated by observations of spatially resolved stellar populations. The disadvantage is that our metallicity measure is fairly crude since we do not include chemical evolution. Also, we can not expect our fits to be robust if a galaxy has undergone strong episodic bursts of star formation. We do not include -element variations in our spectral models, however as a late-type spiral, we would not expect NGC 6155 to be particularly enhanced. We emphasize that our fitted SFHs are a measure of the current stellar populations, after radial mixing and azimuthal binning, and not a measure of the actual star formation history at a fixed radius.
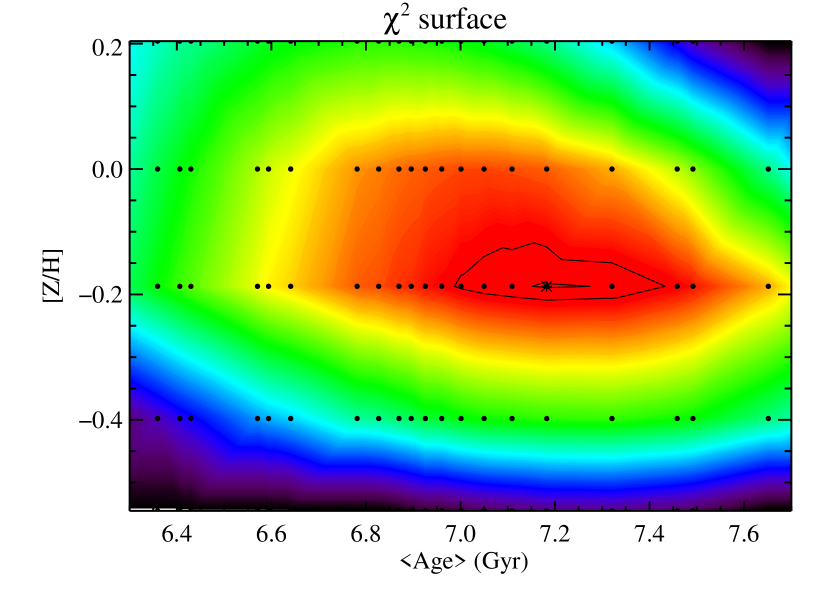
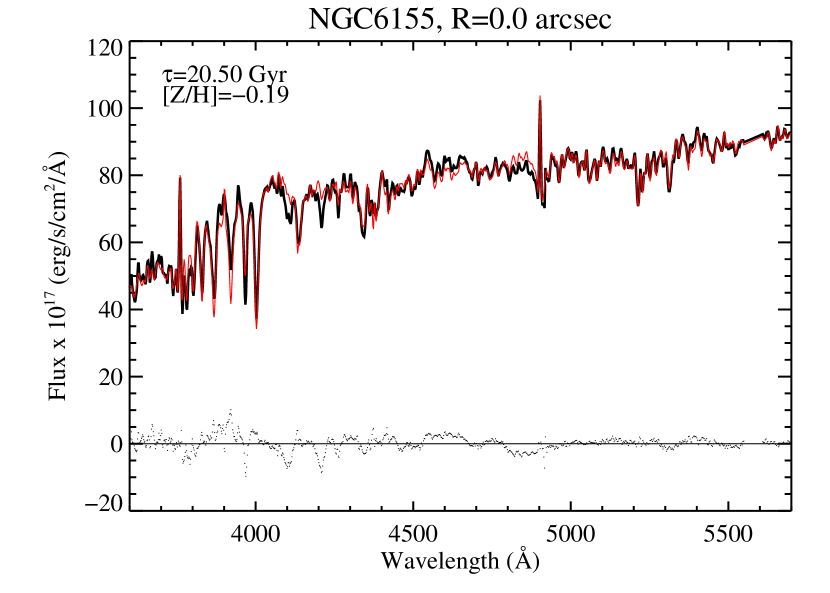
We use the Gas AND Absorption Line Fitting (GANDALF) package (Sarzi et al., 2006) along with the penalized pixel fitting (pPXF) (Cappellari & Emsellem, 2004) code to find the best-fitting model for each binned spectrum. The pPXF code fits a stellar velocity and dispersion which is then held constant for the rest of the fit. GANDALF multiplies model spectra by a low-order polynomial (to correct for dust extinction and flux calibration mis-matches), and simultaneously fits specified emission lines as Gaussians. Figure 2 shows an example of our fitting procedure. The use of the polynomial ensures that the fit matches the spectral absorption features, and the overall tilt or broadband color does not affect the fit. Because dust extinction has a negligible effect on the relative depth of absorption features (MacArthur, 2005), our fitting method does not require correcting the spectra for internal or foreground extinction.
The uncertainty in our fits should be dominated by the systematic difference between the adopted smooth SFH and the bursty SFHs of real galaxies. To test the errors associated with SFH mismatch, we have generated integrated spectra using the SFHs measured from resolved populations in NGC 300 (Gogarten et al., 2010) and fit them with our SFHs. The inner regions of NGC 300 have SFHs strongly peaked at an age of 12 Gyr while the outer regions have constant or increasing SFRs. The radial bins of NGC 300 have average ages ranging from 5.2-9.6 Gyr. Fitting our exponential SFHs, we are able to match the relative ages of each radial bin in NGC 300 and have an absolute age dispersion of Gyr. The largest source of error seems to be recent bursts of star formation causing our fitting routine to converge on ages that are younger than the actual mass-weighted stellar population.
Figure 2 shows an example of our data and fitting procedure. The fits become noticeably worse blueward of 4300 Å. There are several possible reasons for the poor fit in the blue. The instrument throughput in the blue during these observations was low, resulting in poorer SNR. The templates may need improvement in the blue. Finally, the poor fit could also be a systematic error left over from imperfect sky subtraction. We have experimented with masking this region and find the fits remain basically unchanged. We emphasize that our errors are clearly non-Gaussian and are dominated by the systematics of template mismatch and SFH mismatch. Therefore, rather than adopt the standard error bars derived from contour, we plot the larger error bars derived from our experiment fitting the observed SFH of NGC 300. We also note that a recent burst of star formation could bias our measurements to return values that are too young.
4. Results
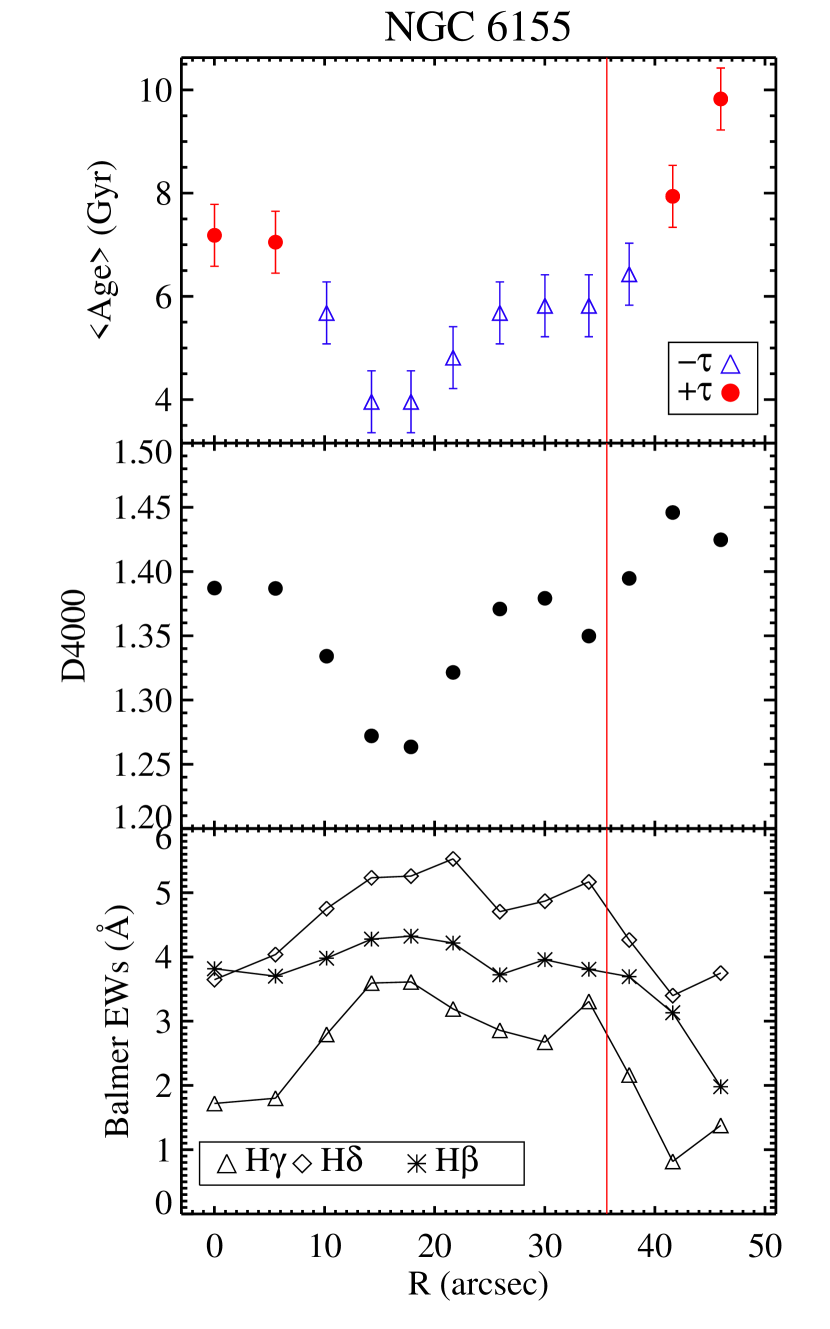
The results of our stellar population fits are plotted in Figure 3. The central region is best fit by a decreasing star formation rate, with a mass-weighted age of Gyr. The region at a radius of 15′′ (2.8 kpc) is dominated by very young stars and active star formation. This is clearly visible in the SDSS image as a region dominated by a star forming ring or inner spiral arms. Beyond the star forming region, the stars remain young and dominated by recent formation. Past the surface brightness break radius at 34′′ ( kpc), there is a sudden change, and the stars are best described with older stellar populations and declining SFHs. This is an impressive confirmation of the hypothesis that stars beyond the break radius are populated by stellar migration and should show an upturn in stellar age.
Our fits return a metallicity [Z/H] for most of the region before the profile break. Beyond the profile break, the metallicity drops to [Z/H]. While this is consistent with the stellar migration hypothesis, we caution that this is still only a crude measure of the stellar metallicities.
5. Discussion
Pohlen & Trujillo (2006) describe NGC 6155 as lopsided and classify the galaxy as a Type II-AB (a downbending profile in an asymmetric disk). While our fiber-photometry shows slight lopsidedness, the velocity field is quite regular and there are no nearby neighbors. All the galaxies within a 1 Mpc projected radius and similar redshift of NGC 6155 are at least 3 magnitudes fainter. It therefore seems unlikely that the profile break in NGC 6155 is the result of a dynamical interaction with a neighboring galaxy.
Our result that average stellar ages increase beyond the break radius is consistent with the results of Bakos et al. (2008) who stacked multiple SDSS images and found the color became redder beyond the profile break. This is also similar to the age gradient observed in M33, with the age decreasing out to the profile break where the gradient reverses and the stellar population becomes older beyond the break (Williams et al., 2009a). Bakos et al. (2008) claim that while their stacked surface brightness profiles shows a break, the stellar mass profile is described by a single exponential. Our model mass-to-light values are not well constrained beyond the profile break, however, the increase in age we detect does suggest the M/L is larger in this region. Therefore we expect the stellar mass profile to be smoother than the light profile.
The increase in stellar age we measure is very similar to the simulations of Roškar et al. (2008) where the average stellar age jumps from 4 to 6 Gyr. The best fits beyond the break radius have Gyr, consistent with significant ongoing star formation in the region. We therefore take our results as evidence that while stellar migration can populate outer disks, our fits are consistent with some low-level in situ star formation as well.
Along with the change in stellar age, the surface brightness break also corresponds with a lack of line emission (Figure 1, lower left). This could be a simple coincidence where the break radius is also where the emission becomes faint enough that we no longer detect it, but it is also consistent with the theory that the break radius represents the location of a star formation threshold.
It should be pointed out that our observations are also consistent with a radial change in the stellar IMF. If the outer disk only hosts lower-mass molecular clouds, we could expect star formation to be unable to produce the highest mass stars (Kroupa & Weidner, 2003; Köppen et al., 2007). Because young massive stars contribute heavily to the overall luminosity, their absence would result in a young stellar population that spectroscopically appears older. A change in the IMF can also explain the lack of emission lines beyond the break (Pflamm-Altenburg & Kroupa, 2008).
In a forthcoming paper, we will present a larger sample of similar observations. Our larger sample includes galaxies with no surface brightness profile break as well as up-bending profiles. We also plan to further refine our spectral synthesis template fitting method to improve the metallicity measurements of the stellar populations.
References
- Bakos et al. (2008) Bakos, J., Trujillo, I., & Pohlen, M. 2008, ApJ, 683, L103
- Barker et al. (2007) Barker, M. K., Sarajedini, A., Geisler, D., Harding, P., & Schommer, R. 2007, AJ, 133, 1138
- Begum et al. (2005) Begum, A., Chengalur, J. N., & Karachentsev, I. D. 2005, A&A, 433, L1
- Bosma (1981) Bosma, A. 1981, AJ, 86, 1825
- Broeils & Rhee (1997) Broeils, A. H., & Rhee, M. 1997, A&A, 324, 877
- Bruzual (2007) Bruzual, G. 2007, arXiv:astro-ph/0703052
- Cappellari & Emsellem (2004) Cappellari, M., & Emsellem, E. 2004, PASP, 116, 138
- Charlot & Bruzual (2007) Charlot, S., & Bruzual, G. 2007, in prep
- Chilingarian et al. (2007) Chilingarian, I., Prugniel, P., Sil’Chenko, O., & Koleva, M. 2007, IAU Symposium, 241, 175
- Christlein et al. (2010) Christlein, D., Zaritsky, D., & Bland-Hawthorn, J. 2010, ArXiv e-prints, 1003.4872
- de Jong et al. (2007) de Jong, R. S., Seth, A. C., Radburn-Smith, D. J., Bell, E. F., Brown, T. M., Bullock, J. S., Courteau, S., Dalcanton, J. J., Ferguson, H. C., Goudfrooij, P., Holfeltz, S., Holwerda, B. W., Purcell, C., Sick, J., & Zucker, D. B. 2007, ApJ, 667, L49
- Ferguson et al. (1998a) Ferguson, A. M. N., Gallagher, J. S., & Wyse, R. F. G. 1998a, AJ, 116, 673
- Ferguson et al. (1998b) Ferguson, A. M. N., Wyse, R. F. G., Gallagher, J. S., & Hunter, D. A. 1998b, ApJ, 506, L19
- Freeman (1970) Freeman, K. C. 1970, ApJ, 160, 811
- Gogarten et al. (2010) Gogarten, S. M., Dalcanton, J. J., Williams, B. F., Roškar, R., Holtzman, J., Seth, A. C., Dolphin, A., Weisz, D., Cole, A., Debattista, V. P., Gilbert, K. M., Olsen, K., Skillman, E., de Jong, R. S., Karachentsev, I. D., & Quinn, T. R. 2010, ApJ, 712, 858
- Herbert-Fort et al. (2009) Herbert-Fort, S., Zaritsky, D., Moustakas, J., Christlein, D., Wilcots, E., Baruffolo, A., Di Paola, A., Fontana, A., Giallongo, E., Pogge, R. W., Ragazzoni, R., & Smareglia, R. 2009, ApJ, 700, 1977
- Hill et al. (2008) Hill, G. J., MacQueen, P. J., Smith, M. P., Tufts, J. R., Roth, M. M., Kelz, A., Adams, J. J., Drory, N., Grupp, F., Barnes, S. I., Blanc, G. A., Murphy, J. D., Altmann, W., Wesley, G. L., Segura, P. R., Good, J. M., Booth, J. A., Bauer, S., Popow, E., Goertz, J. A., Edmonston, R. D., & Wilkinson, C. P. 2008, SPIE, 7014
- Kennicutt (1989) Kennicutt, Jr., R. C. 1989, ApJ, 344, 685
- Koleva et al. (2009) Koleva, M., Prugniel, P., Bouchard, A., & Wu, Y. 2009, A&A, 501, 1269
- Köppen et al. (2007) Köppen, J., Weidner, C., & Kroupa, P. 2007, MNRAS, 375, 673
- Kregel & van der Kruit (2004) Kregel, M., & van der Kruit, P. C. 2004, MNRAS, 355, 143
- Kroupa & Weidner (2003) Kroupa, P., & Weidner, C. 2003, ApJ, 598, 1076
- MacArthur (2005) MacArthur, L. A. 2005, ApJ, 623, 795
- MacArthur et al. (2009) MacArthur, L. A., González, J. J., & Courteau, S. 2009, MNRAS, 395, 28
- Martínez-Serrano et al. (2009) Martínez-Serrano, F. J., Serna, A., Doménech-Moral, M., & Domínguez-Tenreiro, R. 2009, ArXiv e-prints 0906.1118
- Ocvirk et al. (2006) Ocvirk, P., Pichon, C., Lançon, A., & Thiébaut, E. 2006, MNRAS, 365, 46
- Pflamm-Altenburg & Kroupa (2008) Pflamm-Altenburg, J., & Kroupa, P. 2008, Nature, 455, 641
- Pohlen & Trujillo (2006) Pohlen, M., & Trujillo, I. 2006, A&A, 454, 759
- Roškar et al. (2008) Roškar, R., Debattista, V. P., Stinson, G. S., Quinn, T. R., Kaufmann, T., & Wadsley, J. 2008, ApJ, 675, L65
- Sánchez-Blázquez et al. (2009) Sánchez-Blázquez, P., Courty, S., Gibson, B. K., & Brook, C. B. 2009, MNRAS, 398, 591
- Sarzi et al. (2006) Sarzi, M., Falcón-Barroso, J., Davies, R. L., Bacon, R., Bureau, M., Cappellari, M., de Zeeuw, P. T., Emsellem, E., Fathi, K., Krajnović, D., Kuntschner, H., McDermid, R. M., & Peletier, R. F. 2006, MNRAS, 366, 1151
- Serra & Trager (2007) Serra, P., & Trager, S. C. 2007, MNRAS, 374, 769
- Thilker et al. (2007) Thilker, D. A., Bianchi, L., Meurer, G., Gil de Paz, A., Boissier, S., Madore, B. F., Boselli, A., Ferguson, A. M. N., Muñoz-Mateos, J. C., Madsen, G. J., Hameed, S., Overzier, R. A., Forster, K., Friedman, P. G., Martin, D. C., Morrissey, P., Neff, S. G., Schiminovich, D., Seibert, M., Small, T., Wyder, T. K., Donas, J., Heckman, T. M., Lee, Y.-W., Milliard, B., Rich, R. M., Szalay, A. S., Welsh, B. Y., & Yi, S. K. 2007, ApJS, 173, 538
- Tojeiro et al. (2007) Tojeiro, R., Heavens, A. F., Jimenez, R., & Panter, B. 2007, MNRAS, 381, 1252
- Trager et al. (2000) Trager, S. C., Faber, S. M., Worthey, G., & González, J. J. 2000, AJ, 119, 1645
- van der Kruit & Searle (1981) van der Kruit, P. C., & Searle, L. 1981, A&A, 95, 105
- Vlajić (2010) Vlajić, M. 2010, ArXiv e-prints, 1003.2565
- Williams et al. (2009a) Williams, B. F., Dalcanton, J. J., Dolphin, A. E., Holtzman, J., & Sarajedini, A. 2009a, ApJ, 695, L15
- Williams et al. (2009b) Williams, B. F., Dalcanton, J. J., Seth, A. C., Weisz, D., Dolphin, A., Skillman, E., Harris, J., Holtzman, J., Girardi, L., de Jong, R. S., Olsen, K., Cole, A., Gallart, C., Gogarten, S. M., Hidalgo, S. L., Mateo, M., Rosema, K., Stetson, P. B., & Quinn, T. 2009b, AJ, 137, 419
- Worthey et al. (1994) Worthey, G., Faber, S. M., Gonzalez, J. J., & Burstein, D. 1994, ApJS, 94, 687