Type Ibc supernovae in disturbed galaxies: evidence for a top-heavy IMF
Abstract
We compare the radial locations of 178 core-collapse supernovae to the -band and H light distributions of their host galaxies. When the galaxies are split into ‘disturbed’ and ‘undisturbed’ categories, a striking difference emerges. The disturbed galaxies have a central excess of core-collapse supernovae, and this excess is almost completely dominated by supernovae of types Ib, Ic and Ib/c, whereas type II supernovae dominate in all other environments. The difference cannot easily be explained by metallicity or extinction effects, and thus we propose that this is direct evidence for a stellar initial mass function that is strongly weighted towards high mass stars, specifically in the central regions of disturbed galaxies.
Keywords: galaxies:interactions–galaxies:ISM–supernovae:general
1 Introduction
Following the pioneering work of Larson & Tinsley (1978), many studies have confirmed that tidal disturbance following galaxy interactions is an efficient trigger of star formation in galaxies (e.g. Joseph et al., 1984; Kennicutt & Keel, 1984). Such star formation frequently takes the form of centrally-concentrated nuclear starbursts (Joseph & Wright, 1985), fuelled by the central concentrations of molecular gas found to occur naturally in simulations of highly-disturbed systems (Barnes & Hernquist, 1991; Mihos & Hernquist, 1996). The strength of the link between starbursts and interactions was highlighted by the finding that almost all of the ‘ultra-luminous infrared galaxies’ (ULIRGs) display signs of interactions or mergers (Sanders et al., 1988; Borne et al., 1999), and by correlations between galaxy-galaxy separations and starburst strength (Barton et al., 2000). Even minor mergers with low-mass companions have been shown through simulations to result in significant nuclear star formation activity (Mihos & Hernquist, 1994).
Several early studies of nuclear starbursts suggested that this star formation might require a top heavy initial mass function (IMF), preferentially producing high mass stars (Rieke et al., 1980; Doyon et al., 1992). There is theoretical support for this suggestion, with simulations showing that an IMF weighted to high-mass stars naturally arises in high-density regions, due to feedback processes heating the gas. In a recent study, Krumholz et al. (2010) have demonstrated that such regions should have a high-mass stellar fraction at least 1.7 times larger, and possibly much more, than lower density, more quiescent regions.
However, the observational evidence for this variation has to date proved controversial (see Bastian et al. 2010 for a recent review). Some studies have found indirect evidence for top-heavy IMFs with, for example, Rieke et al. (1993) concluding that the nearby starburst galaxy M82 requires an IMF biased to high mass stars to explain its emission line ratios and total luminosity. Similar techniques have been used for NGC 3256 (an ongoing merger with a ‘super-starburst’) which have again shown indications of a modified IMF with an excess of high mass stars (Doyon et al., 1994). Gibson & Matteucci (1997) showed that, in order to reproduce the observed colour-luminosity relation of elliptical galaxies, an IMF much flatter than that of Salpeter (1955) needed to be adopted. Baugh et al. (2005) had to employ a top heavy IMF for the starbursts powering the distant population of highly luminous submillimetre galaxies in order to explain the number counts of these systems. Finally, Brassington et al. (2007) studied nine interacting galaxies from the survey and found that highly disturbed systems showed a strongly enhanced infrared luminosity compared to that expected from the x-ray emission, again suggesting the need for a top-heavy IMF.
More direct evidence of a variation in IMF has been found for the resolved stellar population of the young Arches cluster in the Galactic Centre. Figer et al. (1999); Stolte et al. (2002); Paumard et al. (2006); Espinoza et al. (2009) all find evidence for stellar mass functions weighted towards high-mass stars in this cluster or the general Galactic Centre region. Such mass functions are parametrized as an IMF that is either much flatter than that found by Salpeter (1955), or having a higher mass turnover than is found in the function for field stars.
One possible tracer of the IMF that has not been fully exploited to date is the relative numbers of core-collapse supernovae (CCSNe) of different types. Their short progenitor lifetimes and high luminosities make them powerful indicators of recent or ongoing star formation, and indeed they provide the only direct tracer of recent star formation within unresolved stellar populations. Recent advances in the understanding of supernovae and their progenitors raise the possibility that they can provide information on the initial mass function of a young stellar population. Theoretical models of single star progenitors predict that SNII should have lower mass progenitors than SNIb or SNIc (Heger et al., 2003; Eldridge & Tout, 2004). This has received observational support from studies of the strength of association with H emission (Anderson & James, 2008), confirming that SNII have the lowest mass CC progenitors, but additionally indicating that the SNIc have still higher mass progenitors than the SNIb. The existence of this II-Ib-Ic progenitor mass sequence allows information on the IMF of the stellar population in the SN environments to be derived from the relative numbers of type II, Ib and Ic supernovae.
Petrosian & Turatto (1995) studied the distribution of SNe events in 32 interacting systems containing 12 known core collapse SNe. They found that the radial distribution of these core collapse events showed a higher concentration towards the nuclear regions of the interacting galaxies when compared to isolated galaxies. This confirmed the enhanced star formation around the central regions of the systems, but the sample was too small to analyse the separate types of CCSNe.
This paper will therefore use a larger sample of local CCSNe to explore the IMF in nuclear starbursts, resulting from galaxy disturbance, by studying the ratio of type II/Ibc SNe in both disturbed and undisturbed host galaxies. Throughout this paper, we use ‘Ibc’ to encompass all SNe with classifications of Ib, Ic or Ib/c.
The structure of the paper is as follows: In Section 2 we will define and discuss the sample used throughout this work. Section 3 will describe the results on the radial distributions, for disturbed and undisturbed hosts and looking separately at type II and Ibc SNe. In Section 4 we discuss the possible interpretations of our results, in terms of metallicity, extinction and IMF effects. Finally, Section 5 contains a summary of our conclusions.
2 Sample and observations
The sample used in this work consists of 140 local (recession velocity 6000 km/s) spiral galaxies, hosts to 178 CCSNe (110 SNII and 68 SNIbc), for which we have H and -band observations from the Liverpool Telescope (LT) and Isaac Newton Telescope (INT). (Some galaxies do not have usable images in either H or -band and have been omitted from the corresponding plots and statistics; see Tables 1 & 2 in the online material). This is the same dataset as was used by Anderson & James (2009) with a small number of subsequent observations. SNe classified as type IIb are not included in this sample as they are thought to be transitional objects between SNII and SNIb, with substantially larger progenitor masses (25 M⊙; Smartt 2009) than typical SNII. A comparison performed on January 21st 2010 with all CCSNe host galaxies within the same recession velocity limit in the IAU SN catalogue111http://www.cfa.harvard.edu/iau/lists/Supernovae.html, and where the SNe have accurate classifications and positions, showed this sample to be 34% complete for SNIbc and 18% complete for SNII.
The classification of host galaxies as disturbed is purely by visual inspection by the authors and thus is subjective. Galaxies which show signs of tidal tails, definite interaction, double nuclei or strong asymmetry have therefore been classed as disturbed.
3 Results
The total sample of CCSNe is dominated by SNII (62% of the total). When the sample is constrained only to supernovae which lie in disturbed hosts (64 CCSNe) this falls to 56% SNII, compared to 65% SNII in the non-disturbed hosts.
For each of the CCSNe in our sample we have calculated the Fr() and Fr(H) statistics used, and explained fully, in Anderson & James (2009). Briefly, these represent the fractions of galaxy emission, in the -band and H respectively, that lie within the circle or ellipse which contains the SN. Thus Fr()0.0 corresponds to a supernova at the central -band peak of the galaxy emission, or closer to this peak than any H emission, in the case of Fr(H); whilst Fr1.0 implies an extreme outlying SN. If the emission is statistically a good tracer of the parent population of supernovae, the Fr values should have a flat distribution with a mean value of 0.5.
Figures 1 and 2 show the distributions of Fr() values for the CCSNe in the present sample, for the undisturbed and disturbed galaxies respectively. In all histograms shown in this paper, the upper plot represents the CCSNe sample, the middle the type II SNe and the lower SNIbc. Looking first at the overall distributions of CCSNe, there is a clear difference between the disturbed and undisturbed subsets, in the sense that the disturbed galaxies have substantially more CCSNe occurring in their central regions, with low Fr() values. For example, 36 of the 58 CCSNe in the disturbed sample occur within the central 50% of the -band light, 62% of the total, compared with 50 out of 112 (45%) in the undisturbed galaxies. A Kolmogorov-Smirnov (KS) test shows that the chance of the two total CCSNe distributions being drawn from the same parent distribution is P0.037. Thus there is evidence at the 2 level that galaxy disturbance correlates with centrally-enhanced star formation and hence the production of an increased central fraction of CCSNe.
The most striking aspect of Figure 2 is the types of SNe that make up this central excess in the disturbed galaxies. Remarkably, given that SNIbc only comprise 38% of the overall CCSN sample (68/178), all 5 of the CCSNe coming from the central 10% of the disturbed host galaxy light, and 11 of the 13 coming from the central 20% of the light, are of type Ibc. A KS test of the Fr() distributions for the disturbed galaxy subsample finds P0.003, indicating a very low probability that the SNIbc and SNII Fr() values are drawn from the same parent distribution. The mean values of Fr() are 0.31 (95% confidence limits 0.20–0.42) for the SNIbc in the disturbed galaxies, compared with 0.51 (0.44–0.59) for the SNII in the disturbed galaxies. This is the main observational result from this paper; the CCSNe occurring in the central regions of disturbed galaxies are heavily weighted towards types Ib, Ic and Ib/c. We will discuss possible interpretations of this in Section 4.
Some further statistical tests were also performed on the CCSN distributions shown in Figures 1 & 2. Figure 1 shows that even in the undisturbed galaxies, there is some evidence for a larger fraction of SNIbc in the central regions, principally due to a central ‘hole’ in the radial distribution of SNII. A KS test applied to the SNIbc and SNII distributions shown in Figure 1 shows this difference to be only marginal, P=0.082, and hence clearly less marked than for the disturbed galaxies; disturbance does seem to play a part in the central concentration of the SNIbc. This point was further explored by comparing the SNIbc distributions for undisturbed and disturbed galaxies, i.e. Figure 1 vs. Figure 2; this did indicate the SNIbc in disturbed galaxies to be more centrally concentrated, with a KS P value of 0.06, again of marginal significance. The mean SNIbc Fr() value is 0.48 (0.38–0.57) for the SNIbc in the undisturbed galaxies, again to be compared with 0.31 (0.20–0.42) already quoted for the disturbed galaxies. Finally for Figure 2, it might be asked whether there is evidence for a suppression of SNIbc fraction in the outer regions of these galaxies. However, given the current sample size this cannot be determined with any significance. For example we find 6 SNIbc in the outer 50% of the light distributions of the disturbed galaxies, but with only 22 CCSNe in total from these regions, this is not significantly below the expectation value of 8.4, based on the SNIbc/SNII ratio for the full sample.
Figures 3 & 4 show the distributions of supernova locations relative to the H distributions of their host galaxies. Overall these show the same patterns as Figures 1 & 2, but they do enable one specific issue to be addressed: are the SNIbc more centrally concentrated than the H light, which is presumably a good tracer of the youngest stellar population? Figure 4 shows that there is some evidence for this; the central 10% of the H emission in the disturbed galaxies gives rise to 7 of the 22 SNIbc in these galaxies. The mean Fr(H) value for the SNIbc in disturbed galaxies is 0.33 (0.21–0.45), so this population does seem to be more centrally concentrated than the H emission. This is not true for the SNIbc in the undisturbed galaxies, or for the SNII in either of the galaxy subsets; all of these distributions have mean Fr(H) values consistent with 0.5.
4 Discussion
Anderson & James (2009) found a central excess of SNIbc in a SN-host galaxy sample. This work has found that this central excess is exaggerated in galaxies which appear disturbed. A more centrally located distribution of SNIbc has been suggested previously (e.g. Bartunov et al., 1992; Petrosian & Turatto, 1995; van den Bergh, 1997), though previous studies often suffered from low number statistics. Hakobyan et al. (2009) also find SNIbc to be more centrally located than SNII, however in conflict to our results they do not find the central excess of SNIbc clearly seen in our data. An important difference between our work and most other studies in the literature is that our method implicitly normalizes the tests to the measured distributions of different stellar populations; other studies use distances normalized to isophotal radii. Most of these results have been interpreted as an increase in metallicity of the SNIbc progenitors, although Hakobyan et al. (2009) also make the suggestion of a shallower IMF within the central regions.
Studies conducted into active and star-forming galaxies (Petrosian et al., 2005) and Seyfert galaxies (Bressan et al., 2002) have also noted marginal evidence for an increased fraction of both CCSNe and specifically SNIbc within these galaxies when compared to ‘normal’ ones.
There are various observational biases which may affect our analysis. Shaw (1979) found a bias in supernova samples, in the sense that it is more difficult to detect SNe in the inner regions of distant galaxies. The sample is also subject to any bias contained within the object selection found in the Asiago (Barbon et al., 2009) and IAU SN catalogues. For the Asiago and Crimea searches, Cappellaro et al. (1993) estimated the number of SNe lost due to overexposure combined with the Shaw effect, which for the velocity range of our sample is 35%. Another source of bias is the loss of SNe in the central regions of galaxies through the large amount of dust obscuration which has been investigated through near infrared studies (e.g. Mattila et al., 2007; Kankare et al., 2008). Such biases should affect all SN types, although the intrinsically fainter SNIIP (Richardson et al., 2002, 2006) may be rather more likely to be lost through these effects. However, if our results are correct and SNIbc are more centrally concentrated than SNII then recovering all of the lost central SNe would lead to an even more exaggerated excess.
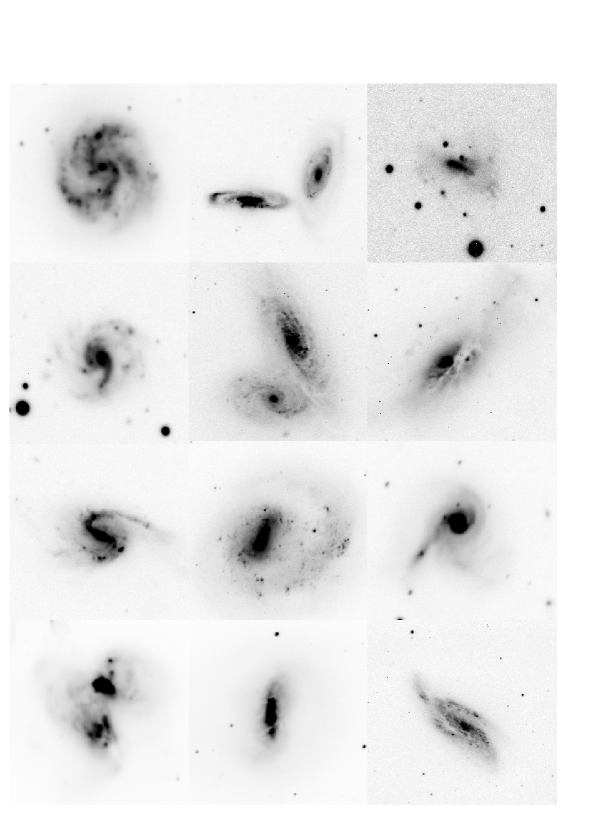
One possible source of error is our eyeball classifications of host galaxy disturbance. In future we plan to quantify this through near-IR observations and use of objective measures of asymmetry (Conselice et al., 2000; Lotz et al., 2004). However, we are quite confident in our disturbance classifications; images of 12 of our ‘disturbed’ galaxies with centrally-located SNe are shown in Figure 5, confirming that this is not a ‘normal’ group of galaxies.
The high central excess of SNIbc in the central regions of the disturbed host galaxies found in this work is difficult to explain in terms of effects other than an IMF biased towards high-mass stars. A possible alternative explanation is the effect of metallicity, given that Boissier & Prantzos (2009) find that the ratio of SNIbc/SNII increases with both local and global metallicity. Looking at the absolute magnitudes of the host galaxies, we do indeed find that the disturbed galaxies are somewhat more luminous than the undisturbed galaxies (KS probability of 0.07 that they are drawn from the same parent distribution), by almost 0.4 mag in the mean, which might imply a somewhat higher mean metallicity in the disturbed galaxies. However, this does not seem to be driving the result we find. Splitting the total sample (disturbed and undisturbed) by absolute magnitude, we find no significant differences in the Fr() distributions of bright and faint galaxies. Splitting into bright and faint halves, the KS probability is 0.998 (complete consistency), whereas when the bright third is compared with the faintest two-thirds (to better match the disturbed/undisturbed split), P is 0.276, but in the sense that the bright galaxies have a slight bias towards high Fr() values. In any case, the expected metallicity bias resulting from a difference of 0.4 in galaxy absolute magnitude is very small. The mass-metallicity relation of Tremonti et al. (2004) for galaxies of a few times 1010 M⊙ predicts a corresponding change of only 0.025 dex in log(O/H), highly unlikely to cause any significant effects. Finally, in interacting systems the central metallicity is lowered by the in-fall of unenriched gas (Michel-Dansac et al., 2008; Ellison et al., 2008; Rupke et al., 2010). This would therefore act in the opposite sense to the result we find. It should also be noted that whilst a study of gas-phase metallicities of the local environments of CCSNe (Anderson et al. MNRAS submitted) finds a trend favouring SNIbc in high-metallicity regions, even the highest metallicity environments seem to host a significant fraction of SNII.
It is also possible that stellar rotation (e.g. Heger et al., 2003) and binarity (e.g. Nomoto et al., 1995) could contribute to this effect. It is not clear why the binary fraction should be higher within the disturbed galaxy sample, but it should be noted that the increased densities within these nuclear starburst regions could lead to more massive and denser clusters, within which processes such as stellar mergers and binary interactions would be more prevalent (e.g. Portegies Zwart et al., 2010).
To conclude, our preferred explanation of this central excess of SNIbc is that the central regions of these disturbed galaxies are hosting starbursts with initial mass functions biased to high stellar masses. Given the small numbers of SNe involved, the uncertain mass limits corresponding to progenitors of different SN types, and the likely role of binarity in determining SN type, it is hard to quantify the implications of this result for the IMF. However, an illustrative calculation can be performed as follows. Under the assumption of a Salpeter IMF, and the (admittedly simplistic) assumptions that CCSNe arise from single stars with masses between 8 and 80 M⊙ and that mass alone determines SN type, the relative numbers of SNII and Ibc in the outer regions of undisturbed galaxies (2.3:1) indicate a transition at about 18 M⊙. The apparent inversion of this ratio for the central regions of the disturbed galaxies (0.18:1), if interpreted purely as a change in IMF slope, appears to require a positive index in the IMF slope (formally +0.95 cf. –1.35, assuming the transition mass is unchanged at 18 M⊙). However, we emphasize that this is purely illustrative; all of the assumptions are likely to be in error at some level, and binarity and metallicity effects may play some part in the changes we find.
We note here that we are modifying the conclusions of Anderson & James (2009) in that it is hard to interpret the previously found central SNIbc excess purely in terms of metallicity effects. However, we note that there is still a marginal central excess of SNIbc in the undisturbed galaxy sample, indicating some effect of metallicity. Quantifying the relative sizes of the different effects will be the focus of future studies.
Finally, it is interesting to note that with current research indicating a connection between gamma ray bursts (GRBs) and type Ic SNe (Woosley & Bloom, 2006), recent studies (e.g. Conselice et al., 2005; Wainwright, 2007; Fryer et al., 2007) have found that GRB host galaxies show an over-abundance of merging or interacting galaxies compared to other star-forming hosts.
5 Conclusions
We have analysed the spatial distribution of 178 CCSNe within a sample of host galaxies with recession velocities less than 6000 km/s. Host galaxies were classified by eye according to whether they show disturbance due to strong tidal interactions or mergers. The main results are as follows:
-
•
CCSNe of all types show a strong degree of central concentration in the disturbed galaxies, probably as a result of nuclear starbursts in these galaxies.
-
•
This central excess is dominated by SNIbc.
-
•
The SNIbc in disturbed galaxies are more centrally concentrated than the H emission.
-
•
The SNIbc excess cannot easily be explained in terms of metallicity effects, extinction, or central incompleteness of SNe.
-
•
Our preferred explanation of the SNIbc excess is that the central regions of the disturbed galaxies are dominated by nuclear starbursts with IMFs biased towards high mass stars, although metallicity, binarity and stellar rotation may also play a role.


Tables and table captions
-
•
Table 2: Disturbed host galaxy sample used in this analysis. Columns represent the host galaxy, the individual SNe, the spectral classification of the SNe and the fractional -band light and fractional H values for each SNe, as in table 1. Host SN SN type Fr() Fr(H) NGC493 1971S IIP 0.605 0.570 NGC918 2009js IIP 0.703 - NGC941 2005ad II 0.831 0.864 NGC991 1984L Ib 0.498 0.401 NGC1035 1990E IIP 0.272 0.363 NGC1058 1961V II 0.968 0.931 NGC1058 1969L IIP 1.000 1.000 NGC1058 2007gr Ib/c 0.421 - NGC1073 1962L Ic 0.754 0.518 NGC1087 1995V II 0.368 0.497 NGC1187 1982R Ib 0.695 0.760 NGC1187 2007Y Ib 0.981 1.000 MCG-01-09-24 2002ei IIP 0.195 0.195 NGC1343 2008dv Ic 0.195 0.134 UGC2906 2008im Ib 0.682 - UGC2971 2003ig Ic 0.176 0.108 IC381 2001ef Ic 0.082 0.052 NGC1832 2004gq Ib 0.672 0.328 NGC1832 2009kr II 0.489 - IC2152 2004ep II 0.461 0.560 UGC3804 2002A IIn 0.419 0.253 NGC2551 2003hr II 0.914 1.000 NGC2596 2003bp Ib 0.486 0.362 UGC4436 2004ak II 0.887 0.882 NGC2726 1995F Ic 0.037 0.050 NGC2742 2003Z IIP 0.675 0.736 NGC2715 1987M Ic 0.129 0.044 UGC4904 2006jc Ib/c 0.332 0.525 NGC2841 1972R Ib 0.855 0.904 NGC2906 2005ip II 0.399 0.528 UGC5249 1989C IIP 0.017 0.058 NGC3074 1965N IIP 0.110 0.059 NGC3074 2002cp Ib/c 0.936 0.961 NGC3147 2006gi Ib 0.984 0.991 NGC3184 1921B II 0.856 0.954 NGC3184 1937F IIP 0.808 0.930 NGC3184 1999gi IIP 0.276 0.112 NGC3198 1966J Ib 0.898 0.963 NGC3198 1999bw IIn 0.745 0.755 NGC3240 2001M Ic 0.323 0.251 NGC3294 1990H IIP 0.156 0.125 NGC3340 2005O Ib 0.322 0.305 Host SN SN type Fr() Fr(H) NGC3340 2007fp II 0.170 0.125 NGC3430 2004ez II 0.788 0.833 NGC3437 2004bm Ic 0.073 0.076 NGC3451 1997dn II 0.872 0.946 NGC3504 2001ac IIn 0.826 0.992 NGC3512 2001fv IIP 0.669 0.689 NGC3556 1969B IIP 0.197 0.494 NGC3631 1964A II 0.915 0.992 NGC3631 1965L IIP 0.622 0.658 NGC3631 1996bu IIn 0.923 0.993 NGC3655 2002ji Ib/c 0.709 0.957 NGC3683 2004C Ic 0.532 0.545 UGC6517 2006lv Ib/c 0.480 - NGC3756 1975T IIP 0.846 0.856 NGC3810 2000ew Ic 0.261 0.147 NGC3810 1997dq Ib/c 0.774 0.734 NGC3949 2000db II 0.364 0.253 NGC3963 1997ei Ic 0.197 0.053 NGC4030 2007aa II 0.942 0.828 NGC4041 1994W IIn 0.491 0.541 NGC4051 1983I Ic 0.498 0.473 NGC4051 2003ie II 0.838 0.885 IC758 1999bg IIP 0.669 0.657 NGC4136 1941C II 0.880 0.882 NGC4210 2002ho Ic 0.146 0.051 NGC4242 2002bu IIn 0.896 0.930 NGC4303 1926A IIL 0.607 0.736 NGC4303 1961I II 0.697 0.877 NGC4303 1964F II 0.189 0.106 NGC4303 1999gn IIP 0.418 0.429 NGC4303 2006ov IIP 0.418 0.429 NGC4303 2008in IIP 0.845 - NGC4369 2005kl Ic 0.271 0.540 NGC4384 2000de Ib 0.087 0.140 NGC4451 1985G IIP 0.138 0.212 NGC4559 1941A IIL 0.208 0.131 UGC7848 2006bv IIn 0.579 - NGC4666 1965H IIP 0.324 0.198 NGC4708 2003ef II 0.335 0.352 NGC4725 1940B IIP 0.675 0.802 NGC4900 1999br IIP 0.786 0.932 NGC4961 2005az Ic 0.426 - NGC4981 2007C Ib 0.320 0.236 NGC5012 1997eg IIn 0.503 0.449 NGC5033 1950C Ib/c 0.972 1.000 NGC5033 1985L IIL 0.585 0.571 NGC5334 2003gm IIn 0.480 - NGC5371 1994Y IIn 0.355 0.212 NGC5468 2002ed IIP 0.811 0.791 Host SN SN type Fr() Fr(H) NGC5559 2001co Ib/c 0.618 0.497 NGC5584 1996aq Ic 0.178 0.086 NGC5630 2005dp II 0.534 0.590 NGC5630 2006am IIn 0.604 0.617 NGC5673 1996cc II 0.924 0.934 NGC5668 2004G II 0.657 0.595 NGC5775 1996ae IIn 0.757 0.671 NGC5806 2004dg IIP 0.484 0.378 NGC5850 1987B IIn 0.995 - NGC5879 1954C II 0.615 0.511 NGC5921 2001X IIP 0.579 0.369 NGC6118 2004dk Ib 0.673 0.626 NGC6207 2004A IIP 0.729 0.660 UGC10862 2004ao Ib - 0.215 NGC6643 2008ij IIP 0.519 0.620 NGC6643 2008bo Ib 0.451 0.510 NGC6700 2002cw Ib - 0.642 NGC6946 2004et II 0.975 - NGC6951 1999el IIn 0.320 0.259 UGC11861 1995ag II 0.343 0.170 UGC11861 1997db II 0.633 0.396 UGC12160 1995X II 0.564 0.484 UGC12182 2006fp IIn 1.000 1.000 -
–
Table 2: Disturbed host galaxy sample used in this analysis. Columns represent the host galaxy, the individual SNe, the spectral classification of the SNe and the fractional -band light and fractional H values for each SNe, as in table 1. Host SN SN type Fr() Fr(H) NGC895 2003id Ic 0.524 - UGC2984 2002jz Ic 0.091 0.099 NGC1614 1996D Ic 0.275 - NGC1637 1999em IIP 0.276 0.268 IC391 2001B Ib 0.062 0.060 NGC1961 2001is Ib - 0.749 NGC2207 1999ec Ib - 0.521 NGC2207 2003H Ib - 0.259 NGC2146 2005V Ib/c 0.033 0.091 ESO492-G2 2005lr Ic - 0.005 UGC3829 2001ej Ib 0.152 0.391 NGC2276 1968V II 0.699 0.790 NGC2276 2005dl II 0.247 0.099 NGC2276 1993X II 0.899 0.619 NGC2532 1999gb IIn 0.485 0.443 NGC2532 2002hn Ic 0.023 0.011 NGC2604 2002ce II 0.381 0.560 NGC2782 1994ak IIn 0.725 0.977 NGC2993 2003ao IIP 0.456 0.784 NGC3169 1984E IIL 0.684 0.731 NGC3310 1991N Ic 0.268 0.277 NGC3323 2004bs Ib 0.191 0.119 NGC3323 2005kk II 0.766 0.875 NGC3367 1992C II 0.689 0.687 NGC3367 2007am II 0.302 0.314 NGC3627 1973R IIP 0.471 0.566 NGC3627 1997bs IIn 0.362 0.348 NGC3627 2009hd II 0.496 - NGC3690 1993G IIL 0.464 0.744 NGC3690 1998T Ib 0.056 0.056 NGC3690 1999D II 0.560 0.849 NGC3786 1999bu Ic 0.180 0.522 NGC3811 1971K IIP 0.809 0.900 IC2973 1991A Ic 0.742 0.588 NGC4038 2004gt Ib/c 0.834 0.991 NGC4088 1991G IIP 0.466 0.453 NGC4088 2009dd II 0.100 - NGC4141 2008X IIP 0.194 0.085 NGC4141 2009E IIP 0.594 0.491 NGC4254 1967H II 0.664 0.648 NGC4254 1972Q IIP 0.811 0.791 NGC4254 1986I IIP 0.334 0.318 NGC4273 2008N IIP 0.300 0.316 NGC4273 1936A IIP 0.569 0.598 NGC4490 1982F IIP 0.277 0.202 Host SN SN type Fr() Fr(H) NGC4568 1990B Ic 0.302 - NGC4568 2004cc Ic 0.158 - NGC4618 1985F Ib 0.121 0.087 NGC4615 1987F IIn 0.489 0.333 NGC4688 1966B IIL 0.571 0.454 NGC4691 1997X Ic 0.171 0.472 NGC5000 2003el Ic 0.482 0.476 NGC5021 1996ak II 0.619 0.659 MCG-04-32-07 2003am II 0.211 0.339 NGC5194 1994I Ic - 0.122 NGC5194 2005cs IIP - 0.222 NGC5395 2000cr Ic 0.538 0.549 NGC5480 1988L Ib 0.230 0.369 NGC5682 2005ci II 0.204 0.191 NGC7479 1990U Ic 0.603 0.488 NGC7479 2009jf Ib 0.764 - NGC7537 2002gd II 0.759 0.685 NGC7714 2007fo Ib 0.377 - UGC12846 2007od IIP 0.945 1.000 References
- Anderson & James (2008) Anderson, J. P. & James, P. A. 2008, MNRAS, 390, 1527
- Anderson & James (2009) —. 2009, MNRAS, 399, 559
- Barbon et al. (2009) Barbon, R., Buondi, V., Cappellaro, E., & Turatto, M. 2009, VizieR Online Data Catalog, 1, 2024
- Barnes & Hernquist (1991) Barnes, J. E. & Hernquist, L. E. 1991, ApJ, 370, L65
- Barton et al. (2000) Barton, E. J., Geller, M. J., & Kenyon, S. J. 2000, ApJ, 530, 660
- Bartunov et al. (1992) Bartunov, O. S., Makarova, I. N., & Tsvetkov, D. I. 1992, A&A, 264, 428
- Bastian et al. (2010) Bastian, N., Covey, K. R., & Meyer, M. R. 2010, ArXiv e-prints
- Baugh et al. (2005) Baugh, C. M., Lacey, C. G., Frenk, C. S., Granato, G. L., Silva, L., Bressan, A., Benson, A. J., & Cole, S. 2005, MNRAS, 356, 1191
- Boissier & Prantzos (2009) Boissier, S. & Prantzos, N. 2009, A&A, 503, 137
- Borne et al. (1999) Borne, K. D., Bushouse, H., Colina, L., Lucas, R. A., Baker, A., Clements, D., Lawrence, A., Oliver, S., & Rowan-Robinson, M. 1999, Ap&SS, 266, 137
- Brassington et al. (2007) Brassington, N. J., Ponman, T. J., & Read, A. M. 2007, MNRAS, 377, 1439
- Bressan et al. (2002) Bressan, A., Della Valle, M., & Marziani, P. 2002, MNRAS, 331, L25
- Cappellaro et al. (1993) Cappellaro, E., Turatto, M., Benetti, S., Tsvetkov, D. Y., Bartunov, O. S., & Makarova, I. N. 1993, A&A, 273, 383
- Conselice et al. (2000) Conselice, C. J., Bershady, M. A., & Jangren, A. 2000, ApJ, 529, 886
- Conselice et al. (2005) Conselice, C. J., Vreeswijk, P. M., Fruchter, A. S., Levan, A., Kouveliotou, C., Fynbo, J. P. U., Gorosabel, J., Tanvir, N. R., & Thorsett, S. E. 2005, ApJ, 633, 29
- Doyon et al. (1994) Doyon, R., Joseph, R. D., & Wright, G. S. 1994, ApJ, 421, 101
- Doyon et al. (1992) Doyon, R., Puxley, P. J., & Joseph, R. D. 1992, ApJ, 397, 117
- Eldridge & Tout (2004) Eldridge, J. J. & Tout, C. A. 2004, MNRAS, 353, 87
- Ellison et al. (2008) Ellison, S. L., Patton, D. R., Simard, L., & McConnachie, A. W. 2008, AJ, 135, 1877
- Espinoza et al. (2009) Espinoza, P., Selman, F. J., & Melnick, J. 2009, A&A, 501, 563
- Figer et al. (1999) Figer, D. F., Kim, S. S., Morris, M., Serabyn, E., Rich, R. M., & McLean, I. S. 1999, ApJ, 525, 750
- Fryer et al. (2007) Fryer, C. L., Mazzali, P. A., Prochaska, J., Cappellaro, E., Panaitescu, A., Berger, E., van Putten, M., van den Heuvel, E. P. J., Young, P., Hungerford, A., Rockefeller, G., Yoon, S., Podsiadlowski, P., Nomoto, K., Chevalier, R., Schmidt, B., & Kulkarni, S. 2007, PASP, 119, 1211
- Gibson & Matteucci (1997) Gibson, B. K. & Matteucci, F. 1997, MNRAS, 291, L8
- Hakobyan et al. (2009) Hakobyan, A. A., Mamon, G. A., Petrosian, A. R., Kunth, D., & Turatto, M. 2009, A&A, 508, 1259
- Heger et al. (2003) Heger, A., Fryer, C. L., Woosley, S. E., Langer, N., & Hartmann, D. H. 2003, ApJ, 591, 288
- Joseph et al. (1984) Joseph, R. D., Meikle, W. P. S., Robertson, N. A., & Wright, G. S. 1984, MNRAS, 209, 111
- Joseph & Wright (1985) Joseph, R. D. & Wright, G. S. 1985, MNRAS, 214, 87
- Kankare et al. (2008) Kankare, E., Mattila, S., Ryder, S., Pérez-Torres, M., Alberdi, A., Romero-Canizales, C., Díaz-Santos, T., Väisänen, P., Efstathiou, A., Alonso-Herrero, A., Colina, L., & Kotilainen, J. 2008, ApJ, 689, L97
- Kennicutt & Keel (1984) Kennicutt, Jr., R. C. & Keel, W. C. 1984, ApJ, 279, L5
- Krumholz et al. (2010) Krumholz, M. R., Cunningham, A. J., Klein, R. I., & McKee, C. F. 2010, ApJ, 713, 1120
- Larson & Tinsley (1978) Larson, R. B. & Tinsley, B. M. 1978, ApJ, 219, 46
- Lotz et al. (2004) Lotz, J. M., Primack, J., & Madau, P. 2004, AJ, 128, 163
- Mattila et al. (2007) Mattila, S., Väisänen, P., Farrah, D., Efstathiou, A., Meikle, W. P. S., Dahlen, T., Fransson, C., Lira, P., Lundqvist, P., Östlin, G., Ryder, S., & Sollerman, J. 2007, ApJ, 659, L9
- Michel-Dansac et al. (2008) Michel-Dansac, L., Lambas, D. G., Alonso, M. S., & Tissera, P. 2008, MNRAS, 386, L82
- Mihos & Hernquist (1994) Mihos, J. C. & Hernquist, L. 1994, ApJ, 425, L13
- Mihos & Hernquist (1996) —. 1996, ApJ, 464, 641
- Nomoto et al. (1995) Nomoto, K. I., Iwamoto, K., & Suzuki, T. 1995, Phys. Rep., 256, 173
- Paumard et al. (2006) Paumard, T., Genzel, R., Martins, F., Nayakshin, S., Beloborodov, A. M., Levin, Y., Trippe, S., Eisenhauer, F., Ott, T., Gillessen, S., Abuter, R., Cuadra, J., Alexander, T., & Sternberg, A. 2006, ApJ, 643, 1011
- Petrosian et al. (2005) Petrosian, A., Navasardyan, H., Cappellaro, E., McLean, B., Allen, R., Panagia, N., Leitherer, C., MacKenty, J., & Turatto, M. 2005, AJ, 129, 1369
- Petrosian & Turatto (1995) Petrosian, A. R. & Turatto, M. 1995, A&A, 297, 49
- Portegies Zwart et al. (2010) Portegies Zwart, S., McMillan, S., Gieles, M. 2010, ArXiv e-prints
- Richardson et al. (2006) Richardson, D., Branch, D., & Baron, E. 2006, AJ, 131, 2233
- Richardson et al. (2002) Richardson, D., Branch, D., Casebeer, D., Millard, J., Thomas, R. C., & Baron, E. 2002, AJ, 123, 745
- Rieke et al. (1980) Rieke, G. H., Lebofsky, M. J., Thompson, R. I., Low, F. J., & Tokunaga, A. T. 1980, ApJ, 238, 24
- Rieke et al. (1993) Rieke, G. H., Loken, K., Rieke, M. J., & Tamblyn, P. 1993, ApJ, 412, 99
- Rupke et al. (2010) Rupke, D. S. N., Kewley, L. J., & Barnes, J. E. 2010, ApJ, 710, L156
- Salpeter (1955) Salpeter, E. E. 1955, ApJ, 121, 161
- Sanders et al. (1988) Sanders, D. B., Soifer, B. T., Elias, J. H., Madore, B. F., Matthews, K., Neugebauer, G., & Scoville, N. Z. 1988, ApJ, 325, 74
- Shaw (1979) Shaw, R. L. 1979, A&A, 76, 188
- Smartt (2009) Smartt, S. J. 2009, ARA&A, 47, 63
- Stolte et al. (2002) Stolte, A., Grebel, E. K., Brandner, W., & Figer, D. F. 2002, A&A, 394, 459
- Tremonti et al. (2004) Tremonti, C. A., Heckman, T. M., Kauffmann, G., Brinchmann, J., Charlot, S., White, S. D. M., Seibert, M., Peng, E. W., Schlegel, D. J., Uomoto, A., Fukugita, M., & Brinkmann, J. 2004, ApJ, 613, 898
- van den Bergh (1997) van den Bergh, S. 1997, AJ, 113, 197
- Wainwright (2007) Wainwright, C., Berger, E., & Penprase, B. E. 2007, ApJ, 657, 367
- Woosley & Bloom (2006) Woosley, S. E. & Bloom, J. S. 2006, ARA&A, 44, 507
-
–