The X-ray to [Ne V]3426 flux ratio:
discovering heavily
obscured AGN in the distant Universe.
We investigate the possibility of using the ratio between the 2-10 keV flux and the [Ne V]3426 emission line flux (X/NeV) as a diagnostic diagram to discover heavily obscured, possibly Compton-Thick Active Galactic Nuclei (AGN) in the distant Universe. While being on average about one order of magnitude fainter than the more commonly used [O III]5007 emission line, the [Ne V]3426 line can be observed with optical spectroscopy up to , whereas the [O III]5007 line is redshifted out of the optical bands already at . First, we calibrate a relation between X/NeV and the cold absorbing column density using a sample of 74 bright, nearby Seyferts with both X-ray and [Ne V] data available in the literature, and for which the column density is determined unambiguously. Similarly to what is found for the X-ray to [O III]5007 flux ratio (X/OIII), we found that the X/NeV ratio decreases towards large column densities, as expected if [Ne V]3426 emission is a good tracer of the AGN intrinsic power. Essentially all local Seyferts with X/NeV values below 15 are found to be Compton-Thick objects. At X/NeV values below 100, the percentage of Compton-Thick nuclei decreases to , but still of the considered sample is absorbed with cm-2. Second, we apply this diagnostic diagram to different samples of distant obscured and unobscured QSOs in the Sloan Digital Sky Survey (SDSS). SDSS blue, unobscured, type-1 QSOs in the redshift range indeed show X/NeV values typical of unobscured Seyfert 1s in the local Universe. Conversely, SDSS type-2 QSOs at classified either as Compton-Thick or Compton-Thin on the basis of their X/OIII ratio, would have been mostly classified in the same way based on the X/NeV ratio. We apply the X/NeV diagnostic diagram to 9 SDSS obscured QSOs in the redshift range , selected by means of their prominent [Ne V]3426 line (rest Å) and observed with Chandra ACIS-S for 10ks each (8 of them as part of our proprietary program). Based on the X/NeV ratio, complemented by X-ray spectral analysis, 2 objects appear good Compton-Thick QSO candidates, 4 objects appear as Compton-Thin QSOs, while 3 have an ambiguous classification. When excluding from the sample broad lined QSOs with a red continuum and thus considering only genuine narrow-line objects, the efficiency in selecting Compton-Thick QSOs through the [Ne V] line is about 50% (with large errors, though), more similar to what is achieved with [O III] selection. We discuss the possibility of applying the X/NeV diagnostic to deep X-ray surveys to search for Compton-Thick Seyferts at , i.e. those objects which are thought to be responsible for the “missing” X-ray background.
Finally, we compare the optical spectral properties of [Ne V]-selected QSOs with those of other SDSS populations of obscured and unobscured QSOs. By restricting the analysis to objects in the same redshift (and luminosity) range z=[0.4-1.5], we found evidence that, at any given [Ne V] luminosity, increasing obscuration is accompanied by increasing [O II]3727 emission. This correlation is interpreted as evidence for enhanced star formation in obscured QSOs, which is consistent with current popular scenarios of BH-galaxy coevolution.
Key Words.:
Galaxies: active – X-rays: generalemail:roberto.gilli@oabo.inaf.it
1 Introduction
While the cosmological evolution of unobscured QSOs has been traced up to , the evolution of obscured AGN is much more uncertain and is the subject of intense debate. The observed number statistics in current AGN samples is dominated by unobscured objects which are easier to discover (e.g. QSOs have been identified in the Sloan Digital Sky Survey), but several arguments suggest that obscured AGN must be intrinsically more numerous. Deep X-ray surveys (see Brandt & Hasinger 2005 for a review) have indeed shown that, towards faint X-ray fluxes, the surface density of obscured AGN overtakes that of unobscured AGN. Also, population synthesis models of the cosmic X-ray background (XRB), suggest that obscured AGN outnumber unobscured ones by a factor which ranges from to , depending on the considered luminosity regime (Gilli et al. 2007; see Treister et al. 2009b and Ballantyne et al. 2006 for a steeper luminosity dependence). To understand the cosmological history of accretion onto supermassive black holes (SMBHs) it is therefore necessary to map and understand the population of obscured AGN and, in particular, of the most obscured and hence elusive ones, the so-called Compton-Thick (CT) nuclei, i.e. those obscured by column densities above cm-2. The population of moderately obscured AGN in fact does not completely account for the XRB peak intensity at 30 keV, to which CT AGN are expected to contribute from (Treister et al. 2009b) to (Gilli et al. 2007), depending on the XRB model assumptions. In addition, the presence of a large population of CT AGN across the cosmic epochs, would help in reconciling the measured mass function of local SMBHs with that expected by integrating the accretion history of seed black holes (Marconi et al. 2004; Shankar et al. 2004). Finally, popular semi-analytic models of galaxy formation and evolution (Kauffmann & Haehnelt 2000; Marulli et al. 2008), coupled to hydrodynamical simulations of galaxy mergers (Hopkins et al. 2006), propose that nuclear activity is triggered during major mergers of gas-rich galaxies and that at its early stage, the AGN is embedded within optically thick gas shrouds. Despite these theoretical progresses, the cosmological evolution and luminosity function of CT objects is currently unknown, and in the synthesis models of the XRB it has been usually assumed to be equal to that of less obscured objects. Whether this is the case or not can only be determined by obtaining statistically significant samples of distant CT objects and by comparing them with the local samples (see e.g. Comastri 2004 and Della Ceca et al. 2008 for reviews on nearby, bona-fide CT objects).
The number of techniques devised to select CT AGN is rapidly growing, following the technological development of efficient detectors across the electromagnetic spectrum. These diverse selection techniques have allowed the first estimates of the space density of CT AGN in different redshift and luminosity regimes.
Very hard X-ray selection, i.e. at energies above 10 keV, is unaffected by absorption up to a few cm-2, but, because of the still limited instrumental sensitivity, is mainly sampling the nearby Universe. The population of CT AGN detected by INTEGRAL/IBIS (Tueller et al. 2008) and Swift/BAT (Malizia et al. 2009) at is indeed producing only a tiny fraction (1%) of the cosmic XRB.
Deep X-ray surveys in the more accessible 2-10 keV band are revealing large populations of heavily obscured objects in the redshift range . The generally low photon statistics of the detected sources, however, prevent an accurate spectral analysis and measurement. The CT nature of a faint X-ray source is therefore often inferred from the characteristics of the reprocessed spectrum, like the presence of a prominent fluorescence iron line over a flat continuum. Examples of distant CT AGN selected with this technique have been found by Tozzi et al. (2006) and Georgantopoulos et al. (2007, 2009) in the Chandra Deep Fields. The number of CT AGN candidates detected in the deep X-ray surveys appears to be in rather good agreement with the XRB models predictions.
A very recent and promising approach to select CT candidates in the distant Universe is based on their strong mid-IR flux, where most of the absorbed radiation should be re-emitted (Martínez-Sansigre et al. 2005). Recently, Daddi et al. (2007), Fiore et al. (2008, 2009) and Alexander et al. (2008) located heavily obscured AGN in objects showing 24m emission in excess of that expected from dust heated by stellar processes. By stacking the Chandra data of these mid-IR-excess objects, a very hard X-ray spectrum was observed, reminiscent of CT obscuration. These studies span a broad AGN luminosity range ( erg s-1), but mostly sample populations of objects at . The measured space density of CT AGN at these high redshifts is in general as large as expected from XRB synthesis models or possibly even larger (see eg. Treister et al. 2009a).
Another way to select obscured QSOs is through their high-ionization narrow optical emission lines, which are thought to be produced on physical scales (from to a few kpc) mostly free from nuclear obscuration. Recently, the [O IV]26 line has been used to select obscured AGN among galaxies observed with Spitzer/IRS. However, since this line quickly moves out of the observable IR bands as redshift increases, this selection mostly concerns the nearby Universe (Diamond-Stanic et al. 2009; Rigby et al. 2009). The most commonly used marker of obscured nuclear activity therefore remains the [O III]5007 emission line, which is strong, falls in the optical domain, and allows object selection up to .
The 2-10 keV to [O III]5007 flux ratio (X/OIII) has been often used as a diagnostic for heavy obscuration in sources with poor X-ray photon statistics (Maiolino et al. 1998; Cappi et al. 2006; Panessa et al. 2006), being low X/OIII ratios (, see e.g. Fig. 4 of Cappi et al. 2006) highly suggestive of heavy nuclear absorption. Based on the [O III]5007 emission line, Zakamska et al. (2003) and Reyes et al. (2008) identified in the Sloan Digital Sky Survey (SDSS) a population of obscured QSOs at a median redshift of , at least as abundant as that of type-1 QSOs at the same redshifts (Reyes et al. 2008). These results have been extended to lower luminosities by Bongiorno et al. (2009), who measured the luminosity function of [O III]-selected type-2 AGN in the zCOSMOS spectroscopic survey (Lilly et al. 2007), finding that the fraction of obscured AGN is decreasing with luminosity, in agreement with what is observed in X-ray surveys.
X-ray observations of small samples drawn from the Zakamska et al. (2003) catalog, suggest that about half of luminous type-2 QSOs (log) could be CT (Ptak et al. 2006; Vignali et al. 2006, 2010, hereafter V10; see also Lamastra et al. 2009 for X-ray observations of lower luminosity SDSS type-2 AGN). Since [O III] selection is likely missing objects in which also the Narrow Line Region (NLR) is extincted (like e.g. in the prototype CT AGN NGC 4945 and NGC 6240), the estimated type-2 QSO abundances should be considered as lower limits (Reyes et al. 2008, V10).
In this work we explore the possibility of using the high-ionization [Ne V]3426 emission line, rather than the [O III]5007 line, as a tracer of obscured nuclear activity. Despite being on average a factor of weaker than [O III]5007 (Ferland & Osterbrock 1986; Zakamska et al. 2003) and suffering stronger dust extinction, the [Ne V]3426 line is commonly observed in nearby Seyfert galaxies and, given that high energy photons ( keV) are required to further ionize NeIV, it is considered an unambiguous sign of nuclear activity (e.g. Schmidt et al. 1998). In addition, the [Ne V]3426 emission line is observable up to before being redshifted out of the optical bands, whereas the [O III]5007 line is observable only up to . Indeed, only 13 out of 887 [O III]-selected QSOs in the Reyes et al. (2008) sample lie at , with only 3 at . [Ne V]-selection may then be used to reveal nuclear activity in obscured sources at , i.e. at the epoch where most of the XRB light is thought to be produced.
The structure of the paper is the following: in Section 2 we present and discuss the sample of nearby Seyfert galaxies used to calibrate the relation between [Ne V] and X-ray emission (the details of the sample are given in the Appendix). In Section 3 we present the X/NeV diagnostic diagram and apply it to obscured and unobscured QSO population drawn from the SDSS. In Section 4 we present Chandra observations of a sample of 9 [Ne V]-selected obscured QSOs at in the SDSS and use the X/NeV diagnostic to estimate the fraction of CT objects among them. In Section 5 we discuss efficiency and biases of [Ne V] selection together with its application to sky areas with deep optical spectroscopy and X-ray coverage. In the same Section, the evidence of enhanced star formation in obscured QSOs at z=0.4-1.5 is also highlighted. The conclusions are drawn in Section 6.
2 The local Seyfert sample
We searched in the literature for nearby () AGN for which both [Ne V] and X-ray data are available. A total sample of 74 objects were found with measured [Ne V] flux, 2-10 keV flux and X-ray column density . The most difficult information to obtain was that on [Ne V] flux, since optical spectra are often limited at wavelengths . On the contrary, the and the 2-10 keV flux values for bright nearby objects are more easily obtained either from published papers or from archival X-ray data. The main catalogs of optical/near-UV Seyfert spectra providing the [Ne V] fluxes used in this work are those published by Malkan (1986), Morris & Ward (1988), Storchi-Bergmann et al. (1995), Erkens et al. (1997), as well as the compilation by Schmitt (1998). A public catalog of HST/STIS spectra of nearby AGN has been released by Spinelli et al. (2006). We note that the HST/STIS spectra have been extracted in apertures of , thus sampling physical scales of a few tens of parsecs at the typical source redshift. This physical scale is often too small to fully encompass the NLR, which indeed may extend up to a few kpc. We verified that the [O III] and [Ne V] fluxes as measured on the Spinelli et al. (2006) spectra are often significantly lower (an order of magnitude or more) than those measured on larger apertures, especially in those objects in which an extended NLR has been revealed (Bianchi et al. 2006). Therefore, we avoided using measurements obtained with HST/STIS and considered only those taken with larger apertures. All the [Ne V] fluxes used in this work come from apertures . Whenever more than one measurement is available for the [Ne V] flux, we preferred the one obtained with the largest aperture. For 6 objects we measured the [Ne V] line flux directly on the calibrated spectrum drawn from the catalog of 99 UV-optical spectra of nearby galaxies released by Storchi-Bergmann et al.111http://www.if.ufrgs.br/thaisa/.
Since our main aim is to calibrate a diagnostic which can be applied to distant objects, we did not attempt to correct the [Ne V] fluxes for the reddening which may be intrinsic to the NLR. Indeed, while for local objects the extinction to the NLR can be easily measured through e.g. the ratio between the narrow components of and , in distant AGN either or both and are not observable and measuring the ratio between the Balmer lines of higher order (e.g. , ) is often unfeasible due to their weakness over noisy spectra.
As for X-ray data, we generally preferred to use the values obtained with the most recent and sensitive satellites Chandra and XMM-Newton. When dealing with heavily obscured objects, though, we considered data obtained with Suzaku and BeppoSAX in order to map the energy range above 10 keV and get either a measurement or a tighter lower limit on the absorbing column (see Fig. 1). Sometimes an observed 2-10 keV flux measurement is not directly quoted in the considered literature papers: in those cases we estimated it using the published best-fit spectral parameters and/or 2-10 keV luminosity. For a few objects we analyzed archival X-ray data which were still unpublished. The full sample, along with [Ne V] fluxes, 2-10 keV fluxes, values and relative references is presented in the Appendix.
2.1 Sample biases
Although an effort has been done to find as many sources as possible, with both [Ne V] and X-ray information, the sample we built is by no means complete and cannot be considered suitable for statistical studies. Objects in the sample have been targeted for observations for several different reasons. Moreover, since we require [Ne V] detection, the sample might be biased towards objects with stronger [Ne V] emission. Indeed, the absence of a [Ne V] measurement may well be due to the lack of spectral coverage at 3426Å, but also to excessively faint [Ne V] emission. Given that sometimes the information on the spectral coverage is missing and that not all optical spectra on which line measurements are derived have been published, it is often difficult to judge what is the reason for the lack of [Ne V] data. On the contrary, whenever a source is observed in the X-rays, the fine sensivity of current X-observatories and the brightness of the considered nearby objects generally allow a measurement of both 2-10 keV flux and column density. Therefore, the sample should not be biased towards X-ray bright objects. 222We note that we found only very few local objects with [Ne V] emission and observed in the X-rays which show poor X-ray photon statistics, despite having similar X-ray fluxes to those analyzed in the previous Section. These objects were observed with very short exposures (e.g. by the XMM-Slew survey) and have not been considered here since it is not possible to have reliable information on their column density and hence place them in Fig. 1. Also, those objects in which the NLR is relatively free from obscuration should preferentially appear in the sample. Indeed, even a modest reddening of E(B-V)=0.5 corresponds to a flux dumping by a factor of at 3426 assuming standard extinction curves. Compton-Thick objects like NGC 4945 and NGC 6240, in which the NLR is affected by strong extinction, do not indeed appear in the sample. Because of the issues discussed above, the present sample is the one to be used when building a diagnostic diagram to be applied to samples of distant sources selected on the basis of their [Ne V] emission, which indeed would suffer from similar biases.
3 The X/NeV diagnostic
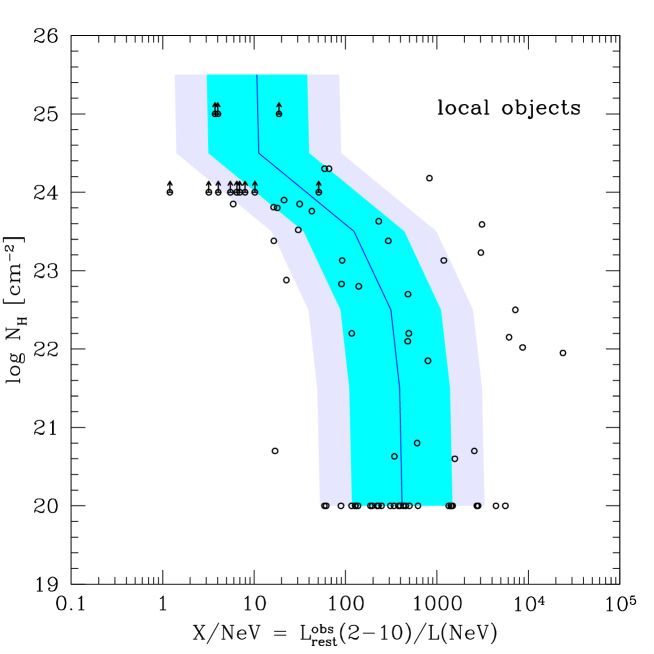
We computed the ratio between the flux observed in the 2-10 keV band and that in the [Ne V]3426 emission line (X/NeV) for the local Seyfert sample described in the previous Section and plotted the X/NeV value against the measured X-ray absorption (Fig.1). This is essentially the same diagram worked out by Maiolino et al. (1998, see also and ) obtained by replacing the [O III] with the [Ne V] line. Working with local objects allows to deal with good optical and X-ray spectra and in turn provides a precise measurement of the X-ray absorption. Assuming that the [Ne V]3426 flux is mostly produced in the NLR, far from nuclear obscuration which affects the X-ray emission, one would expect that the X/NeV ratio on average decreases with increasing column density. This is indeed what is observed (see Fig.1): the median X/NeV values for unabsorbed and for CT Seyferts are about 400 and 7, respectively. For X/NeV almost all objects are CT. For X/NeV about 50% of the objects are CT, while 80% are still obscured by columns larger than cm-2. The CT outlier with X/NeV800, NGC 3281, likely suffers from extinction in the NLR. NGC 6240 and NGC 4945 do not even appear in the diagram. Therefore, low X/NeV ratios would select clean samples of CT AGN, i.e. not significantly contaminated by low-obscuration sources, but not complete.
We note that, for unabsorbed Seyferts, the mean and median X/NeV values are almost identical and very similar to what is obtained by scaling down the average X/OIII value obtained by Panessa et al. (2006) for Seyfert 1s by a factor of 9, i.e. the average OIII/NeV emission line ratio measured for local Seyferts (e.g. Shuder & Osterbrock 1981). The solid line in Fig. 1 has been obtained starting from the mean X/NeV ratio observed in unobscured Seyfert 1s (i.e. those with log fixed to 20 in Fig. 1) and progressively absorbing the 2-10 keV flux of unobscured AGN using the spectral templates of Gilli et al. (2007). In particular, the 2-10 keV emission in CT AGN with log, mostly dominated by the Compton-reflected continuum, has been assumed to be about of the intrinsic one in the same band. The darker (lighter) shaded region has been obtained using the 1 (90%) limits of the X/NeV distribution of unabsorbed Seyferts. Most objects lie within the shaded regions, in agreement with the expectations that nuclear absorption affects the X-ray emission only. However a few notable exceptions are present. For instance, the object with the highest X/NeV ratio in Fig. 1 is NGC 2992, a Seyfert 1.9 galaxy in which the X-ray flux has been observed to vary by a factor of 20 over the years, likely as a consequence of switching on and off of its nuclear activity (Gilli et al. 2000) and/or flares in the inner accretion disk (Murphy et al. 2007). Using the average X-ray flux, rather than the high-state X-ray flux as done in Fig. 1, would shift NGC 2992 in the shaded area where most of the sources lie. This highlights the problem of dealing with variable sources and non-simultaneous optical and X-ray observations, which increases the dispersion of the X/NeV distribution. Absorption variations are also important. Indeed, the lightly obscured object (log) with the lowest X/NeV ratio (X/NeV) is the dwarf AGN POX 52 (Barth et al. 2004), which shows rapid X-ray flux and absorption variability (Thornton et al. 2008). Based on the observed variability, the position of POX 52 on the diagram can shift from the plotted position to X/NeV and log, in the region populated by obscured objects. Finally, it is worth noting that in radio-loud objects an additional X-ray component coming from the jet emission, produces a shift towards higher X/NeV ratios than radio-quiet objects: indeed of the radio galaxies in our samples show X/NeV ratios larger than 400, including some of the objects falling on the right of the shaded region in Fig. 1, while the same fraction is for the radio-quiet galaxies.
3.1 SDSS type-1 QSOs
We applied the X/NeV diagnostic ratio derived in the local Universe to distant obscured and unobscured QSOs in the SDSS. It is important to note that what is needed here is the 2-10 keV rest frame flux (or luminosity) prior to absorption correction, to make a meaningful comparison with the local sample. We first considered the catalog of Young et al. (2009, hereafter Y09), who collected a sample of 792 QSOs in the SDSS DR5 selected primarily by their blue optical colors and serendipitously observed by XMM-Newton333We considered the catalog tables as updated in Young et al. 2009, ApJS, 185, 250. By matching the Y09 sample with the SDSS spectroscopic tables we found 94 objects in the redshift range for which i) the [Ne V]3426 emission line is detected at and ii) have been detected in the X-rays at , which is the threshold adopted by Y09 to perform X-ray spectral fits and measure both the observed 2-10 keV rest frame flux and the column density . To check for possible problems in the determination of the [Ne V]3426 flux related to the SDSS automatic procedures, we visually inspected the 94 SDSS spectra above and found 11 objects in which the listed detection of [Ne V] emission is seriously affected by instrumental features and sky residuals. These objects were then removed from the sample. We also noticed that the line parameters listed in the SDSS spectroscopic tables are not accurate for weak emission lines over a steep continuum. For instance, in about one quarter of SDSS QSOs, the [O II]3727 emission line (see the Discussion) appears as an absorption line due to an overestimate of the continuum. We then retrieved the SDSS spectra and performed a Gaussian fit to the emission lines we were interested in, deriving fluxes, luminosities, and rest frame equivalent widths. All the emission line parameters used in this work for SDSS objects are derived from our direct fits. Whenever we compared our line measurements with those performed by other Authors on the same SDSS spectra (e.g. for a subsample of type-2 QSOs in Zakamska et al. 2003), we found an excellent agreement.
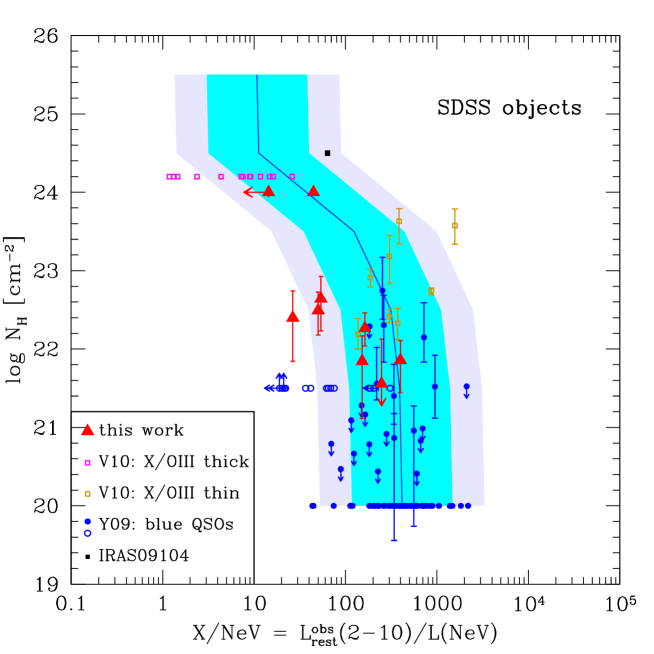
The X/NeV vs relation for the 83 SDSS QSOs selected above is shown in Fig. 2. Most objects are unobscured and populate the same region of local Seyfert 1 galaxies. The median X/NeV ratio for SDSS QSOs is 370, almost identical to the value of 400 found for local Seyfert 1s. The few objects showing significant intrinsic X-ray absorption appear in the optical as intermediate type Seyferts (i.e. 1.8-1.9) rather than pure type-1 AGN.444One of them is indeed also included in the type-2 QSOs catalog by Zakamska et al. (2003) and in the Vignali et al. (2006, 2010) samples.
To check for possible outliers, e.g. blue SDSS QSOs with very low X/NeV ratios (, as observed for local CT Seyferts), we also considered those objects in the Y09 catalog showing significant [Ne V] emission and which were either just detected (13 objects) or completely undetected (3 objects) in the X-rays. We verified that only two objects - appearing in the optical as classical, blue, broad line objects - based on the [Ne V] flux we measure and on the 2-10 keV rest frame flux in the Y09 catalog, would nominally show X/NeV. We double checked the X-ray fluxes of these sources based on literature data (i.e. a Chandra 50ks exposure available for one of them, providing a good quality spectrum with 200 photons, and the 2XMM catalog results for the other source) and found that, while the soft X-ray fluxes are in agreement with the Y09 values, the 2-10 keV fluxes appear significantly (i.e. a factor of 5-10) higher than those in Y09. Both objects are hard sources and, in particular, the one falling in the Chandra ACIS-I field appears to be absorbed by cm-2. We speculate that the likely reason for the mismatch in the 2-10 keV fluxes is that in Y09 the X-ray fluxes of objects with only a few photons are obtained by using a photon index fixed to 1.9, which, for hard sources may severely underestimate the X-ray flux above 2 keV. Using the correct 2-10 keV fluxes, the two objects have X/NeV values between 40 and 60. The X/NeV ratios of the 13 low-significance XMM-Newton detections and X/NeV upper limits to the 3 XMM-Newton non-detections are shown in Fig. 2 as open circles placed at log=21.5, since for the majority of these objects there is evidence of absorption in their optical SDSS spectra. Their X/NeV values are distributed from to , i.e. they are shifted towards smaller values than those of local Seyfert 1s and of high-significance XMM-Newton detections in Y09. In principle, if broad line QSOs reach X/NeV ratios as low as , then one might suspect that more obscured sources, e.g. those absorbed by columns around cm-2 could easily contaminate the CT regime (X/NeV) defined in the previous Section. We note however that, as discussed above, the X/NeV value could have been underestimated for many of the low-significance XMM-Newton detections in Y09. Furthermore, the two XMM-Newton non-detections with X/NeV appear in the optical as pure narrow-line Seyferts and are in fact also listed in the Reyes et al. (2008) type-2 QSO catalog. Likely, both objects are significantly absorbed, in principle even CT, and we show them as lower limits on in Fig. 2. Based on these checks we conclude that the CT region defined in the previous Section is not contaminated by SDSS blue, unabsorbed QSOs although some mild contamination by moderately absorbed sources might still be possible.
3.2 SDSS type-2 QSOs at
We then considered the objects presented by V10 (see also Vignali et al. 2006), who have combined proprietary and archival X-ray observations of a sample of 25 objects out of 291 [O III]5007-selected type-2 QSOs (Zakamska et al. 2003). The objects in the V10 sample populate the redshift interval and have [O III] luminosities in excess of . Based on the observed X/OIII ratio, V10 divided their sample into 8 Compton-Thin QSOs and 17 CT QSOs candidates. We considered here the 21 objects in which the [Ne V] line is detected at level. Visual inspection of these 21 objects does not show any fake [Ne V] emission. We placed the V10 objects in the X/NeV vs diagnostic diagram (see Fig. 2): an almost perfect correspondence is found between the X/OIII and X/NeV classifications: all the 8 objects classified as Compton-Thin by V10 are also classified as Compton-Thin based on their X/NeV ratio. Conversely, 11 out of 13 objects which appear as CT candidates in V10, are also classified as CT using the X/NeV threshold. This may not be surprising given that both [O III] and [Ne V] lines should trace the intrinsic AGN power. However, this is a proof that the X/NeV ratio can be used as a diagnostic for revealing heavy obscuration. In Fig. 2 we also show the position of the well known distant () CT QSO IRAS09104+4109 (Franceschini et al. 2000; Iwasawa et al. 2001a; Piconcelli et al. 2007b), whose SDSS optical spectrum reveals a clear [Ne V]3426 emission line. IRAS09104 falls in a region of the X/NeV diagram which, based on the local Seyfert sample presented in Section 3, is equally populated by CT and Compton-Thin objects.555The CT nature of IRAS09104 has been questioned by Piconcelli et al. (2007b), who nonetheless measured heavy absorption (logcm-2) in this source.
It is worth noting that the source distribution of SDSS objects in Fig. 2 appears to be less dispersed that that of local Seyferts in Fig. 1. This may be related to the fact that i) SDSS objects are intrinsically more luminous, hence less variable, than local Seyferts and ii) they are located at higher redshifts, which allows the SDSS 3” fibers to encompass the whole [Ne V]-emitting region, thus reducing aperture issues.
4 SDSS obscured QSOs at
4.1 Sample selection
To directly apply the X/NeV obscuration diagnostic to distant AGN, we tried to select SDSS obscured QSOs at on the basis of their [Ne V] emission. We searched in the SDSS DR7 entire spectroscopic database (table SpecPhotoAll on the SDSS site) for objects with high [Ne V] , since nuclear obscuration should suppress the AGN continuum but not the flux of the lines produced in the NLR.
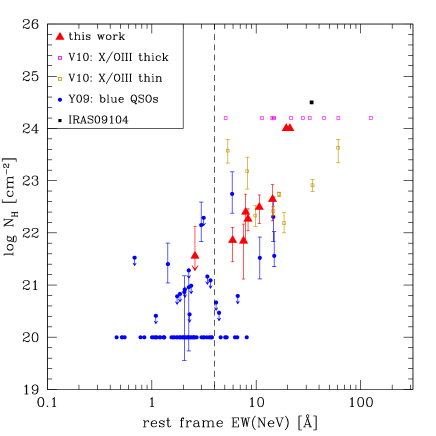
We concentrated on objects with , i.e. those not accessible through [O III] selection (thus excluded from the Zakamska et al. 2003 and Reyes et al. 2008 samples), and in which the [Ne V] line is observed at Å, where the SDSS spectral efficiency is highest. To avoid spurious detections, we conservatively considered those objects in which the [Ne V] line is detected at in the SDSS spectral tables and, to avoid strong contamination from unobscured, broad line (type-1) AGN, we restricted the search to those spectra with MgII 2800 emission with FWHM km s-1. The cut in the MgII 2800 line width is not stringent: this leaves in the sample obscured QSO candidates with broad optical lines and a red continuum, such as the red-QSO population described e.g. by Wilkes et al. (2002, 2005). The resulting median, rest frame [Ne V] of the sample is 2Å. We considered the high tail of the distribution, i.e. the objects with 4Å in the SDSS spectroscopic tables (89 objects). In Fig. 3 we show the correlation between the [Ne V] and the X-ray absorption as measured for the SDSS QSO and type-2 QSO samples discussed in the previous Sections: most objects with 4Å do show significant X-ray absorption, validating the use of this threshold. 666In Fig. 3 the 9 [Ne V]-selected targets discussed in the next Section are also shown. After re-fitting the SDSS spectra one object shows , i.e. below the 4Å threshold chosen in the SDSS spectroscopic tables. The re-fitted [Ne V] fluxes and s of the remaining 8 objects are instead found to differ by only a few percent from those resulting from the SDSS automated fit procedure.
We visually inspected all the 89 selected spectra to verify possible problems related to the SDSS automated procedure and to discard QSOs showing a blue continuum. At the end of this process, we selected 27 objects which, based on their optical spectrum, appear to be good obscured QSO candidates at .
| SDSS Name | R | |||
|---|---|---|---|---|
| (1) | (2) | (3) | (4) | (5) |
| J105951.36+301817.4 | 0.887 | 19.667 | 8.12 | 8.3 |
| J092640.67+023628.7 | 1.306 | 20.658 | 7.76 | 14.3 |
| J034222.54–055727.9 | 0.882 | 19.846 | 6.83 | 7.5 |
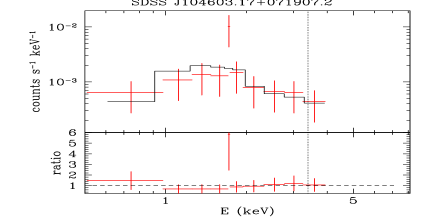
| J104603.17+071907.2 | 0.888 | 20.191 | 5.73 | 10.7 |
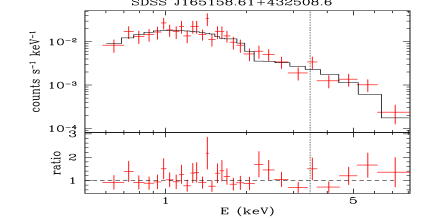
| J165158.61+432508.6 | 0.853 | 20.093 | 4.20 | 5.9 |
| J080859.33+204711.8 | 0.908 | 21.059 | 4.98 | 21.0 |
| J125848.58+120531.1 | 1.035 | 20.013 | 5.13 | 7.9 |
| J145503.94+515539.9 | 1.277 | 19.466 | 2.00 | 2.6 |
| J085600.88+371345.5 | 1.022 | 21.278 | 4.05 | 19.3 |
Column description: (1) Source name. (2) Redshift. (3) SDSS PSF magnitude in the R-band. (4) Measured [Ne V]3426 flux in units of erg cm-2 s-1. (5) [Ne V]3426 rest frame equivalent width in units of Angstrom.
4.2 Chandra observations
In Chandra Cycle 10 we were awarded 10ks ACIS-S observations of 8 targets which, based on their optical spectrum, were considered as good obscured QSOs targets (i.e. they show either narrow emission lines only or broad, 2000FWHM3000 km s-1, lines over a red continuum). Observations have been performed between December 2008 and July 2009, with the S3 chip at the aimpoint and using the very faint telemetry mode. We performed standard data reduction and extraction of spectra using CIAO v3.2.2. A 10ks ACIS-S observation of an archival object (SDSSJ085600, PI Strauss) satisfying our selection criteria has been also analyzed.
The basic optical properties of these 9 objects (redshift, R-band magnitude, [Ne V] flux and rest-frame ) are shown in Table 1, while the journal of Chandra observations is shown in Table 2.
Apart from the archival object, which shows only 2 X-ray photons within 1.5” of the optical source position, all the other targets were detected, with photon statistics ranging from 18 to 313 counts in the 0.5-8 keV band. Spectral fitting was performed using XSPEC v11.3.1. Standard minimization has been adopted for spectra showing more than 100 counts in the 0.5-8 keV band, binned to a minimum of 10 counts per energy bin. C-statistics (Cash 1979) has been used for spectra with lower photon statistics, binned to a minimum of 3 counts per bin. Model fits consist of simple power-laws modified by Galactic absorption and absorption at the source redshift. Errors on the best fit spectral parameters are quoted at 90% confidence level for one interesting parameter.
| SDSS Name | ObsId | Date | Exp. |
|---|---|---|---|
| (1) | (2) | (3) | (4) |
| J105951.36+301817.4 | 10325 | 2009-01-29 | 10.0 |
| J092640.67+023628.7 | 10326 | 2009-03-23 | 10.0 |
| J034222.54–055727.9 | 10327 | 2008-12-02 | 9.8 |
| J104603.17+071907.2 | 10328 | 2009-02-10 | 10.0 |
| J165158.61+432508.6 | 10329 | 2009-06-30 | 10.0 |
| J080859.33+204711.8 | 10330 | 2008-12-22 | 10.0 |
| J125848.58+120531.1 | 10331 | 2009-02-23 | 9.2 |
| J145503.94+515539.9 | 10332 | 2009-07-27 | 10.0 |
| J085600.88+371345.5 | 6807 | 2006-02-17 | 10.3 |
Column description: (1) Source name. (2) Chandra observation identifier. (3) Observing date (yyyy-mm-dd). (4) Exposure time in ks.
| SDSS Name | Cts | HR | class | |||||||
|---|---|---|---|---|---|---|---|---|---|---|
| (1) | (2) | (3) | (4) | (5) | (6) | (7) | (8) | (9) | (10) | (11) |
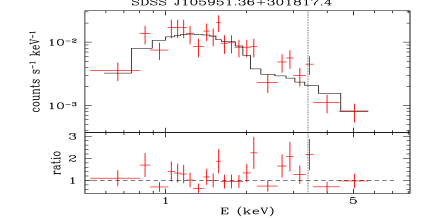
| J105951.36+301817.4 | 237 | -0.30 | 2.0 | 1.84 | 1.90 | 25.6/20 | 16 | 44.70 | 44.80 | thin |
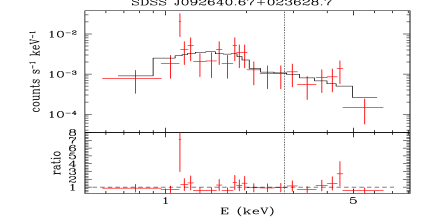
| J092640.67+023628.7 | 65 | -0.06 | 3.8 | 4.40 | 1.67 | … | 6.8 | 44.61 | 44.75 | thin? |
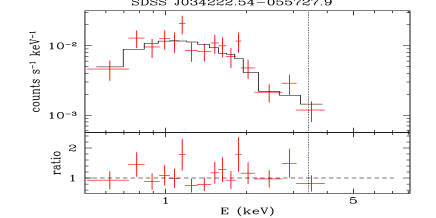
| J034222.54–055727.9 | 175 | -0.50 | 5.3 | 0.70 | 1.83 | 10.4/13 | 13 | 44.60 | 44.61 | thin |
| J104603.17+071907.2 | 31 | -0.16 | 2.8 | 3.10 | … | 3.7 | 44.04 | 44.15 | thin? | |
| J165158.61+432508.6 | 313 | -0.38 | 1.9 | 0.72 | 1.76 | 20.7/27 | 19 | 44.76 | 44.79 | thin |
| J080859.33+204711.8 | 18 | 0.80 | 4.0 | … | -1.2 | … | 14 | 43.95 | 45.65∗ | thick |
| J125848.58+120531.1 | 18 | -0.05 | 2.2 | 2.5 | … | 1.8 | 43.88 | 43.97 | thin? | |
| J145503.94+515539.9 | 125 | -0.43 | 1.8 | 0.36 | 1.82 | 14.4/9 | 5.7 | 44.67 | 44.69 | thin |
| J085600.88+371345.5 | ….. | 2.9 | … | … | … | 2.0 | 43.50 | 45.20∗ | thick |
Column description: (1) Source name. (2) Net counts in the 0.5-8 keV band. (3) Hardness ratio, defined as (H-S)/(H+S), where H and S are the number of photons observed in the 0.5-2 keV and 2-8 keV bands, respectively. (4) Galactic column density in units of cm-2 (Dickey & Lockman 1990). (5) Absorbing column density at the source redshift in units of cm-2. (6) Photon index. (7) Chi-square value over number of degrees of freedom: for sources with less than 100 net counts C-statistics has been used. (8) Observed 2-10 keV flux in units of erg cm-2 s-1. (9) Logarithm of the 2-10 keV rest frame luminosity, not corrected for absorption, in units of erg s-1. (10) Logarithm of the intrinsic 2-10 keV rest frame luminosity, i.e. corrected for absorption, in units of erg s-1; ∗for the two candidate Compton-Thick objects it is assumed (see text). (11) Object classification based on the X-ray spectral analysis and the X/NeV ratio.
Four sources have been detected with sufficient photon statistics ( counts) to perform a rough spectral analysis and classify them as Compton-Thin, as also suggested by their soft hardness ratios (HR). One object, namely SDSSJ080859, shows a faint (18 counts), very hard (HR=0.8) spectrum with a hint of excess emission at keV. If the excess is interpreted as a redshifted 6.4 keV iron emission line superimposed to a hard power-law continuum (), this would imply a rest frame equivalent width of keV. The X-ray spectral features of SDSSJ080859 are therefore highly suggestive of CT absorption. Three objects (SDSSJ092640, SDSSJ104603 and SDSSJ125848) are intermediate cases in terms of both photon statistics (from 18 to 65 counts) and X-ray hardness (from HR=-0.16 to -0.05). By fitting the data with an absorbed power-law (fixing to 1.8 for two of them), these sources appear to be Compton-Thin. All the detected sources have relatively bright observed 2-10 keV fluxes ( erg cm-2 s-1) and rest-frame 2-10 keV luminosities erg s-1 (prior to absorption corrections), placing them among luminous obscured QSOs. As for the archival undetected object, SDSSJ085600, by assuming a 2-10 keV band detection limit of 4 photons and a pure reflection spectrum (pexrav in XSPEC), the corresponding upper limits to the observed 2-10 keV flux and rest frame luminosity, are erg cm-2 s-1 and erg s-1, respectively. A summary of the results obtained from the X-ray analysis of these 9 objects is given in Table 3. Optical and X-ray spectra are shown in Fig. 8
4.3 Position on the X/NeV diagram
We placed the new 9 SDSS obscured QSOs at on the X/NeV diagram (see Fig. 2). The archival undetected X-ray object SDSSJ085600 shows X/NeV, which is strongly suggestive of CT absorption. Indeed, most SDSS QSOs classified as CT by V10 do show X/NeV ratio below this value, while all those classified as Compton-Thin by V10 lie at X/NeV.
The faint (18 X-ray counts) object SDSSJ0808 has X/NeV. This value has been observed in both CT and Compton-Thin AGN (see Fig. 1), but, based on the X-ray spectral analysis, SDSSJ0808 appears to have all the signatures of CT absorption. We then classify SDSSJ085600 and SDSSJ0808 as likely CT candidates.
The four objects with highest photon statistics have also the lowest absorption and the highest X/NeV ratios (X/NeV), and occupy a region of the diagram which is populated by the Compton-Thin QSOs in V10 and by the obscured tail of the broad line SDSS QSOs studied by Young et al. (2009).
Finally, three objects do show X/NeV ratios in the range 20-60, which are typical of heavily obscured AGN, but are still consistent with Compton-Thin absorption. Both the X-ray and optical spectra of these sources would favor mild absorption, hence a Compton-Thin interpretation, although no clear cut classification can be made with the current data.
We note that the actual degree of obscuration of our two CT candidates SDSSJ085600 and SDSSJ0808 can only be confirmed by obtaining good-quality X-ray spectra through deeper observations. Indeed, any selection method which simply relies on X-ray hardness ratios, or on the comparison between the measured, obscured X-ray emission (if any) with some other indicator of the intrinsic nuclear power (e.g. dust-reprocessed IR-emission, or high-ionization, narrow optical emission lines) can only provide an indirect way to select CT AGN. Different caveats and limitations affect these different selection methods, like e.g. reddening in line-selected sources and contamination from star formation in IR-selected sources.
5 Discussion
5.1 [Ne V] as a good tracer of nuclear luminosity: effects of reddening in the Narrow Line Region and anisotropy
The X/NeV vs X-ray absorption diagnostic diagram presented in Section 3 has been derived directly from observed values, without applying any corrections to either [Ne V] or X-ray emission. The rationale behind is that X-rays come from the innermost nuclear regions and can be depressed by small scale (1 pc) absorption, while the [Ne V] is instead a good indicator of the intrinsic nuclear luminosity being i) emitted on larger (kpc) scales, free from nuclear obscuration and ii) being isotropic. We now discuss whether this two hypotheses are satisfied and what happens if they are not.
As for the first point, we note that significant extinction towards the NLR is commonly observed in local AGN (e.g. Dahari & De Robertis 1988). Under the simplest version of the AGN unification schemes, one would expect to observe similar properties in the NLR of both type-1 and type-2 AGN. Therefore, if the dust content in the NLR of both AGN types is the same, the same extinction correction should be applied to the measured values of the [Ne V] lines, which would simply shift towards lower X/NeV values all the datapoints in Fig. 1 and 2, without altering the X/NeV vs trend. However, based on the results by Dahari & De Robertis (1988), there is some evidence that the extinction to the NLR in local Seyfert 2s is somewhat higher than in Seyfert 1s, the following relation holding for the median values: . Using standard extinction curves (e.g. Gaskell & Benker 2007), this translates into an average correction in the [Ne V] flux a factor of larger in Seyfert 2s than in Seyfert 1s. Applying some extinction correction to both the observed data and model curves would then produce a stronger shift towards lower X/NeV ratios in Seyfert 2s than in Seyfert 1s, making the anti-correlation between X/NeV ratio and obscuration even more evident.
At any rate, our main interest is on the possibility of applying the X/NeV diagnostic ratio to objects, for which it is often impossible to measure the extinction to the NLR because of the lack of strong Balmer lines in the optical spectrum. Therefore, we simply do not apply any reddening correction to the measured [Ne V] fluxes.
As for the second point, the isotropy of [Ne V] emission, we note that there is some evidence that the [Ne V] lines in SDSS type-1 QSOs are broader than in type-2 QSOs. As an example, in the composite spectrum of QSOs from the 2dF survey (Colless et al. 2001) the [Ne V] width (FWHM km s-1) is found to be in-between that of broad lines (e.g. H and MgII, FWHM km s-1) and that of narrow lines (e.g. [O II] and[O III], FWHM km s-1; see Fig.2 in Corbett et al. 2003).
According to the standard Unified Model, this would suggest that, whenever a direct look towards the nucleus is available, an additional broader [Ne V] component is observed, coming from low density and fast moving clouds which cannot be observed in type-2 AGN, possibly being located in-between the BLR and the NLR. If this is true, then the total [Ne V] emission line in not a good isotropic indicator of the intrinsic AGN power, since in type-2 objects only a portion of the [Ne V] emitting region can be observed. If anything, this would go in the direction of underestimating the total [Ne V] luminosity in type-2 AGN. Correcting for this effect, would make the X/NeV ratio even lower in type-2 AGN. To summarize, if corrections for reddening and anisotropy were applied, the X/NeV vs trend shown in Fig. 2 would be even stronger.
5.2 Comparison between [O III] and [Ne V] selection
As discussed in Section 4.2, 2 out of 9 [Ne V]-selected type-2 QSOs () appear to be likely CT candidates based on their X-ray spectral properties and/or X/NeV ratio. At face value, the fraction of [Ne V]-selected CT QSO candidates appears lower than that based on [O III] selection, which is around 60-70% (V10). However, we note that the difference between the CT detection rate can be mainly ascribed to intrinsic differences in the two parent samples of obscured QSOs. Indeed, our sample also includes obscured QSOs which have a red continuum but still do show broad optical lines. These objects (see Fig. 8), appear to be part of the population of red QSOs discussed e.g. by Wilkes et al. (2002, 2005) and Urrutia et al. (2005), which on average are absorbed by columns below cm-2. On the contrary, V10 selected their objects from the sample of Zakamska et al. (2003), in which strict criteria on the line width have been adopted, producing an ensamble of pure type-2 objects. As a simple check, when considering only those [Ne V]-selected objects which look like pure type-2 spectra (e.g. MgII FWHM km s-1) the fraction of CT candidates increases to 50% (2/4). Despite the very low statistics, this fraction is consistent with what has been found by V10, suggesting that, when the search is restricted to pure type-2 objects, [Ne V] selection may be an efficient way to pick up CT AGN at .
5.3 Application of the X/NeV diagnostic to spectroscopic surveys with deep X-ray coverage
Synthesis models predict that from 10% to about 30% of the XRB at 30 keV is not accounted for by the integrated emission of Compton-Thin AGN. This “missing” background is expected to be produced by Compton-Thick AGN, and most of it is expected to be produced by CT AGN with Seyfert-like intrinsic luminosities at a redshift of . The [Ne V]-selected CT QSOs in the SDSS represent the high-luminosity, low space density tail of the distribution of CT AGN at , and are expected to provide only a minor contribution to the missing XRB. Selection of lower-luminosity CT AGN at is therefore needed, which can in principle be done by applying the X/NeV diagnostics to objects in sky areas with deep spectroscopic surveys and deep X-ray coverage. As an example, the combination between the zCOSMOS-bright spectroscopic survey (Lilly et al. 2007, 2009) and the Chandra-COSMOS X-ray survey (Elvis et al. 2009; Puccetti et al. 2009) in the COSMOS field (Scoville et al. 2007) would be able to identify CT AGN at down to intrinsic erg s-1, i.e. the population which is thought to produce a large fraction of the missing XRB (Vignali et al. in preparation). In the GOODS-S and -N fields, the population of CT AGN at can be tracked further down to intrinsic of erg s-1. Furthermore, since the CT samples obtained using the X/NeV diagnostic appear to be relatively free from contamination by less obscured objects, by using spectroscopic surveys with well defined selection functions it would be possible to estimate the space density of this missing AGN population.
It has to be noted that selection of obscured AGN through the [Ne V]3426 line is most likely a lower limit, since it misses objects with dusty Narrow Line Regions, which can instead be picked up by mid-IR selection (Daddi et al. 2007; Fiore et al. 2008). However, when sufficiently deep mid-IR coverage is not available for spectroscopic survey fields, [Ne V]-selection may then represent a promising and ready-to-use method to get large samples of CT AGN. In addition, the comparison between the space density of [Ne V] and mid-IR selected objects with similar redshifts and bolometric luminosities in fields with full multiwavelength coverage, may indicate the fraction of objects in which the NLR is free from obscuration, thus constraining the physical scale on which absorption arises.
5.4 Enhanced star formation in type-2 QSOs?
Popular semi-analytic models of galaxy formation and evolution (Kauffmann & Haehnelt 2000; Marulli et al. 2008; Hopkins et al. 2008) propose that, at least for the most massive and luminous objects, nuclear activity and star formation are both triggered by major mergers of gas rich galaxies, and that at the early stages of the merger, when star formation is more vigorous, the AGN is embedded within optically thick gas shrouds. According to this scenario one can therefore expect to observe strong star formation in obscured QSOs.
At redshift , the concurrent obscured black hole growth and star formation has been observed in the population of bright submillimeter sources (e.g. Alexander et al. 2005). At low redshifts (), Kim et al. (2006) noted that the ratio between the luminosity of the [O II]3727 line and the [O III]5007 line is a factor of higher in the type-2 QSO composite spectrum of Zakamska et al. (2003) than in the average spectrum of type-1 QSOs. Because of the similar [O III] luminosity of the two populations, the excess of low-ionized oxygen in type-2 QSOs could not be explained in terms of different ionization parameters of the Narrow Line Regions, and was then interpreted by Kim et al. (2006) as due to enhanced star formation in type-2 QSOs.
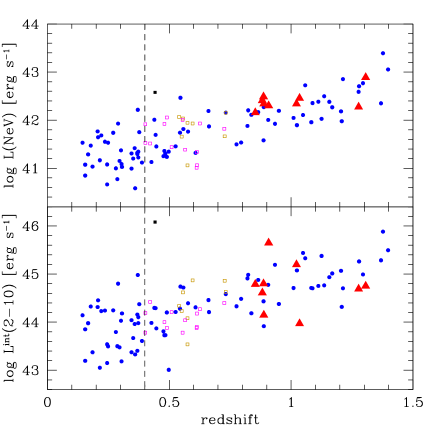
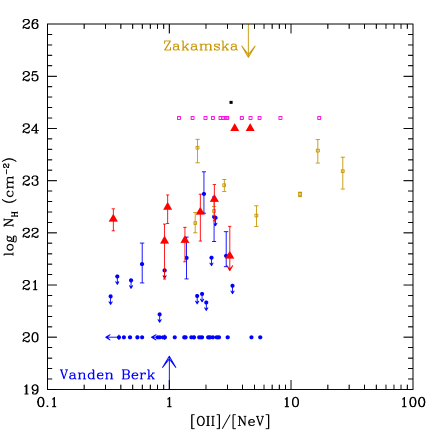
We then investigated the star formation in the samples presented in this work by measuring the [O II]3727 flux on the SDSS spectra and considered the [O II] over [Ne V] ratio as a function of the nuclear obscuration. To compare objects in the same redshift range we restricted our analysis to . As shown in Fig.4, this cut removes only low-redshifts type-1 QSOs and ensures that both type-1 and type-2 QSOs span a similar luminosity range.777The intrinsic X-ray luminosity of CT QSOs has been assumed to be 50 the observed one, while V10 defined as CT candidates those objectes in which the expected intrinsic X-ray luminosity was at least a factor of 100 larger than the observed one. We note that, even with a factor of 2 larger correction, the intrinsic luminosity of the CT QSOs considered in this work would still be comparable with that of unobscured QSOs in the same redshift range. We note that, for QSOs in the redshift range =0.4-1.5, the 3” size of the SDSS fibers encloses regions as large as 16-26 kpc diameter, and therefore samples a significant portion of the host galaxy in which star formation can take place.
In Fig. 5 we plot the [O II]/[Ne V] ratio as a function of the measured X-ray column density. The blue SDSS QSOs in the Y09 sample do show [O II]/[Ne V] ratios on average lower than type-2 QSOs. Some positive correlation, albeit with a large scatter, is indeed seen between the [O II]/[Ne V] ratio and the absorbing column density . When considering those objects with observed [O II]/[Ne V] , we found that only 2 out of 12 are not obscured, and half of them (6 objects) are likely obscured by CT absorption. Conversely, there are no objects with cm-2among those with [O II]/[Ne V] . The [O II]/[Ne V] ratios measured on the SDSS type-2 and type-1 QSO composites by Zakamska et al. (2003) and Vanden Berk et al. (2001) were also considered and found to be in good agreement with the averages measured in this work for obscured and unobscured QSOs, respectively (see Fig. 5). We tried to compute the significance of the correlation between the [O II]/[Ne V] ratio and the logarithm of the column density. We note that it is difficult to deal with objects which are either unobscured or CT candidates, because they cannot be treated statistically as proper upper or lower limits on , since the gas column density can plausibly vary only within a bounded range (i.e. it cannot be zero or infinite). For simplicity we therefore assumed log=20 for unobscured objects and log=24 for CT candidates, respectively (see Fig. 5). The presence of a correlation has been estimated through the asurv software package (Lavalley et al. 1992), using the generalized Kendall’s and the Spearman’s correlation tests. We found that the probability that the correlation is not present is only and , respectively. If the [O II] emission measured in type-2 QSOs is interpreted as entirely due to star formation, the median [O II] luminosities of the [O III]- and [Ne V]-selected samples would correspond to star formation rates of and /yr, respectively (using the relation by Kewley et al. 2004). These values could decrease by up to a factor of if the AGN contribution to the [OII] emission is significant (Silverman et al. 2009). This finding is consistent with the expectations from the AGN evolutionary sequence outlined above.
6 Conclusions
We have presented a diagnostic diagram to identify heavily obscured,
Compton-Thick AGN candidates at based on the ratio between the 2-10 keV flux
and the [Ne V]3426 emission line flux (X/NeV). The diagnostic was calibrated on a sample of 74
local Seyfert galaxies and then applied to populations of type-1 and type-2 QSOs at different
redshifts (from to ) selected from the SDSS. The main results obtained in this work can be summarized as follows.
The observed X/NeV ratio is found to decrease with increasing absorption: the mean X/NeV ratio for
unobscured Seyferts is about 400, about 80% of local Seyferts with X/NeV are obscured by column
densities above cm-2 and essentially all objects with
observed X/NeV are Compton-Thick.
We considered a sample of 83 blue type-1 QSOs and 21 [O III]-selected type-2 QSOs in the SDSS
which have been observed in the X-rays and show significant [Ne V] detection. It was verified that they
follow the same X/NeV vs X-ray absorption trend which is observed for local Seyferts. Furthermore, SDSS type-2 QSOs
classified either as Compton-Thick or Compton-Thin on the basis of their X/OIII ratio, would have been mostly classified in the same
way based on the X/NeV ratio.
The X/NeV diagnostic was used to investigate the obscuration of
9 SDSS obscured QSOs in the redshift range , which is not accessible through
[O III] selection. The 9 objects were selected by means of their prominent [Ne V]3426 line
(Å), and Chandra snapshot observations for 8 of them were obtained (one object is from the archive).
Based on the X/NeV ratio, complemented by X-ray
spectral analysis, only 2 objects appear good Compton-Thick QSO
candidates. However, when considering the 4 genuine narrow-line objects only (FWHM of the MgII line km ),
the efficiency in selecting Compton-Thick QSOs through the [Ne V] line is about 50% (2/4), which is more similar,
despite the large uncertainties, to what is achieved with [O III] selection (60-70%; Vignali et al. 2010).
We verified that neither extinction nor anisotropy corrections on the [Ne V] emission
would affect our conclusions and that the X/NeV diagnostic is therefore a good method to identify clean, despite not complete, samples of
heavily obscured AGN.
We discussed the possibility of applying the X/NeV diagnostic to objects in sky areas with deep optical spectroscopy and X-ray coverage.
This will allow to identify Compton-Thick Seyferts at , i.e. those objects which are thought to be responsible for
a large fraction of the “missing” X-ray background.
Finally, the optical emission line properties of [Ne V]-selected QSOs were compared with those of other SDSS populations of obscured and unobscured QSOs. By restricting the analysis to objects in the same redshift (and luminosity) range =[0.4-1.5], we found evidence that the ratio between the [O II]3727 and [Ne V]3426 luminosity increases with obscuration. This correlation is interpreted as evidence of enhanced star formation in obscured QSOs, which is consistent with current popular scenarios of BH-galaxy coevolution.
Acknowledgements.
We thank Martin Elvis, Alessandro Marconi, Lucia Pozzetti, Guido Risaliti, Marco Salvati and Pilar Esquej for stimulating discussions and Monica Young for kindly providing the catalog of SDSS QSOs for which XMM-Newton data were available. We thank the referee for a timely and useful report. We acknowledge partial support from ASI-INAF and PRIN/MIUR under grants I/023/05/00, I/088/06/00 and 2006-02-5203.Appendix A Master table for the local sample
In the Tables at the end of the Appendix we present the sample of local objects which has been used to build the X/NeV vs X-ray absorption diagram shown in Fig. 1. The X-ray absorption, X-ray flux and [Ne V] flux have been derived from the literature. As for X-ray data, we generally preferred to use the values obtained with the most recent and sensitive satellites, Chandra and XMM-Newton. When dealing with heavily obscured objects, though, we considered measurements obtained with Suzaku and BeppoSAX in order to map the energy range above 10 keV and get a more robust measurements of the absorbing column density. Sometimes an observed 2-10 keV flux measurement is not directly quoted in the considered literature papers: in those cases we estimated it using the published best fit spectral parameters and/or 2-10 keV luminosity. We analyzed the archival, unpublished X-ray data of 4 objects (Mrk 78, Tol 1506.3-00, NGC 4074, IIIZw77) and re-analyzed the X-ray spectrum of NGC 1320 since the 2-10 keV flux we derived from the best-fit parameters in Greenhill et al. (2008) appears to differ significantly from that listed in the 2XMM catalog. The X-ray spectra and best fit parameters for these objects are presented below.


A.1 X-ray spectra of individual objects analyzed in this work
For the AGN observed by XMM-Newton (Mrk 78, Tol 1506.3-00, NGC 4074, NGC 1320), EPIC pn spectral results are presented, while for ASCA data (IIIZw77), we refer to SIS spectra. All of the sources presented below were pointed as targets, with the exception of NGC 4074, which was observed at an off-axis angle of 7.3′.
A.2 XMM-Newton data
A.2.1 Mrk 78
The X-ray spectrum of Mrk 78 (top-left panel in Fig. A.1; effective exposure time in EPIC-pn of 7.2 ks) is well fitted with a model including, in the soft X-ray energy band, a thermal ( 0.6 keV) and a power-law component (with a photon index 2.3). The emission at energies above 2 keV is well reproduced by an absorbed ( cm-2) power-law (with photon index fixed to 1.8 because of the limited photon statistics) plus an iron emission line. The line energy (E=6.31–6.45 keV) indicates emission from neutral or mildly ionized iron, while its ( 340 eV) is consistent, within the errors, with being produced by transmission through the same matter responsible for the absorption of the nuclear component. The 0.5–2 keV and 2–10 keV fluxes are erg cm-2 s-1 and erg cm-2 s-1, respectively; the de-absorbed, rest-frame 2–10 keV luminosity for this source is erg s-1.
A.2.2 Tol 1506.300
Tol 1506.300 was observed for 3.7 ks with XMM-Newton (top-right panel in Fig. A.1). Its spectrum is characterized by a thermal ( 0.2 keV) plus a power-law component at soft energies, while the emission above 2 keV is well parameterized by a power-law with and mild absorption ( cm-2). No iron line is present, the upper limit on its , in the case of neutral iron, is 40 eV (90% confidence level). The 0.5–2 keV and 2–10 keV fluxes are erg cm-2 s-1 and erg cm-2 s-1, respectively. The intrinsic, rest-frame 2–10 keV luminosity of Tol 1506.300 is erg s-1.
A.2.3 NGC 4074
The XMM-Newton spectrum of NGC 4074 (bottom-left panel in Fig. A.1; exposure time of 2.6 ks) requires a double power-law model, with the component at energies above 3 keV being absorbed by a column density NH cm-2 (assuming ). No iron line is present, with a 90% upper limit on the of a neutral iron line of 190 eV. The measured 0.5–2 keV (2–10 keV) flux is erg cm-2 s-1 ( erg cm-2 s-1), while the de-absorbed, rest-frame 2–10 keV luminosity is erg s-1.
A.2.4 NGC 1320
Among the sources observed by XMM-Newton and presented in this Appendix, NGC 1320 is the one with the longest exposure time ( 11.5 ks) and most complex X-ray spectrum, as shown in Fig. A.1 (bottom-right panel). The X-ray data for this source are highly suggestive of the presence of both a transmission and reflection component. While the transmitted component is well parameterized by a power-law continuum absorbed by thick matter (with a column density of cm-2), for the reflection component the parameters are basically unconstrained, calling for observations with higher photon statistics and data above 10 keV to properly model and constrain the two spectral components. The best-fitting model requires also the presence of a power-law () at low energies and a Ne ix emission line at an energy of 930 eV ( 50 eV). The measured 0.5–2 keV (2–10 keV) flux is erg cm-2 s-1 ( erg cm-2 s-1) 888consistent with the value quoted in the 2XMM catalog., and the de-absorbed, rest-frame 2–10 keV luminosity is erg s-1; we note, however, that this value is somehow uncertain, given the complex X-ray modeling of the data presented here.
A.3 ASCA data
A.3.1 IIIZw77
An ASCA observation with a net exposure time of ks has detected a faint X-ray source at this galaxy. The X-ray spectrum (see Fig. A.2) shows a hard X-ray excess above 3 keV when a simple power-law is fitted. This hard X-ray component probably originates from an obscured active nucleus. When modeled by an absorbed power-law with photon index , the absorbing column density is estimated to be cm-2. The data have no sufficient quality to constrain a Fe K emission-line. The soft X-ray component can be described by a power-law of . While the origin of the soft X-ray emission is unclear, assuming that no strong star formation is taking place in this E/S0 galaxy, it is likely extended photoionized gas. The observed fluxes in the 0.5-2 keV and 2-10 keV bands are erg cm-2 s-1 and erg cm-2 s-1, respectively. The absorption-corrected 2–10 keV luminosity derived from the absorbed power-law model is erg s-1.

| Name | Type | log | log | log | A | |||
|---|---|---|---|---|---|---|---|---|
| (1) | (2) | (3) | (4) | (5) | (6) | (7) | (8) | (9) |
| NGC 3227 | 1.5 | 0.0039 | 22.83 | -11.09 | 1 | -13.05 | L | 1 |
| NGC 3516 | 1.5 | 0.0088 | 20.63 | -10.62 | 2 | -13.15 | L | 1 |
| NGC 3783 | 1.0 | 0.0097 | 20.00 | -10.07 | 3 | -12.86 | M | 2 |
| NGC 4051 | 1.5 | 0.0020 | 20.00 | -10.64 | 4 | -12.98 | L | 1 |
| NGC 4151 | 1.5 | 0.0033 | 22.88 | -10.35 | 1 | -11.70 | L | 1 |
| NGC 4253 | NLS1 | 0.0129 | 20.00 | -10.80 | 5 | -13.49 | M | 3 |
| NGC 4395 | 1.0 | 0.0010 | 20.80 | -11.30 | 6 | -14.10 | S | 4 |
| NGC 4593 | 1.0 | 0.0090 | 20.00 | -10.43 | 7 | -13.60 | M | 2 |
| NGC 5548 | 1.5 | 0.0172 | 20.00 | -10.28 | 7 | -12.57 | L | 1 |
| NGC 6814 | 1.5 | 0.0052 | 20.00 | -11.82 | 8 | -13.77 | M | 2 |
| NGC 7469 | 1.2 | 0.0163 | 20.00 | -10.64 | 7 | -12.74 | L | 1 |
| Mrk 42 | NLS1 | 0.0246 | 20.00 | -11.98 | 9 | -14.52 | L | 5 |
| Mrk 359 | NLS1 | 0.0169 | 20.00 | -11.24 | 10 | -13.30 | S | 4 |
| Mrk 486 | NLS1 | 0.0389 | 20.00 | -11.55 | 11 | -13.68 | S | 4 |
| Mrk 493 | NLS1 | 0.0313 | 20.00 | -11.46 | 10 | -14.52 | M | 3 |
| Mrk 509 | 1.2 | 0.0344 | 20.00 | -10.47 | 7 | -12.24 | M | 2 |
| Mrk 704 | 1.5 | 0.0291 | 23.13 | -11.25 | 12 | -13.21 | S | 4 |
| Mrk 705 | 1.2 | 0.0285 | 20.00 | -10.64 | 13 | -13.80 | S | 4 |
| Mrk 841 | 1.5 | 0.0364 | 20.00 | -10.79 | 14 | -13.15 | M | 2 |
| Mrk 896 | 1.0 | 0.0264 | 20.00 | -11.46 | 10 | -14.10 | M | 2 |
| Mrk 926 | 1.5 | 0.0469 | 20.00 | -10.51 | 7 | -13.96 | S | 6 |
| Mrk 1239 | NLS1 | 0.0194 | 23.52 | -11.82 | 15 | -13.31 | S | 4 |
| 3C 120 | BLRG | 0.0330 | 20.70 | -10.31 | 16 | -13.72 | S | 6 |
| 3C 227 | BLRG | 0.0858 | 22.10 | -11.70 | 17 | -14.40 | M | 7 |
| 3C 382 | BLRG | 0.0578 | 20.00 | -10.21 | 18 | -13.85 | M | 7 |
| 3C 390.3 | BLRG | 0.0561 | 20.60 | -10.40 | 19 | -13.59 | S | 4 |
| 3C 445 | BLRG | 0.0562 | 22.70 | -11.17 | 20 | -13.85 | M | 2 |
| Fairall 9 | 1.2 | 0.0470 | 20.00 | -10.92 | 7 | -13.03 | M | 8 |
| Fairall 51 | 1.0 | 0.0142 | 22.20 | -10.60 | 21 | -13.29 | M | 2 |
| Fairall 1116 | 1.0 | 0.0582 | 20.00 | -11.27 | 22 | -13.54 | M | 8 |
| Tol 1351-375 | 1.9 | 0.0520 | 22.20 | -11.42 | 23 | -13.48 | M | 2 |
| Tol 1506.3-00 | 1.5 | 0.0543 | 21.85 | -11.11 | 24 | -14.00 | M | 2 |
| H1143-182 | 1.5 | 0.0329 | 20.00 | -10.55 | 4 | -13.19 | M | 8 |
| H1846-786 | 1.0 | 0.0743 | 20.00 | -11.10 | 7 | -13.49 | M | 2 |
| Akn 120 | 1.0 | 0.0330 | 20.00 | -10.42 | 25 | -14.15 | S | 4 |
| Akn 564 | NLS1 | 0.0247 | 20.00 | -10.80 | 26 | -13.33 | S | 4 |
| MCG-6-30-15 | 1.2 | 0.0077 | 20.00 | -10.62 | 27 | -14.05 | M | 2 |
| 1ES1615+061 | 1.5 | 0.0380 | 20.00 | -11.10 | 28 | -14.22 | M | 2 |
| IIIZw77 | 1.2 | 0.0342 | 23.90 | -12.22 | 24 | -13.55 | M | 9 |
| ESO 141-G55 | 1.2 | 0.0360 | 20.00 | -10.57 | 29 | -13.17 | M | 8 |
| POX 52 | 1.0 | 0.0218 | 20.70 | -12.11 | 30 | -13.35 | M | 10 |
Column description: (1) Source name. (2) Spectroscopic classification
(1.0, 1.2 and 1.5 refer to Seyfert types). (3) Redshift. (4) Logarithm
of the cold X-ray absorbing column density. For those objects in which
no cold absorption is measured in excess of the Galactic value, the
column has been fixed to log=20. (5) Logarithm of the observed
2-10 keV flux in erg cm-2 s-1. (6) Reference for the X-ray
data. (7) Logarithm of the [Ne V]3426 flux in erg cm-2
s-1. (8) Aperture used to measure the [Ne V] flux, defined
following Schmitt (1998): S (small), M (medium) and L (large)
correspond to apertures in the ranges 1-3”, 3-7”, and 7”,
respectively. (9) Reference for the [Ne V] data.
X-ray references:
(1) Cappi et al. 2006; (2) Bianchi et al. 2004;
(3) Blustin et al. 2002; (4) Bianchi et al. 2009;
(5) Landi et al. 2005; (6) Iwasawa et al. 2010; (7) Shinozaki et al. 2006;
(8) Vasudevan & Fabian 2007; (9) Vaughan et al. 1999; (10) Gallo 2006;
(11) Ballo et al. 2008; (12) Landi et al. 2007; (13) Gallo et al. 2005;
(14) Piconcelli et al. 2005; (15) Grupe et al. 2004; (16) Grandi et al. 2006;
(17) Hardcastle et al. 2007;
(18) Gliozzi et al. 2007; (19) Evans et al. 2006; (20) Sambruna et al. 2007;
(21) Jiménez-Bailón et al. 2008
(22) D’Ammando et al. 2008; (23) Risaliti et al. 2000; (24) this work;
(25) Vaughan et al. 2004;
(26) Vignali et al. 2004; (27) Ponti et al. 2004; (28) Guainazzi et al. 1998;
(29) Gondoin et al. 2003; (30) Thornton et al. 2008.
[Ne V] references:
(1) Anderson 1970; (2) Morris & Ward 1988; (3) Osterbrock & Pogge 1985;
(4) Erkens et al. 1997;
(5) Malkan 1986;
(6) Durret & Bergeron 1988;
(7) Osterbrock et al. 1976; (8) Winkler 1992; (9) Osterbrock 1981b; (10) Kunth et al. 1987.
| Name | Type | log | A | |||||
|---|---|---|---|---|---|---|---|---|
| (1) | (2) | (3) | (4) | (5) | (6) | (7) | (8) | (9) |
| NGC 1068 | 2.0 | 0.0038 | 25.00 | -11.34 | 1 | -11.94 | M | 1 |
| NGC 1275 | NLRG | 0.0175 | 20.00 | -10.91 | 2a | -12.70 | L | 2 |
| NGC 1320 | 2.0 | 0.0089 | 24.00 | -12.24 | 3 | -13.15 | S | 3 |
| NGC 1667 | 2.0 | 0.0152 | 24.00 | -13.00 | 4 | -14.00 | L | 4 |
| NGC 2992 | 1.9 | 0.0077 | 21.95 | -10.13 | 5 | -14.52 | S | 5 |
| NGC 3081 | 2.0 | 0.0079 | 23.85 | -11.89 | 6 | -12.66 | L | 6 |
| NGC 3281 | 2.0 | 0.0106 | 24.18 | -11.54 | 7 | -14.52 | S | 5 |
| NGC 3393 | 2.0 | 0.0125 | 25.00 | -12.68 | 8 | -13.25 | L | 4 |
| NGC 4074 | 2.0 | 0.0224 | 23.38 | -11.59 | 3 | -14.05 | S | 7 |
| NGC 4507 | 2.0 | 0.0118 | 23.63 | -10.89 | 9 | -13.26 | L | 6 |
| NGC 5135 | 2.0 | 0.0136 | 24.00 | -12.80 | 10 | -13.54 | L | 4 |
| NGC 5506 | 1.9 | 0.0062 | 22.50 | -10.10 | 11 | -13.96 | M | 8 |
| NGC 5643 | 2.0 | 0.0040 | 23.80 | -12.08 | 12 | -13.33 | M | 8 |
| NGC 5728 | 2.0 | 0.0093 | 24.30 | -11.89 | 13 | -13.66 | L | 4 |
| NGC 7130 | 2.0 | 0.0161 | 24.00 | -12.29 | 14 | -14.00 | S | 9 |
| NGC 7314 | 1.9 | 0.0048 | 22.02 | -10.39 | 15 | -14.30 | M | 8 |
| NGC 7582 | 2.0 | 0.0052 | 24.00 | -11.64 | 16 | -12.48 | M | 10 |
| NGC 7674 | 2.0 | 0.0289 | 25.00 | -12.12 | 17 | -13.40 | L | 11 |
| Mrk 1 | 2.0 | 0.0159 | 24.00 | -12.89 | 18 | -13.49 | L | 11 |
| Mrk 34 | 2.0 | 0.0505 | 24.00 | -12.74 | 19 | -13.55 | L | 11 |
| Mrk 78 | 2.0 | 0.0371 | 23.76 | -12.23 | 3 | -13.85 | L | 11 |
| Mrk 348 | 2.0 | 0.0150 | 23.13 | -10.56 | 20 | -13.64 | L | 11 |
| Mrk 463E | 2.0 | 0.0500 | 23.85 | -12.39 | 21 | -13.89 | L | 11 |
| Mrk 477 | 2.0 | 0.0377 | 23.38 | -11.92 | 22 | -13.14 | L | 4 |
| Mrk 573 | 2.0 | 0.0171 | 24.00 | -12.92 | 23 | -13.00 | S | 3 |
| Mrk 609 | 1.8 | 0.0344 | 20.00 | -11.83 | 24 | -14.40 | S | 12 |
| Mrk 612 | 2.0 | 0.0204 | 23.81 | -12.44 | 18 | -13.66 | L | 11 |
| 3C 33 | NLRG | 0.0597 | 23.59 | -11.13 | 25 | -14.70 | M | 1 |
| MCG-5-23-16 | 2.0 | 0.0085 | 22.15 | -10.10 | 26 | -13.89 | S | 5 |
| WAS 49b | 2.0 | 0.0630 | 22.80 | -12.20 | 20 | -14.30 | S | 13 |
| Cygnus A | NLRG | 0.0560 | 23.23 | -10.89 | 25 | -14.40 | M | 14 |
| IC 3639 | 2.0 | 0.0109 | 24.00 | -13.10 | 18 | -13.60 | L | 4 |
| Tol 0109-383 | 2.0 | 0.0117 | 24.30 | -11.80 | 27 | -13.62 | S | 15 |
Column description: (1) Source name. (2) Spectroscopic classification (1.8, 1.9 and 2.0 refer to Seyfert types). (3)
Redshift. (4) Logarithm of the cold X-ray absorbing column
density. For those objects in which no cold absorption is measured in excess of the Galactic value,
the column has been fixed to log=20. (5) Observed 2-10 keV flux in units of erg
cm-2 s-1. (6) Reference for the X-ray data. (7) [Ne V]3426
flux in units of erg cm-2 s-1. (8) Aperture used to measure the [Ne V]
flux, defined following Schmitt (1998): S (small), M (medium) and L (large) correspond
to apertures in the ranges 1-3”, 3-7”, and 7”, respectively. (9) Reference for the [Ne V] data.
X-ray references:
(1) Cappi et al. 2006; (2) Panessa et al. 2006; (3) this work; (4) Bianchi et al. 2005;
(5) Gilli et al. 2000; (6) Bassani et al. 1999; (7) Vignali & Comastri 2002; (8) Maiolino et al. 1998;
(9) Matt et al. 2004; (10) Guainazzi et al. 2005a; (11) Bianchi et al. 2003;
(12) Guainazzi et al. 2004; (13) Comastri et al. 2010; (14) Risaliti et al. 1999; (15) Dewangan & Griffiths 2005;
(16) Piconcelli et al. 2007a; (17) Malaguti et al. 1998; (18) Guainazzi et al. 2005b; (19) Greenhill et al. 2008; (20) Awaki et al. 2000;
(21) Bianchi et al. 2008; (22) Levenson et al. 2001; (23) Shu et al. 2007;
(24) Gallo et al. 2006; (25) Evans et al. 2006; (26) Balestra et al. 2004;
(27) Iwasawa et al. 2001b
Notes: a: The column density of NGC 1275, which is at the center within the Perseus cluster, is difficult to measure: Evans et al. (2006)
do not find absorption in excess of the Galactic one based on Chandra data.
[Ne V] references: (1) Koski 1978; (2) Anderson 1970; (3) Erkens et al. 1997; (4) This work (based on the catalog of UV-optical spectra of nearby galaxies by Storchi-Bergmann et al., see text); (5) Durret & Bergeron 1988; (6) Durret & Bergeron 1986; (7) Shuder & Osterbrock 1981; (8) Morris & Ward 1988; (9) Shields & Filippenko 1990; (10) Ward et al. 1980; (11) Malkan 1986; (12) Osterbrock 1981a; (13) Moran et al. 1992; (14) Osterbrock & Miller 1975; (15) Fosbury & Sansom 1983.


![[Uncaptioned image]](/html/1005.0373/assets/x21.png)
![[Uncaptioned image]](/html/1005.0373/assets/x22.png)
![[Uncaptioned image]](/html/1005.0373/assets/x23.png)
![[Uncaptioned image]](/html/1005.0373/assets/x24.png)
![[Uncaptioned image]](/html/1005.0373/assets/x25.png)
![[Uncaptioned image]](/html/1005.0373/assets/x26.png)
![[Uncaptioned image]](/html/1005.0373/assets/x27.png)
![[Uncaptioned image]](/html/1005.0373/assets/x28.png)
References
- Alexander et al. (2008) Alexander, D. M., Chary, R., Pope, A., et al. 2008, ApJ, 687, 835
- Alexander et al. (2005) Alexander, D. M., Smail, I., Bauer, F. E., et al. 2005, Nature, 434, 738
- Anderson (1970) Anderson, K. S. 1970, ApJ, 162, 743
- Awaki et al. (2000) Awaki, H., Ueno, S., Taniguchi, Y., & Weaver, K. A. 2000, ApJ, 542, 175
- Balestra et al. (2004) Balestra, I., Bianchi, S., & Matt, G. 2004, A&A, 415, 437
- Ballantyne et al. (2006) Ballantyne, D. R., Everett, J. E., & Murray, N. 2006, ApJ, 639, 740
- Ballo et al. (2008) Ballo, L., Giustini, M., Schartel, N., et al. 2008, A&A, 483, 137
- Barth et al. (2004) Barth, A. J., Ho, L. C., Rutledge, R. E., & Sargent, W. L. W. 2004, ApJ, 607, 90
- Bassani et al. (1999) Bassani, L., Dadina, M., Maiolino, R., et al. 1999, ApJS, 121, 473
- Bianchi et al. (2003) Bianchi, S., Balestra, I., Matt, G., Guainazzi, M., & Perola, G. C. 2003, A&A, 402, 141
- Bianchi et al. (2008) Bianchi, S., Chiaberge, M., Piconcelli, E., Guainazzi, M., & Matt, G. 2008, MNRAS, 386, 105
- Bianchi et al. (2006) Bianchi, S., Guainazzi, M., & Chiaberge, M. 2006, A&A, 448, 499
- Bianchi et al. (2005) Bianchi, S., Guainazzi, M., Matt, G., et al. 2005, A&A, 442, 185
- Bianchi et al. (2009) Bianchi, S., Guainazzi, M., Matt, G., Fonseca Bonilla, N., & Ponti, G. 2009, A&A, 495, 421
- Bianchi et al. (2004) Bianchi, S., Matt, G., Balestra, I., Guainazzi, M., & Perola, G. C. 2004, A&A, 422, 65
- Blustin et al. (2002) Blustin, A. J., Branduardi-Raymont, G., Behar, E., et al. 2002, A&A, 392, 453
- Bongiorno et al. (2009) Bongiorno, A., Mignoli, M., Zamorani, G., et al. 2009, ArXiv e-prints
- Brandt & Hasinger (2005) Brandt, W. N. & Hasinger, G. 2005, ARA&A, 43, 827
- Cappi et al. (2006) Cappi, M., Panessa, F., Bassani, L., et al. 2006, A&A, 446, 459
- Cash (1979) Cash, W. 1979, ApJ, 228, 939
- Colless et al. (2001) Colless, M., Dalton, G., Maddox, S., et al. 2001, MNRAS, 328, 1039
- Comastri (2004) Comastri, A. 2004, in Astrophysics and Space Science Library, Vol. 308, Supermassive Black Holes in the Distant Universe, ed. A. J. Barger, 245–+
- Comastri et al. (2010) Comastri, A., Iwasawa, K., Gilli, R., et al. 2010, ApJ, submitted
- Corbett et al. (2003) Corbett, E. A., Croom, S. M., Boyle, B. J., et al. 2003, MNRAS, 343, 705
- Daddi et al. (2007) Daddi, E., Alexander, D. M., Dickinson, M., et al. 2007, ApJ, 670, 173
- Dahari & De Robertis (1988) Dahari, O. & De Robertis, M. M. 1988, ApJ, 331, 727
- D’Ammando et al. (2008) D’Ammando, F., Bianchi, S., Jiménez-Bailón, E., & Matt, G. 2008, A&A, 482, 499
- Della Ceca et al. (2008) Della Ceca, R., Severgnini, P., Caccianiga, A., et al. 2008, Memorie della Societa Astronomica Italiana, 79, 65
- Dewangan & Griffiths (2005) Dewangan, G. C. & Griffiths, R. E. 2005, ApJ, 625, L31
- Diamond-Stanic et al. (2009) Diamond-Stanic, A. M., Rieke, G. H., & Rigby, J. R. 2009, ApJ, 698, 623
- Dickey & Lockman (1990) Dickey, J. M. & Lockman, F. J. 1990, ARA&A, 28, 215
- Durret & Bergeron (1986) Durret, F. & Bergeron, J. 1986, A&A, 156, 51
- Durret & Bergeron (1988) Durret, F. & Bergeron, J. 1988, A&AS, 75, 273
- Elvis et al. (2009) Elvis, M., Civano, F., Vignali, C., et al. 2009, ApJS, 184, 158
- Erkens et al. (1997) Erkens, U., Appenzeller, I., & Wagner, S. 1997, A&A, 323, 707
- Evans et al. (2006) Evans, D. A., Worrall, D. M., Hardcastle, M. J., Kraft, R. P., & Birkinshaw, M. 2006, ApJ, 642, 96
- Ferland & Osterbrock (1986) Ferland, G. J. & Osterbrock, D. E. 1986, ApJ, 300, 658
- Fiore et al. (2008) Fiore, F., Grazian, A., Santini, P., et al. 2008, ApJ, 672, 94
- Fiore et al. (2009) Fiore, F., Puccetti, S., Brusa, M., et al. 2009, ApJ, 693, 447
- Fosbury & Sansom (1983) Fosbury, R. A. E. & Sansom, A. E. 1983, MNRAS, 204, 1231
- Franceschini et al. (2000) Franceschini, A., Bassani, L., Cappi, M., et al. 2000, A&A, 353, 910
- Gallo (2006) Gallo, L. C. 2006, MNRAS, 368, 479
- Gallo et al. (2005) Gallo, L. C., Balestra, I., Costantini, E., et al. 2005, A&A, 442, 909
- Gallo et al. (2006) Gallo, L. C., Lehmann, I., Pietsch, W., et al. 2006, MNRAS, 365, 688
- Gaskell & Benker (2007) Gaskell, C. M. & Benker, A. J. 2007, ArXiv e-prints
- Georgantopoulos et al. (2009) Georgantopoulos, I., Akylas, A., Georgakakis, A., & Rowan-Robinson, M. 2009, A&A, 507, 747
- Georgantopoulos et al. (2007) Georgantopoulos, I., Georgakakis, A., & Akylas, A. 2007, A&A, 466, 823
- Gilli et al. (2007) Gilli, R., Comastri, A., & Hasinger, G. 2007, A&A, 463, 79
- Gilli et al. (2000) Gilli, R., Maiolino, R., Marconi, A., et al. 2000, A&A, 355, 485
- Gliozzi et al. (2007) Gliozzi, M., Sambruna, R. M., Eracleous, M., & Yaqoob, T. 2007, ApJ, 664, 88
- Gondoin et al. (2003) Gondoin, P., Orr, A., & Lumb, D. 2003, A&A, 398, 967
- Grandi et al. (2006) Grandi, P., Malaguti, G., & Fiocchi, M. 2006, ApJ, 642, 113
- Greenhill et al. (2008) Greenhill, L. J., Tilak, A., & Madejski, G. 2008, ApJ, 686, L13
- Grupe et al. (2004) Grupe, D., Mathur, S., & Komossa, S. 2004, AJ, 127, 3161
- Guainazzi et al. (2005a) Guainazzi, M., Fabian, A. C., Iwasawa, K., Matt, G., & Fiore, F. 2005a, MNRAS, 356, 295
- Guainazzi et al. (2005b) Guainazzi, M., Matt, G., & Perola, G. C. 2005b, A&A, 444, 119
- Guainazzi et al. (1998) Guainazzi, M., Piro, L., Capalbi, M., et al. 1998, A&A, 339, 337
- Guainazzi et al. (2004) Guainazzi, M., Rodriguez-Pascual, P., Fabian, A. C., Iwasawa, K., & Matt, G. 2004, MNRAS, 355, 297
- Hardcastle et al. (2007) Hardcastle, M. J., Croston, J. H., & Kraft, R. P. 2007, ApJ, 669, 893
- Hopkins et al. (2006) Hopkins, P. F., Hernquist, L., Cox, T. J., et al. 2006, ApJS, 163, 1
- Hopkins et al. (2008) Hopkins, P. F., Hernquist, L., Cox, T. J., & Kereš, D. 2008, ApJS, 175, 356
- Iwasawa et al. (2001a) Iwasawa, K., Fabian, A. C., & Ettori, S. 2001a, MNRAS, 321, L15
- Iwasawa et al. (2001b) Iwasawa, K., Matt, G., Fabian, A. C., et al. 2001b, MNRAS, 326, 119
- Iwasawa et al. (2010) Iwasawa, K., Tanaka, Y., & Gallo, L. C. 2010, ArXiv e-prints
- Jiménez-Bailón et al. (2008) Jiménez-Bailón, E., Guainazzi, M., Matt, G., et al. 2008, in Revista Mexicana de Astronomia y Astrofisica, vol. 27, Vol. 32, Revista Mexicana de Astronomia y Astrofisica Conference Series, 131–133
- Kauffmann & Haehnelt (2000) Kauffmann, G. & Haehnelt, M. 2000, MNRAS, 311, 576
- Kewley et al. (2004) Kewley, L. J., Geller, M. J., & Jansen, R. A. 2004, AJ, 127, 2002
- Kim et al. (2006) Kim, M., Ho, L. C., & Im, M. 2006, ApJ, 642, 702
- Koski (1978) Koski, A. T. 1978, ApJ, 223, 56
- Kunth et al. (1987) Kunth, D., Sargent, W. L. W., & Bothun, G. D. 1987, AJ, 93, 29
- Lamastra et al. (2009) Lamastra, A., Bianchi, S., Matt, G., et al. 2009, A&A, 504, 73
- Landi et al. (2005) Landi, R., Malizia, A., & Bassani, L. 2005, A&A, 441, 69
- Landi et al. (2007) Landi, R., Masetti, N., Morelli, L., et al. 2007, ApJ, 669, 109
- Lavalley et al. (1992) Lavalley, M., Isobe, T., & Feigelson, E. 1992, in Astronomical Society of the Pacific Conference Series, Vol. 25, Astronomical Data Analysis Software and Systems I, ed. D. M. Worrall, C. Biemesderfer, & J. Barnes, 245–+
- Levenson et al. (2001) Levenson, N. A., Weaver, K. A., & Heckman, T. M. 2001, ApJ, 550, 230
- Lilly et al. (2007) Lilly, S. J., Le Fèvre, O., Renzini, A., et al. 2007, ApJS, 172, 70
- Lilly et al. (2009) Lilly, S. J., LeBrun, V., Maier, C., et al. 2009, ApJS, 184, 218
- Maiolino et al. (1998) Maiolino, R., Salvati, M., Bassani, L., et al. 1998, A&A, 338, 781
- Malaguti et al. (1998) Malaguti, G., Palumbo, G. G. C., Cappi, M., et al. 1998, A&A, 331, 519
- Malizia et al. (2009) Malizia, A., Stephen, J. B., Bassani, L., et al. 2009, MNRAS, 399, 944
- Malkan (1986) Malkan, M. A. 1986, ApJ, 310, 679
- Marconi et al. (2004) Marconi, A., Risaliti, G., Gilli, R., et al. 2004, MNRAS, 351, 169
- Martínez-Sansigre et al. (2005) Martínez-Sansigre, A., Rawlings, S., Lacy, M., et al. 2005, Nature, 436, 666
- Marulli et al. (2008) Marulli, F., Bonoli, S., Branchini, E., Moscardini, L., & Springel, V. 2008, MNRAS, 385, 1846
- Matt et al. (2004) Matt, G., Bianchi, S., D’Ammando, F., & Martocchia, A. 2004, A&A, 421, 473
- Moran et al. (1992) Moran, E. C., Halpern, J. P., Bothun, G. D., & Becker, R. H. 1992, AJ, 104, 990
- Morris & Ward (1988) Morris, S. L. & Ward, M. J. 1988, MNRAS, 230, 639
- Murphy et al. (2007) Murphy, K. D., Yaqoob, T., & Terashima, Y. 2007, ApJ, 666, 96
- Osterbrock (1981a) Osterbrock, D. E. 1981a, ApJ, 249, 462
- Osterbrock (1981b) Osterbrock, D. E. 1981b, ApJ, 246, 696
- Osterbrock et al. (1976) Osterbrock, D. E., Koski, A. T., & Phillips, M. M. 1976, ApJ, 206, 898
- Osterbrock & Miller (1975) Osterbrock, D. E. & Miller, J. S. 1975, ApJ, 197, 535
- Osterbrock & Pogge (1985) Osterbrock, D. E. & Pogge, R. W. 1985, ApJ, 297, 166
- Panessa et al. (2006) Panessa, F., Bassani, L., Cappi, M., et al. 2006, A&A, 455, 173
- Piconcelli et al. (2007a) Piconcelli, E., Bianchi, S., Guainazzi, M., Fiore, F., & Chiaberge, M. 2007a, A&A, 466, 855
- Piconcelli et al. (2007b) Piconcelli, E., Fiore, F., Nicastro, F., et al. 2007b, A&A, 473, 85
- Piconcelli et al. (2005) Piconcelli, E., Jimenez-Bailón, E., Guainazzi, M., et al. 2005, A&A, 432, 15
- Ponti et al. (2004) Ponti, G., Cappi, M., Dadina, M., & Malaguti, G. 2004, A&A, 417, 451
- Ptak et al. (2006) Ptak, A., Zakamska, N. L., Strauss, M. A., et al. 2006, ApJ, 637, 147
- Puccetti et al. (2009) Puccetti, S., Vignali, C., Cappelluti, N., et al. 2009, ArXiv e-prints
- Reyes et al. (2008) Reyes, R., Zakamska, N. L., Strauss, M. A., et al. 2008, AJ, 136, 2373
- Rigby et al. (2009) Rigby, J. R., Diamond-Stanic, A. M., & Aniano, G. 2009, ApJ, 700, 1878
- Risaliti et al. (2000) Risaliti, G., Gilli, R., Maiolino, R., & Salvati, M. 2000, A&A, 357, 13
- Risaliti et al. (1999) Risaliti, G., Maiolino, R., & Salvati, M. 1999, ApJ, 522, 157
- Sambruna et al. (2007) Sambruna, R. M., Reeves, J. N., & Braito, V. 2007, ApJ, 665, 1030
- Schmidt et al. (1998) Schmidt, M., Hasinger, G., Gunn, J., et al. 1998, A&A, 329, 495
- Schmitt (1998) Schmitt, H. R. 1998, ApJ, 506, 647
- Scoville et al. (2007) Scoville, N., Aussel, H., Brusa, M., et al. 2007, ApJS, 172, 1
- Shankar et al. (2004) Shankar, F., Salucci, P., Granato, G. L., De Zotti, G., & Danese, L. 2004, MNRAS, 354, 1020
- Shields & Filippenko (1990) Shields, J. C. & Filippenko, A. V. 1990, AJ, 100, 1034
- Shinozaki et al. (2006) Shinozaki, K., Miyaji, T., Ishisaki, Y., Ueda, Y., & Ogasaka, Y. 2006, AJ, 131, 2843
- Shu et al. (2007) Shu, X. W., Wang, J. X., Jiang, P., Fan, L. L., & Wang, T. G. 2007, ApJ, 657, 167
- Shuder & Osterbrock (1981) Shuder, J. M. & Osterbrock, D. E. 1981, ApJ, 250, 55
- Silverman et al. (2009) Silverman, J. D., Lamareille, F., Maier, C., et al. 2009, ApJ, 696, 396
- Spinelli et al. (2006) Spinelli, P. F., Storchi-Bergmann, T., Brandt, C. H., & Calzetti, D. 2006, ApJS, 166, 498
- Storchi-Bergmann et al. (1995) Storchi-Bergmann, T., Kinney, A. L., & Challis, P. 1995, ApJS, 98, 103
- Thornton et al. (2008) Thornton, C. E., Barth, A. J., Ho, L. C., Rutledge, R. E., & Greene, J. E. 2008, ApJ, 686, 892
- Tozzi et al. (2006) Tozzi, P., Gilli, R., Mainieri, V., et al. 2006, A&A, 451, 457
- Treister et al. (2009a) Treister, E., Cardamone, C. N., Schawinski, K., et al. 2009a, ApJ, 706, 535
- Treister et al. (2009b) Treister, E., Urry, C. M., & Virani, S. 2009b, ApJ, 696, 110
- Tueller et al. (2008) Tueller, J., Mushotzky, R. F., Barthelmy, S., et al. 2008, ApJ, 681, 113
- Urrutia et al. (2005) Urrutia, T., Lacy, M., Gregg, M. D., & Becker, R. H. 2005, ApJ, 627, 75
- Vanden Berk et al. (2001) Vanden Berk, D. E., Richards, G. T., Bauer, A., et al. 2001, AJ, 122, 549
- Vasudevan & Fabian (2007) Vasudevan, R. V. & Fabian, A. C. 2007, MNRAS, 381, 1235
- Vaughan et al. (2004) Vaughan, S., Fabian, A. C., Ballantyne, D. R., et al. 2004, MNRAS, 351, 193
- Vaughan et al. (1999) Vaughan, S., Reeves, J., Warwick, R., & Edelson, R. 1999, MNRAS, 309, 113
- Vignali et al. (2006) Vignali, C., Alexander, D. M., & Comastri, A. 2006, MNRAS, 373, 321
- Vignali et al. (2010) Vignali, C., Alexander, D. M., Gilli, R., & Pozzi, F. 2010, MNRAS, 404, 48 (V10)
- Vignali et al. (2004) Vignali, C., Brandt, W. N., Boller, T., Fabian, A. C., & Vaughan, S. 2004, MNRAS, 347, 854
- Vignali & Comastri (2002) Vignali, C. & Comastri, A. 2002, A&A, 381, 834
- Ward et al. (1980) Ward, M., Penston, M. V., Blades, J. C., & Turtle, A. J. 1980, MNRAS, 193, 563
- Wilkes et al. (2005) Wilkes, B. J., Pounds, K. A., Schmidt, G. D., et al. 2005, ApJ, 634, 183
- Wilkes et al. (2002) Wilkes, B. J., Schmidt, G. D., Cutri, R. M., et al. 2002, ApJ, 564, L65
- Winkler (1992) Winkler, H. 1992, MNRAS, 257, 677
- Young et al. (2009) Young, M., Elvis, M., & Risaliti, G. 2009, ApJS, 183, 17 (Y09)
- Zakamska et al. (2003) Zakamska, N. L., Strauss, M. A., Krolik, J. H., et al. 2003, AJ, 126, 2125