X-ray gaseous emission in the galaxy M82
Abstract
The main results from a deep X-ray observation of M82 are summarised: spatially-dependent chemical abundances, temperature structure of the gas, charge-exchange emission lines in the spectrum. We also present an update of the chemical abundances, based on a more refined extraction of spectra.
Keywords:
galaxies: individual: M82 – galaxies: abundances – X-rays: ISM – plasmas – atomic processes.:
98.35.Nq; 98.38.Am; 98.38.Bn1 Introduction
| N5 | N4 | N3 | N2 | N1 | centre | S1 | S2 | S3 | S4 | S5 | |
|---|---|---|---|---|---|---|---|---|---|---|---|
| Normalisation () | 0.079 | 0.24 | 0.50 | 0.41 | 0.85 | 27 | 1.7 | 0.92 | 0.20 | 0.099 | 0.047 |
| Volume (kpc3) | 0.61 | 1.2 | 1.1 | 0.43 | 0.41 | 1.4 | 0.24 | 0.35 | 0.26 | 0.21 | 0.22 |
| Density ( cm-3) | 3.3 | 4.8 | 7.1 | 10 | 32 | 20 | 12 | 6.4 | 5.1 | 3.3 | |
| Pressure ( dine cm-2) | 3.5 | 5.7 | 10 | 18 | 54 | 32 | 19 | 9.2 | 6.1 | 3.6 | |
| Mass ( M⊙) | 0.99 | 1.3 | 0.76 | 1.1 | 11 | 1.1 | 1.0 | 0.42 | 0.26 | 0.19 | |
| Energy ( erg) | 1.9 | 2.9 | 1.9 | 3.2 | 33 | 3.3 | 2.9 | 1.1 | 0.56 | 0.36 | |
| Energy density ( erg cm-3) | 5.3 | 8.6 | 15 | 27 | 81 | 48 | 28 | 14 | 9.2 | 5.4 | |
| Cooling time (Myr) | 500 | 380 | 360 | 300 | 100 | 150 | 250 | 400 | 380 | 490 |
We performed a very deep (100 ks) observation of the starburst galaxy M82 with the EPIC and RGS instruments on-board XMM-Newton. The analysis has been published in Ranalli et al. (2008); we refer for any detail to that paper. A brief summary of the main results is presented in the following.
M82 has a large and luminous outflow, extending for several kpc out of both sides of the galaxy plane. On the sky, it extends for about 10 arcmin. A good-quality spectrum was obtained with the RGS instrument. However, the main difficulty in analysing X-ray grating spectra from extended sources is the dependence of the line-spread-function from the spatial shape of the source. The rgsxsrc model which convolves the spectral response with the shape of the source was essential to this analysis. Also, the parts of the outflow which lie inside of the galactic disc are heavily absorbed: thus the outflow appears with a different shape at different energies. For this reason, we had to analyse separately the long- (18–30 Å) and short-wavelength (6-18 Å) regions of the spectrum.
The EPIC instrument allowed the spatially-resolved spectroscopy of the outflow, albeit at a lower resolution than RGS. The outflow was divided in eleven slices, each one parallel to the galactic plane, and spectra were extracted and analysed for each slice, deriving the temperature structure, abundances, and physical parameters of the plasma.
Finally, we publish here update figures and table: we refined the extraction regions, after discovering that the regions used for spectral extractions in Ranalli et al. (2008) were actually larger than intended. No significant change in any conclusion or derived value has occurred.
2 Main results
At least three spectral components are present in the broad-band spectrum: i) continuum emission from point sources; ii) thermal plasma emission from hot gas; iii) charge exchange emission from neutral metals (Mg and Si).
The chemical absolute abundances of the thermal plasma depend on the distance from the galactic plane: they are larger in the outskirts and smaller close to the galaxy centre. The abundance ratios also show spatial variations (see below). This might be due to the dependence of supernova (SN) yields on the progenitor mass, if the matter expelled by the first SN in a star formation burst is also the first one to travel out of the galactic plane. It may also be a clear example of metals being pushed in the inter-galactic medium.
The X-ray derived Oxygen abundance is lower than that measured in the atmospheres of red supergiant stars, leading to the hypothesis that a significant fraction of Oxygen ions has already cooled off and no longer emits at energies keV.
Two lines were found in the EPIC and RGS spectra, significant at a confidence level , which may be attributed to charge-exchange (CE) emissionChamberlain (1956) . A third one was found in the EPIC spectra only. The RGS spectrum of the O VII He-like triplet is consistent with CE emission, but not with a thermal origin. The CE process is usually observed in cometary and planetary emission, and it is due to the interaction of an energetic ion with a dust grain. It might also be one of the cooling channels for O ions.
The differential emission measure (DEM) of the thermal plasma was found to have a bimodal structure, with one peak around 0.5 keV and slightly dependent on the distance from the galactic plane, and another peak around 6 keV. The currently favoured explanation for the double-peaked structure is the Masai model for plasma emission Masai et al. (2002); Dogiel et al. (2002): if the plasma emission occurs in the same region where particle are accelerated, then the electron energy distribution is not fully thermal, and the spectrum emitted by the non-thermal part has a defined spectral shape which can be fitted as a higher-temperature plasma. Another possible explanation —that the keV plasma is actually non-thermal emission from unresolved point sources— is difficult to explain, because it would require a sizable population of point sources lying many kpc above the galactic plane.
3 Spatially-dependent chemical abundances
We defined 11 regions in the outflow of M82, slicing it parallel to the galactic plane. In the figures, negative and positive heights above the galactic plane are assigned to the northern and southern regions, respectively. The spectral model was a multi-temperature APEC plasma, with temperatures ranging from 0.1 to 10 keV. Point sources were excluded from all spectral regions except the galaxy centre, where their contribution was added to the model in the form of an absorbed power-law. The best-fitting abundances are shown in Fig. 1 (left panels) along with results from infrared observations for the central regions Origlia et al. (2004) which show the abundances of stars born before the start of the current burst. Lighter -elements are more concentrated in the outflow than in the centre. This effect is larger for elements with lower atomic mass, becomes less evident for Si and reverses for S. The centre/outskirt abundance ratio in the centre is about for O and Ne. Fe is also more concentrated in the outflow.
The abundances ratios (Fig. 1 right panel) have smaller variations, and present different trends for light and massive elements: while the O/Fe and Ne/Fe ratios are lower in the centre than in the outskirts, the opposite holds for Si/Fe and S/Fe, with Mg/Fe being an intermediate case showing no variation. The scatter between values for centre and outskirts is a factor .
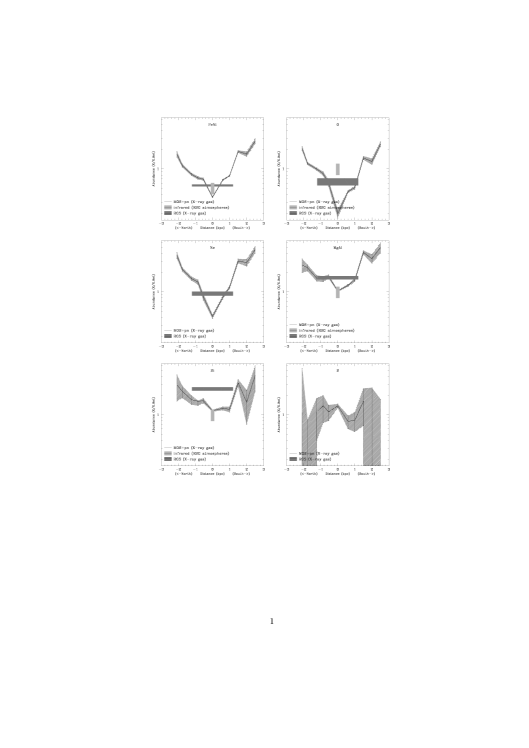

Right panel: Abundance ratios (X/Fe) observed in EPIC spectra of the outflow. Negative values of height refer to the north direction, positive values to south.
The physical parameters of the plasma may be obtained from the best-fitting temperature and normalisation of the model, with some assumptions about the volume and filling factor. From Table 1, one may see that the gas density and pressure decrease by a factor of from the centre to the outskirts, while the cooling time increases.
References
- Ranalli et al. (2008) P. Ranalli, A. Comastri, L. Origlia, and R. Maiolino, MNRAS 386, 1464–1480 (2008).
- Chamberlain (1956) J. W. Chamberlain, ApJ 124, 390–+ (1956).
- Masai et al. (2002) K. Masai, V. A. Dogiel, H. Inoue, V. Schönfelder, and A. W. Strong, ApJ 581, 1071–1079 (2002).
- Dogiel et al. (2002) V. A. Dogiel, H. Inoue, K. Masai, V. Schönfelder, and A. W. Strong, ApJ 581, 1061–1070 (2002).
- Origlia et al. (2004) L. Origlia, P. Ranalli, A. Comastri, and R. Maiolino, ApJ 606, 862–868 (2004).