11
P. Ranalli
The evolution of star forming galaxies with the Wide Field X-ray Telescope
Abstract
Star forming galaxies represent a small yet sizable fraction of the X-ray sky (–, depending on the flux). X-ray surveys allow to derive their luminosity function and evolution, free from uncertainties due to absorption. However, much care must be put in the selection criteria to build samples clean from contamination by AGN. Here we review the possibilities offered by the proposed WFXT mission for their study. We analyze the expected luminosity and redshift distributions of star forming galaxies in the proposed WFXT surveys. We discuss the impact of such a mission on the knowledge of the cosmic star formation history, and provide a few suggestions.
keywords:
X-rays: galaxies – galaxies: luminosity function – galaxies: evolution – galaxies: high-redshift – galaxies: spiral1 Introduction
The X-ray luminosity of star forming galaxies (SFG; they usually are spiral galaxies without AGN activity) appears to be a reliable, absorption-free estimator of star formation (Ranalli et al., 2003). This is justified on the basis that the X-ray luminosities are linearly and tightly correlated with the radio and FIR ones, which in turn are commonly used as star formation rate (SFR) indicators. Thus, the X-ray emission of SFG may be considered as a tool to investigate the cosmic star formation history. To this end, the study of the X-ray luminosity function (XLF) of galaxies and of its evolution represents a necessary step. Ranalli et al. (2005, hereafter RCS05) built a local () XLF of SFG and investigated the possibilities for evolution. In this paper, we build on the RCS05 XLF and methods to explore the possible contribution of the Wide Field X-ray Telescope (WFXT) mission to our understanding of the SFG content of the universe, by analyzing the expected luminosity and redshift distributions.
The WFXT is a proposed mission which aims to perform very wide and moderately deep X-ray surveys. By taking a different approach to mirror design than the classical Wolter type-1 (Burrows et al., 1992), it could achieve a very large field of view ( deg2) while maintaining a good angular resolution () and a large effective area ( m2) in the 0.1-7 keV band (Conconi et al., 2010).
| wide | medium | deep | |
|---|---|---|---|
| area | 20000 | 3000 | 100 |
| flux (req.) | |||
| flux (goal) |
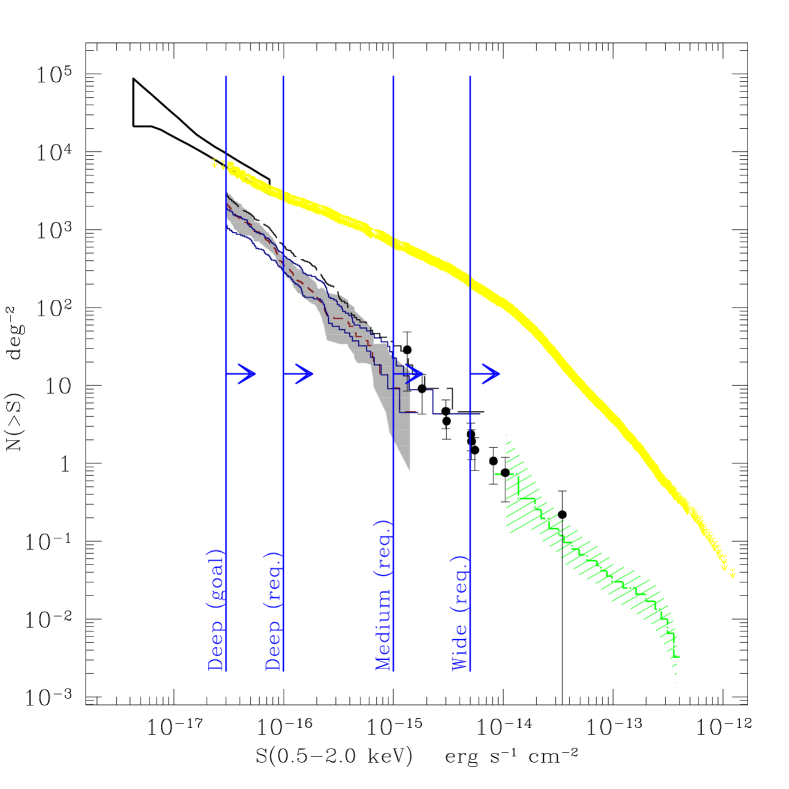
Such a telescope would be able to observe a number of X-ray sources far exceeding all those known today. While X-ray surveys mainly detect AGN, star-forming galaxies (SFG) are also present, comprising a fraction in the range 1%–20% (depending on the flux) of all the sources detected in the 0.5–2.0 keV band. Three major surveys are envisaged with the WFXT, covering different amounts of the sky at different limiting fluxes and named wide, medium and deep (Fig 1). Their limiting soft X-ray fluxes correspond broadly to those probed in ROSAT (Tajer et al., 2005), XMM-Newton (Georgakakis et al., 2004) and deep Chandra (Bauer et al., 2004; Norman et al., 2004, RCS05) surveys of SFG. In Fig. 1 we show the total Log –Log from X-ray surveys, and different estimates of the SFG number counts.
Depending on technological developments, both a requirement and a goal value for the limiting fluxes can be quoted. Reaching the goals could extend the number of detected objects by a factor . However, given the early stage of the mission, here we will consider only the requirements, and regard the goal flux limit for the deep survey only.
We assume km s-1 Mpc-1, and .
2 The LF and evolution of star-forming galaxies
The local differential luminosity function
| (1) |
is defined as the comoving number density of sources per logarithmic luminosity interval. The evolution can be described as pure luminosity with the form (Schmidt, 1972)
| (2) |
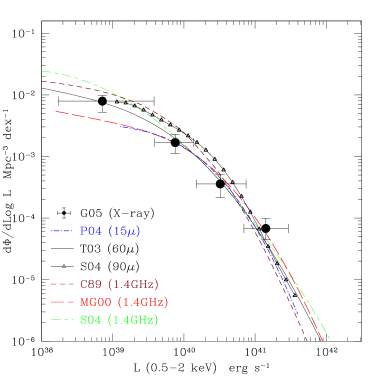
Infrared surveys provide a powerful method to select SFG, since the bulk of the far and near IR emission is due to reprocessed light from star formation, with AGN representing only a minor population (de Jong et al., 1984; Franceschini et al., 2001; Elbaz et al., 2002). The FIR LFs may be assumed to be essentially unaffected by a contribution from Seyfert galaxies, as the fraction of Seyferts is about –10% (RCS05). While many determinations of IR LFs exist (see references in RCS05), here we take Takeuchi et al. (2003, 2004, hereafter T03) as reference. This is a 60 LF derived from the IRAS Point Source Catalog Redshift (Saunders et al., 2000) (PSC). It includes 15,411 galaxies with , covering 84% of the sky with a flux limit of 0.6 mJy at . While T03 reports pure-density evolution for their LF, pure-luminosity may provide an equally good fit to the data (T. Takeuchi, priv. comm.).
Other determinations of the SFG LF have been derived by the cross correlation of radio surveys with optical ones (see references in RCS05). The redshifts covered in these surveys are similar to those of the T03 galaxies, but the number of objects is smaller due to a smaller sky coverage, so reliable estimates of the evolution may not be derived.
The local IR or radio LFs may be converted to X-ray ones by using the approach first developed in Avni & Tananbaum (1986) (see also: Georgantopoulos et al. 1999; Norman et al. 2004), which may be summarised as follows. Given a galaxy with IR or radio luminosity , let be the probability distribution of the possible values of the galaxy’s X-ray luminosity , as given by the optical/IR/radio vs. X-ray correlations. Thus, the X-ray LF may be otained by the convolution of an optical/IR/radio LF with . In Ranalli et al. (2003) it was reported that the X-ray luminosity is tightly correlated with radio and FIR luminosities. By assuming a Gaussian probability distribution for these correlations, one has for example
| (3) |
with .
A clear prediction for a XLF emerges from the comparison of the infrared and radio LFs (Fig. 2, left panel): the derived XLFs agree within a factor of 2 in the luminosity interval – erg s-1, encompassing the knee region after which all XLFs steepen toward higher luminosities; although departures at lower and higher luminosities are present, the average local X-ray luminosity density, erg s-1 Mpc-1, appears to be well defined.
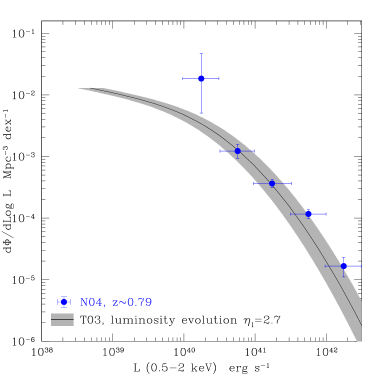
Norman et al. (2004) derived an XLF at higher redshifts (two bins: and ; Fig. 2, right panel) than those probed by the IR and radio surveys discussed above. Other strong constraints at high redshift come from the COMBO-17 survey (Wolf et al., 2003), and from the comparison of the observed X-ray Log –Log with that derived by integrating the XLF. This work has been done in detail in RCS05, and here we just quote the results: the evolution is well described as pure-luminosity with an exponent , with possibly an hint that the evolution could be stopped at (Fig. 2, right panel).
3 Expected luminosity and redshift distributions with the WFXT
The XLF derived in the previous section can be integrated in the volume of space probed by the surveys to obtain luminosity distributions
| (4) |
and redshift distributions
| (5) |
where ; is the limiting flux of the survey; is the comoving volume at redshift ; and is the comoving volume at the redshift at which a source with luminosity is observed with flux . All fluxes are considered in the 0.5–2.0 keV band.
For the following calculations, we take , , , erg s-1 and erg s-1. In words, this means that we integrate on the luminosity range (at ) – erg s-1, that we allow the maximum luminosity to evolve with redshift, that we exclude luminosities lower than what could visible given the redshift and limiting flux, and that the integration is done up to but stopping the evolution at . The evolution is pure-luminosity as in Eq. (2) with .


The luminosity distribution is shown in Fig. 3, both in cumulative (left panel) and differential form (right panel). The cumulative form immediately shows the total number of SFG which are expected to be detected in the WFXT surveys (– objects per survey). Reaching the development goal would enhance the number of SFG by a factor of , up to objects in the deep survey.
It is important to check that the SFG XLF will be well sampled at all luminosities. From Fig. 3 it is evident that at least SFG with erg s-1 should be detected in the medium and deep surveys, and that the “knee” region of the XLF (the range – erg s-1 at , compare with Fig. 2) will be very well sampled with around objects in each of the medium and deep surveys. Similarly, the high luminosity tail ( erg s-1) will also be well sampled with around objects in the medium survey. This part of the XLF is especially important because objects in this luminosity range are quite rare, and generally suspected of having a substantial part of their emission due to an AGN. Refined classification criteria, and the possibility of doing spectral analysis will clearly be essential.
Reaching the development goal will enlarge the sample of SFG with erg s-1 by a factor of , while it should not make much difference for brighter objects.
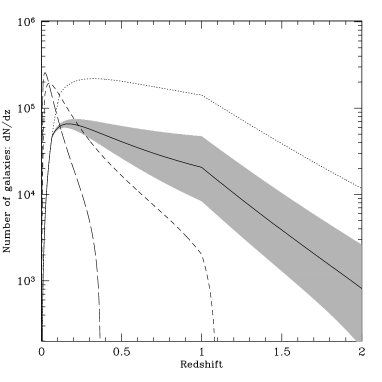
The expected redshift distribution is shown in Fig. 4 (left panel). The wide and medium surveys should have redshift peaks around and 0.05, respectively. Both will provide sizable samples at larger redshift: in the range for the wide survey, and in the range for the medium. The deep survey will probe much higher redshifts: objects with , and other with ; these numbers would also be larger by a factor of , if the development goal is reached. The uncertainties on the SFG evolution are illustrated by the grey area in Fig. 4 (left panel), whose upper and lower edges correspond to evolution with and 2.0, respectively.
However, it is likely that the highest redshift objects will also have the larger luminosities. Thus it is reasonable to ask up to which redshift will the knee of the XLF be probed. The local XLF exhibits its knee in the range – erg s-1 (Fig. 2), thus we repeated the integration in Eq. (3) taking erg s-1. The result is shown in Fig. 4 (right panel). The wide and medium surveys will not probe the knee of the XLF at redshift larger than and , respectively. The deep survey will extend the probed redshift range up to , while if the development goal is reached, redshifts as large as could be observed.
4 Discussion
From the expected luminosity and redshift distributions, it is evident that the WFXT will be able to determine the SFG XLF with an accuracy comparable to that of IRAS or optical surveys. Thus there will be many new possibilities to study how the X-ray emission depends on other parameters, such as morphology, colours, redshift, etc. However, such a work could only be made if multiwavelength information is available. In fact, the first and most important task will be the selection of the SFG, which are a minor fraction of the total of X-ray surveys. Several different combinations of the same basic parameters (X-ray luminosity, X-ray/optical flux ratio, hardness ratio, amount of absorption, presence of broad lines in optical spectra, etc.) have been explored by different authors in deep Chandra surveys (RCS05, and references therein). All the determinations differ by up to a factor of ; this scatter can be reduced only with a better understanding of how these parameters are linked to each other, and how they affect the selection (and the completeness of samples) of SFG. This only gets more difficult for wide-and-shallow surveys (respect to deep pencil-beam ones) because the SFG/AGN fraction in X-ray surveys depends on the limiting flux (Fig. 1). An attempt to investigate this problem for a sample of SFG in the Chandra-COSMOS survey (Elvis et al., 2009) may be found in Ranalli et al. (2010, to be submitted). One of its main results is that no rigid boundaries on the selection parameters can be put; a sensible approach should build on statistical methods for object classification.
The need for the most complete multiwavelength coverage also requires that the choice of the sky areas covered by the WFXT surveys be coordinated with (or follow, if not possible otherwise) other present and future survey facilities (Pan-Starrs, the Large Synoptical Survey Telescope, ALMA, LOFAR, E-VLA, etc.).
The planned WFXT surveys will be able to derive the SFG XLF and determine its evolution with unprecedented accuracy up to (1.1 if the development goals are reached) in the knee region, and up to (2.5) for the high-luminosity tail. Since the cosmic star formation history as a peak in the range , it is evident that the goals should be pursued with strong commitment. The cosmic accretion history has a peak at a similar redshift, and the two phenomena seem to have shared a very similar trend. Thus, the larger the probed redshift range, the more impact the WFXT will have for studies of SFG and AGN coevolution.
Finally, were the goals reached, and the numbers still on the safe side of the confusion limit, some ultra-deep pointings should be considered as very profitable. E.g., observing an area of 10 deg2 with a limiting flux of erg s-1 cm-2 would extend the coverage of the knee of the XLF up to , and of the high-luminosity tail up to redshifts well beyond the peak of the cosmic star formation history.
Acknowledgements.
We thank Roberto Gilli and Andrea Comastri for stimulating discussions.References
- Avni & Tananbaum (1986) Avni, Y. & Tananbaum, H. 1986, ApJ, 305, 83
- Bauer et al. (2004) Bauer, F. E., Alexander, D. M., Brandt, W. N., et al. 2004, AJ, 128, 2048
- Burrows et al. (1992) Burrows, C. J., Burg, R., & Giacconi, R. 1992, ApJ, 392, 760
- Conconi et al. (2010) Conconi, P., Campana, S., Tagliaferri, G., et al. 2010, MNRAS, 509
- de Jong et al. (1984) de Jong, T., Clegg, P. E., Rowan-Robinson, M., et al. 1984, ApJ, 278, L67
- Elbaz et al. (2002) Elbaz, D., Cesarsky, C. J., Chanial, P., et al. 2002, A&A, 384, 848
- Elvis et al. (2009) Elvis, M., Civano, F., Vignali, C., et al. 2009, ApJS, 184, 158
- Franceschini et al. (2001) Franceschini, A., Aussel, H., Cesarsky, C. J., Elbaz, D., & Fadda, D. 2001, A&A, 378, 1
- Georgakakis et al. (2004) Georgakakis, A. E., Georgantopoulos, I., Basilakos, S., Plionis, M., & Kolokotronis, V. 2004, MNRAS, 354, 123
- Georgantopoulos et al. (1999) Georgantopoulos, I., Basilakos, S., & Plionis, M. 1999, MNRAS, 305, L31
- Georgantopoulos et al. (2005) Georgantopoulos, I., Georgakakis, A., & Koulouridis, E. 2005, MNRAS, 360, 782
- Miyaji & Griffiths (2002) Miyaji, T. & Griffiths, R. E. 2002, ApJ, 564, L5
- Moretti et al. (2003) Moretti, A., Campana, S., Lazzati, D., & Tagliaferri, G. 2003, ApJ, 588, 696
- Norman et al. (2004) Norman, C., Ptak, A., Hornschemeier, A., et al. 2004, ApJ, 607, 721
- Ranalli et al. (2003) Ranalli, P., Comastri, A., & Setti, G. 2003, A&A, 399, 39
- Ranalli et al. (2005) Ranalli, P., Comastri, A., & Setti, G. 2005, A&A, 440, 23
- Saunders et al. (2000) Saunders, W., Sutherland, W. J., Maddox, S. J., et al. 2000, MNRAS, 317, 55
- Schmidt (1972) Schmidt, M. 1972, ApJ, 176, 273
- Tajer et al. (2005) Tajer, M., Trinchieri, G., Wolter, A., et al. 2005, A&A, 435, 799
- Takeuchi et al. (2003) Takeuchi, T. T., Yoshikawa, K., & Ishii, T. T. 2003, ApJ, 587, L89
- Takeuchi et al. (2004) Takeuchi, T. T., Yoshikawa, K., & Ishii, T. T. 2004, ApJ, 606, L171
- Wolf et al. (2003) Wolf, C., Meisenheimer, K., Rix, H.-W., et al. 2003, A&A, 401, 73