Pair Decay Width of the Hoyle State and its Role for Stellar Carbon Production
Abstract
The pair decay width of the first excited state in 12C (the Hoyle state) is deduced from a novel analysis of the world data on inelastic electron scattering covering a wide momentum transfer range, thereby resolving previous discrepancies. The extracted value eV is independently confirmed by new data at low momentum transfers measured at the S-DALINAC and reduces the uncertainty of the literature values by more than a factor of three. A precise knowledge of is mandatory for quantitative studies of some key issues in the modeling of supernovae and of asymptotic giant branch stars, the most likely site of the slow-neutron nucleosynthesis process.
pacs:
23.20.Ra, 25.30.Dh, 26.20.Fj, 27.20.+nThe production of the most abundant stable carbon isotope 12C in the center of stars proceeds through the fusion of three particles (the triple- process). Its reaction rate is of critical significance for a variety of key problems of nuclear astrophysics ref:Fynbo2005 like the elemental abundance in the universe ref:Wallerstein1997 , the size of the iron core in massive stars determining the properties of supernova explosions ref:Austin2005 ; ref:Tur2007 , the dynamics of asymptotic giant branch (AGB) stars ref:Herwig2006 , the site of the main slow-neutron capture process (-process) of heavy elements ref:Kappeler1998 , or the weak -process in massive stars ref:Tur2009 .
Under most astrophysical conditions the reaction exclusively proceeds through a scattering resonance of three -particles that represents an excited state in 12C with quantum numbers at an excitation energy MeV (the so-called Hoyle state ref:Hoyle1954 ), which then decays to the stable ground state. The reaction rate of the resonant triple- process is proportional to the radiative decay width of the Hoyle state. Although this state is experimentally studied for more than 50 years, at present is known with an uncertainty of about 12% only. However, an accuracy of about % is requested for applications in astrophysics ref:Austin2005 ; ref:Herwig2006 .
Experimentally the radiative width cannot be accessed directly but is determined as a product of quantities
| (1) |
measured in different experiments. Here, is the total decay width taking into account , and decays of the Hoyle state. Whereas the first quantity on the right-hand side of Eq. (1) has been precisely determined with an uncertainty of 2.7% (see Ref. ref:Markham1976 and refs. therein), the branching ratio is known with an error of 9.2% only (see Ref. ref:Alburger1977 and refs. therein). However, a new measurement of with an expected precision of about 5% is currently underway ref:Austinprivcomm .
The pair decay width in Eq. (1) can be determined by inelastic electron scattering through the relation ref:Wilkinson1969
| (2) |
where , denotes the fine structure constant and the matrix element of the monopole transition. The energy-dependent correction term is given in Tab. 1 of Ref. ref:Wilkinson1969 (0.898 for the present case). The influence of the nuclear Coulomb field is taken into account by the factor and amounts to 1.013 for the Hoyle state. The reduced transition probability is the largest known for excitation of a single state ref:kibedi2005 and exhausts about 7.5% of the energy-weighted sum rule.
Two values were extracted from measurements at low momentum transfers with a so-called ’model-independent’ analysis ref:Crannell1967 ; ref:Strehl1970 in the distorted wave Born approximation (DWBA) explained in detail below. They agree well with each other and an averaged value eV is quoted in Ref. ref:Ajzenberg-Selove1990 . Alternatively, a Fourier-Bessel analysis ref:Heisenberg1981 of the transition form factor including data over a wide momentum transfer range has recently been done by Crannell et al. ref:Crannell2005 . The extracted value of eV has an error of 2.7% only, but the low- result deviates by about 6.
To resolve this discrepancy we have performed a new high-resolution electron scattering experiment at low momentum transfer and reinvestigated both approaches. A novel model-independent ansatz was developed to analyze the global form factor. This provides not only a precise determination of the pair width but also an important test of current models for the structure of the Hoyle state ref:Chernykh2007 , which represents a prime example of an -cluster state predicted to possess the features of a low-density gas of particles resembling a Bose-Einstein condensate ref:Tohsaki2001 . As shown in Ref. ref:Chernykh2007 , state-of-the-art models describe the form factor quite well over a broad momentum transfer range but predict a monopole matrix element (directly related to ) about 20% too large (cf. Table I in ref:Chernykh2007 ). The present very precise results confirm this discrepancy and provide new insight into its origin.
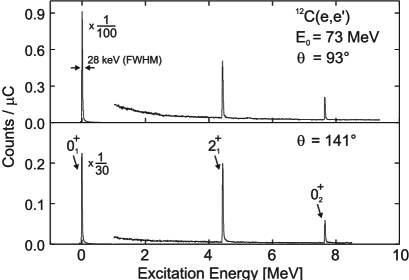
The experiment was carried out at the high energy-resolution magnetic spectrometer ref:lenhardt2006 of the Darmstadt superconducting electron linear accelerator S-DALINAC. Excitation energy spectra were taken at initial electron energies between 29 MeV and 78 MeV and scattering angles from 69∘ to 141∘ with beam currents of about 1 A. The momentum transfer range for the excitation of the Hoyle state varied thus between 0.21 fm-1 and 0.66 fm-1. A self-supporting carbon target (98.9% 12C) with an areal density of 6.4 mg/cm2 was used. In dispersion-matching mode an energy resolution E 28 keV (full width at half maximum, FWHM) was achieved. Examples of spectra at a beam energy of 73 MeV are presented in Fig. 1. The peaks correspond to the elastic line, the state and the Hoyle state in 12C.
As the form factor is the Fourier transform of the density, it corresponds to a cross section calculated in plane wave Born approximation (PWBA). The measured cross section, however, corresponds to the distorted wave Born approximation (DWBA). Therefore, we deduce the square of the experimental form factor - the differential cross section divided by the Mott cross section - at the measured momentum transfer and electron beam energy by
| (3) |
where is the number of protons and denotes the reduced transition probability, while and are reduced transition probabilities calculated within plane wave and distorted wave Born approximation, respectively. This so-called PWBA transformation allows to relate cross sections measured at different and directly to the form factor or corresponding transition density. The data of the different experiments should then collapse into a single line for . For the present measurements typical transformation factors are around .
The factors in Eq. (3) are computed with the code of Heisenberg and Blok ref:Heisenberg1983 in an iterative procedure starting with a the transition density taken from the models discussed in Ref. ref:Chernykh2007 , e.g. the Fermionic Molecular Dynamics (FMD) model ref:Roth2004 . The resulting form factor is transformed into an improved transition density that enters in a second step into the PWBA transformation in Eq. (3) etc. Convergence is reached after three steps.
The transition form factor of a monopole transition is related to the transition density by
where is the matrix element of the charge density operator between the ground state and the Hoyle state and the operator counts the number of protons.
Expansion of the Bessel function for low , i.e. , shows that the form factor in Eq. (Pair Decay Width of the Hoyle State and its Role for Stellar Carbon Production) is governed by the lowest moments and . Hence precise data at low are important for an accurate determination of the pair width which is proportional to , cf. Eq. (2). But as we shall show later the power expansion around is very sensitive to statistical and systematic errors. Therefore we combine our new results with the previous world data set ref:Crannell2005 and perform a model-independent analysis of the transition form factor by a global fit to all data.
In the present analysis we use the model-independent ansatz
| (5) |
which respects the condition and the fact that contains only even powers of . The fit parameters are and , where plays the role of a length scale. The matrix element is simply given by and .
The transition density corresponding to the ansatz (5) is given by
| (6) |
where the relation between the coefficients and can be calculated by the inverse transformation of Eq. (Pair Decay Width of the Hoyle State and its Role for Stellar Carbon Production). For the Hoyle state measurements of exist up to fm-1 so that structures in can be resolved on a scale of fm.
Due to the Coulomb distortion of the in- and outgoing scattering states the cross section remains finite at momentum transfers where the form factor goes through zero and hence the uncertainty in deducing according to the PWBA transformation Eq. (3) is large around , see Fig. 2. Therefore only data are considered. Variation of the maximum power of the polynomial in Eq. (5) shows that is sufficient for the present analysis.
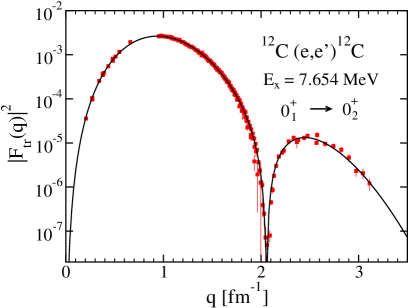
Figure 2 shows the resulting global fit. It describes the data well over the whole range of measured momentum transfers including the minimum region, where data were excluded from the fit. The following transition radii are extracted: fm2 and fm4. The uncertainties are estimated by varying the data base because they are dominated by systematic errors in the data sets. The accuracy is essentially limited by the experimental uncertainties at fm-1 where the cross sections are small. This might look surprising because the transition radius is given by the limit . However, we have reached an accuracy where seemingly small contributions become relevant and furthermore the form factor has to be a smooth function so that information from higher values may influence the low- behavior to a certain extent.
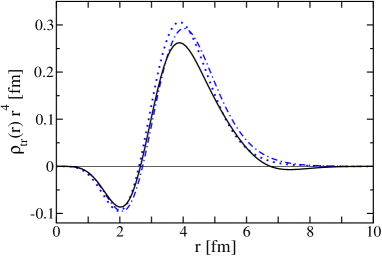
In Fig. 3 we display to show that , which is times the integral over this function, is very sensitive to contributions beyond fm where the ground state density is very small but the density of the Hoyle state is not, see Ref. ref:Chernykh2007 . The transitions densities obtained in Fermionic Molecular Dynamics and BEC (gas of -particles) are somewhat too large beyond 4 fm indicating that the calculated charge density of the Hoyle state is overestimated at large distance. Although the deviation does not seem to be big the transition radius is for both models about 20% too large because negative and positive contributions cancel up to fm and only the region beyond 3.5 fm matters.
Crannell et al. ref:Crannell2005 used the same data, except for the seven new data points, and performed a Fourier Bessel (FB) analysis ref:Heisenberg1981 . Figure 3 illustrates that beyond their adopted cut-off radius fm the transition density vanishes. They concluded however a significantly smaller . To understand this discrepancy we take our fit as an approximation of the experimental form factor and read off the FB expansion coefficients at for up to . The resulting transition density has or eV in accordance with the result of ref:Crannell2005 . In order to reproduce our own result within a FB analysis we have to go up to at least which corresponds to where no data exist. The same holds true if we repeat the analysis without the S-DALINAC data. In general one should keep in mind that due to the oscillatory behavior of the Bessel functions a FB expansion can only reproduce the tail region well, if and are sufficiently large.
The Taylor expansion of the form factor around offers itself a model-independent way to deduce the transition radius which is the leading coefficient in the expansion. To study this often employed approach we deduce from Eq. (Pair Decay Width of the Hoyle State and its Role for Stellar Carbon Production)
| (7) |
which is used to fit the low- data measured at the S-DALINAC. The quantities and are taken as free parameters. Higher powers up to are included in the fit such that the last term in Eq. (7) contributes less than 1% of the first term. Because of the limited number of data points we approximated the higher transition matrix elements by with . These ratios were taken from the results of the global fit to all data.
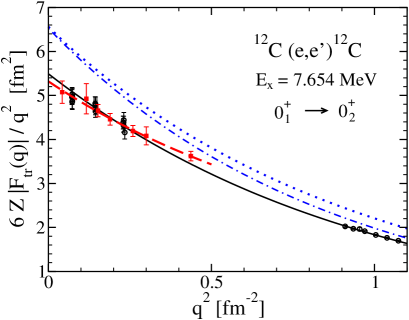
The dashed curve in Fig. 4 represents the fit to the data resulting in = fm2 and = fm4. As can be seen from Fig. 4 an extraction of the transition radius by extrapolation to considering only low- data is very sensitive to the experimental errors. The global fit to all data (full line) reproduces the new low- data except for a single data point at fm-2. The slope of the polynomial fit (dashed line) is apparently not steep enough to match the data at higher momentum transfer around fm-2. The inherent uncertainty when considering low- data only has also been pointed out by Sick for an extraction of the proton charge radius from elastic electron scattering ref:Sick2003 . Although the value of obtained with our new data at low agrees within error bars with the global fit it is clear from Fig. 4 that the fit of all available data with a suitable ansatz is more reliable.
The deviations of the model transition densities at large radii (cf. Fig. 3) lead to values exceeding the experimental results. Moreover, Fig. 4 demonstrates that also the slopes at (proportional to ) are too steep indicating the need for an improved description of the tails of the model wave functions.
To summarize, the pair decay width of the Hoyle state has been extracted from a new 12C(e,e′) experiment at low momentum transfers and independently with a novel model-independent global fit of the world data. The latter, shown to be less prone to systematic errors, provides eV in accord with values deduced 40 years ago but with much reduced uncertainty. Combined with an improved determination of the pair width branching ratio presently underway, the astrophysical reaction rate of the triple- process is then known with a precision sufficient to quantitatively constrain the modeling of a variety of key problems in nuclear astrophysics.
The result for the pair width deviates from a more recent Fourier Bessel (FB) analysis. The origin of this discrepancy is explained by shortcomings of the FB and the lack of data beyond fm-1. Furthermore, the study of the monopole transition to the Hoyle state by electron scattering at low momentum transfer provides important constraints on models by a unique test of the nuclear wave function at large distances where one expects -cluster structures.
H.-D. Gräf, R. Eichhorn and the S-DALINAC team are thanked for preparing excellent electron beams. Discussions with S. M. Austin are gratefully acknowledged. We are indebted to H. P. Blok for his help with the DWBA code and to H. Crannell for detailed information on the previous FB analysis. This work has been supported by the DFG under contract SFB 634.
References
- (1) H. O. U. Fynbo et al., Nature 433, 136 (2005).
- (2) G. Wallerstein et al., Rev. Mod. Phys. 69, 995 (1997).
- (3) S. M. Austin, Nucl. Phys. A758, 375c (2005).
- (4) C. Tur, A. Heger, and S. M. Austin, Ap. J. 671, 821 (2007).
- (5) F. Herwig, S. M. Austin, and J. C. Lattanzio, Phys. Rev. C 73, 025802 (2006).
- (6) F. Käppeler, F.-K. Thielemann, and M. Wiescher, Annu. Rev. Nucl. Part. Sci. 48, 175 (1998).
- (7) C. Tur, A. Heger, and S. M. Austin, Ap. J. 702, 1068 (2009).
- (8) F. Hoyle, Ap. J. Suppl. 1, 121 (1954).
- (9) R. G. Markham, S. M. Austin, and M. A. M. Shahabuddin, Nucl. Phys. A270, 489 (1976).
- (10) D. E. Alburger, Phys. Rev. C 16, 2394 (1977).
- (11) S. M. Austin, private communication.
- (12) D. H. Wilkinson, Nucl. Phys. A133, 1 (1969).
- (13) T. Kibédi and R. H. Spear, At. Data Nucl. Data Tables 89, 77 (2005).
- (14) H. Crannell et al., Nucl. Phys. A90, 152 (1967).
- (15) P. Strehl, Z. Phys. 234, 416 (1970).
- (16) F. Ajzenberg-Selove, Nucl. Phys. A506, 79 (1990).
- (17) J. Heisenberg, Adv. Nucl. Phys. 12, 61 (1981).
- (18) H. Crannell et al., Nucl. Phys. A758, 399c (2005).
- (19) M. Chernykh et al., Phys. Rev. Lett. 98, 032501 (2007).
- (20) A. Tohsaki et al., Phys. Rev. Lett. 87, 192501 (2001).
- (21) A. W. Lenhardt et al., Nucl. Instrum. Methods in Phys. Research A 562, 320 (2006).
- (22) J. Heisenberg and H. P. Blok, Annu. Rev. Nucl. Part. Sci. 33, 569 (1983).
- (23) R. Roth, T. Neff, H. Hergert, and H. Feldmeier, Nucl. Phys A745, 3 (2004).
- (24) I. Sick, Phys. Lett. B 576, 62 (2003).