Extending the Canada-France brown Dwarfs Survey to the near-infrared:
first ultracool brown dwarfs from CFBDSIR
††thanks: Based on observations obtained with WIRCam, a joint project of
CFHT, Taiwan, Korea, Canada, France, and the Canada-France-Hawaii
Telescope (CFHT) which is operated by the National Research Council
(NRC) of Canada, the Institute National des Sciences de l’Univers of
the Centre National de la Recherche Scientifique of France, and the
University of Hawaii.
Based on observations obtained with MegaPrime/MegaCam, a joint
project of CFHT and CEA/DAPNIA, at the Canada-France-Hawaii
Telescope (CFHT) which is operated by the National Research Council
(NRC) of Canada, the Institut National des Sciences de l’Univers of
the Centre National de la Recherche Scientifique (CNRS) of France,
and the University of Hawaii. This work is based in part on data
products produced at TERAPIX and the Canadian Astronomy Data Centre
as part of the Canada-France-Hawaii Telescope Legacy Survey, a
collaborative project of NRC and CNRS.
Based on observations made with the
ESO New Technology Telescope at the La Silla Observatory under
programs ID 082.C-0506(A) and 083.C-0797(A) with SOFI at NTT and ESO
VLT Director Discretionary Time program 282.C-5075 with ISAAC.
Abstract
Aims. We present the first results of the ongoing Canada-France Brown Dwarfs Survey-InfraRed, hereafter CFBDSIR, a near infrared extension to the optical wide-field survey CFBDS. Our final objectives are to constrain ultracool atmosphere physics by finding a statistically significant sample of objects cooler than 650K and to explore the ultracool brown dwarf mass function building on a well-defined sample of such objects.
Methods. We identify candidates in CFHT/WIRCam and CFHT/MegaCam images using optimised psf-fitting, and follow them up with pointed, near-infrared imaging with SOFI at the NTT. We finally obtain low-resolution spectroscopy of the coolest candidates to characterise their atmospheric physics.
Results. We have so far analysed and followed up all candidates on the first 66 square degrees of the 335 square degree survey. We identified 55 T-dwarfs candidates with and have confirmed six of them as T-dwarfs, including 3 that are strong later-than-T8 candidates, based on their far-red and NIR colours. We also present here the NIR spectra of one of these ultracool dwarfs, CFBDSIR1458+1013, which confirms it as one of the coolest brown dwarf known, possibly in the 550-600K temperature range.
Conclusions. From the completed survey we expect to discover 10 to 15 dwarfs later than T8, more than doubling the known number of such objects. This will enable detailed studies of their extreme atmospheric properties and provide a stronger statistical basis for studies of their luminosity function.
Key Words.:
Low mass stars: Brown Dwarfs – photometry – spectroscopy – Methods: data analysis – Surveys1 Introduction
The significant improvement in detector technology, data storage, and analysis facilities in the past decade has made it possible to carry out wide-field surveys covering a large fraction of the sky instead of targeting specific sources. The wealth of data from these surveys necessitate a complex dedicated computer analysis to single out relevant scientific information. These surveys, such as DENIS (Epchtein et al. 1997), SDSS (York et al. 2000), 2MASS (Skrutskie et al. 2006), UKIDSS (Lawrence et al. 2007), and CFBDS (Delorme et al. 2008b) contain hundreds of millions of astrophysical sources and led to many advances in various fields, notably to identify extremely rare objects and build robust statistical studies.
The survey we are presenting here, the Canada-France Brown Dwarfs Survey-InfraRed aims at finding ultracool brown dwarfs (T 650K) of which only 6 are currently published by Warren et al. (2007); Delorme et al. (2008a); Burningham et al. (2008, 2009, 2010). Lucas et al. (2010) have very recently identified a probably even cooler object. These rare objects are in many ways the intermediate “missing link” between the cold atmospheres of the Solar System’s giant planets and cool stellar atmospheres. The physics and chemistry of their atmospheres, dominated by broad molecular absorption bands, are very planetary-like (see Kulkarni 1997, for instance) and the cool brown dwarfs spectra are the key to constraining planetary and stellar atmosphere models.
Nowadays, the Teff700K atmosphere temperature regime is troublesome for modellers. A few ultracool late T brown dwarfs have now been discovered with effective temperatures below 650K. These discoveries step into unexplored territory and a new generation of models is emerging. It is facing several difficulties. 1) Out-of-equilibrium chemistry plays an important role, resulting for instance in NH3 being less prevalent than expected (Cushing et al. 2006). 2) Fine details of convection control both the L/T transition and the dredge up of hot chemical species in late T atmospheres. 3) Water cloud formation and dust nucleation play important roles. 4) Line opacities of several molecules, in particular NH3 and, to a lesser extent, CH4 are unknown and cause important spectroscopic feature mismatches. As a good example of the need for refined models, Burningham et al. (2009) have recently determined that a T8.5 dwarf companion to an M star was actually 15% cooler than model fitting would have predicted and Dupuy et al. (2009) and Liu et al. (2008) reached similar conclusions when studying brown dwarf binaries with dynamical masses.
Under those circumstances, observations are key to the development of the models. Only five brown dwarfs with temperatures below 650K (T8.5) are currently known from recent discoveries by UKIDSS and CFBDS, and this small number prevents discerning general trends from individual peculiarities. Kirkpatrick et al. (1999) and Burgasser et al. (2002) could rely on samples of 20-25 objects to respectively define the L and T spectral types. In this article we present the CFBDSIR, a near infrared (hereafter NIR) extension to the CFBDS that will provide a WIRCAM (Puget et al. 2004) -band coverage down to for 10 detections atop 335 square degrees of CFBDS MegaCam (Boulade et al. 2003) -band imaging with a 5 detection limit of =23.25-24.05. All optical magnitudes presented in this article are AB magnitudes, while all NIR magnitudes are Vega magnitudes. When the CFBDSIR is complete, we hope to achieve a threefold increase in sample size to 15-20 characterised ultracool brown dwarfs and possibly find a few substellar objects significantly cooler than 500K of which none is known yet outside the solar system. This will define general trends and dispersions around them, permitting the study of ultracool dwarfs not only as individual interesting objects, but as a population. This will help define the T/Y spectral transition that is expected to occur in this temperature range. In section 1 we present the rationale of this new wide-field survey and the observations at its core. In section 2 we describe the data reduction and the data analysis methods we used to identify ultracool brown dwarfs candidates. Finally, we present the spectra and the photometry of the first ultracool brown dwarf identified with CFBDSIR in section 3.
2 Observations
2.1 Far-red and near infrared photometric properties of brown dwarfs
Field brown dwarfs are cool objects, with a temperature range that currently extends from 2500K (early L) to K (latest objects identified, e.g. Leggett et al. 2009). Even cooler, and still to be found, brown dwarfs should close the temperature gap between late type T-dwarfs and solar system Jovian planets(110K). These objects do exist (see Burgasser et al. 2009, for instance) because low-mass brown dwarfs already observed in young clusters must cool down to this temperature range when they age. Brown dwarfs spectra differ significantly from a black body, and have considerable structure from deep absorption lines and bands. The spectral energy distribution of 500K brown dwarfs peaks in the in the band in the near infrared (even colder objects should emit more energy in the mid-infrared), and they are therefore most easily detected in that wavelength range. Their NIR colours are, however, not distinctive at a modest signal-to-noise ratio (see Metchev et al. 2008, for instance), and brown dwarfs are more easily recognised by including at least one photometric band blueward of 1 m. At those wavelengths the steep slope of their spectra stands out, and they have very distinctively red and colours. The CFBD Survey (Delorme et al. 2008b) took advantage of their distinctive colours to identify hundreds of L and T-dwarfs. However, the reddest and coolest brown dwarfs have extremely red colours and are much easier to detect in the NIR than on original CFBDS far-red images. A WIRCam -band coverage of CFBDS fields is a straightforward and efficient way to cumulate both the very effective selection criteria using far-red colour information and the NIR detection sensitivity to ultracool brown dwarfs. Since the overlap of CFBDS with existing NIR surveys with a relevant depth (such as UKIDSS, Lawrence et al. 2007) is marginal, it was impossible to rely on archive data.
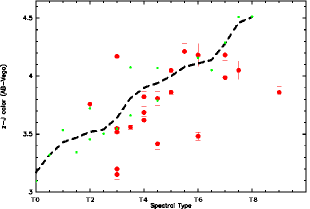
The resulting survey, CFBDSIR, identifies astrophysical sources on -band WIRCam (Puget et al. 2004) images and selects ultracool brown dwarfs candidates depending upon their colours, using magnitudes from CFBDS MegaCam (Boulade et al. 2003) images. The colour has a wide range for brown dwarfs, varying from 2.6 for mid-L types to over 4.5 for late-T types (Fig. 2). It therefore provides (at least at a good signal-to-noise ratio) a good selection criteria to identify ultracool brown dwarfs. They usually have 3.8, as confirmed by atmosphere models such as BT-Settl (Allard et al. 2007), synthetic MegaCam/WIRCam colours derived from known objects (Delorme et al. 2008b) and direct observational data (Delorme et al. 2008a; Burningham et al. 2008, 2009). Models suggest that cooler objects, not yet discovered (T500K), are even redder. Figure 2 however shows that the colour-spectral type relation for late T-dwarfs has a wide spread, meaning that this colour range also contains some warmer mid-T dwarfs. Follow-up photometry of candidates in and band easily distinguishes the relatively blue very late T from the redder mid-T-dwarfs (see Lodieu et al. 2007, for instance). Only very rare astrophysical objects share the same colour range: very high-redshift starburst-galaxies, extremely red Balmer break galaxies, and atypical broad absorption-lines quasars at moderately high redshift (), such as those described in Hall et al. (2002). However, those objects can be differenciated from brown dwarfs using only photometry: they are not as red in as ultracool brown dwarfs and will appear in the CFBDS images whereas brown dwarfs will not. Quasars with redshift z7 cannot be distinguished from cool brown dwarfs using the CFBDSIR and optical photometry, but we would be lucky to find just one of these extremely interesting objects. None has been discovered yet, and extrapolation of the z6 luminosity function (Willott et al. 2010) suggests that wider or/and deeper surveys will be needed to find one. Other possible contaminants are detector artefacts and variable objects whose luminosity changed between and exposures.
2.2 The survey
WIRCam NIR data.
This article focuses on the results obtained from a 66 square degrees
pilot subset of CFBDSIR whose final coverage is expected to be 335
square degree.
CFBDSIR WIRCam imaging goes to a depth of
for a point-source detection limit of 10, which
ensures
accurate photometry and rejects most spurious detections. Images were
acquired
at CFHT in QSO mode with seeing varying from 0.6″to 1.0″during
semesters 2006B, 2007A, and 2009B. These WIRCam images overlap the
existing
-band images of CFBDS; i.e., each 1 square degree MegaCam field
is
covered by nine 21’ by 21’ WIRCam -band 45-second exposures. For the
sake of
efficiency, no dithering is done. Instead, the 9 adjacent fields observed
in
sequence are used for sky construction. Each 9-field patch is actually
observed
twice, generally one night apart, in order to identify and remove any
moving
solar system object, for a total integration time of 90 seconds. The
second sequence is observed with few pixels offset to average the fixed noise
pattern
seen on the WIRCam detectors.
The 10 limiting depth of ensures that all
confirmed ultracool brown dwarf candidates can be observed with
low-resolution spectrographs on 8-meter class telescopes.
Optical data.
The optical data consist of the -band images used for the CFBD
Survey. This survey is made of public and P.I. data and associated 4
sub-surveys of different area shallowness, namely the Canada-France-Hawaii
Telescope Legacy Survey-Very Wide,CFHTLS-Wide, CFHTLS-Deep and
Red-sequence Cluster Survey-2 (RCS2), described in detail by
Delorme et al. (2008b). The CFBDSIR only targets the 3 shallower
components, as shown in Table 1. This table compares
the limiting magnitude, the maximum distances of detection for
mid-L, mid T and the latest T-dwarfs, together with
the areas covered by each survey. The similar table 1 in
Delorme et al. (2008b) incorrectly uses the maximal magnitude limit
for the
CFHTLS-WIDE, instead of the average one. The value of 23.3 stated in
Table 1 here corrects this error. The 335 square degrees CFBDSIR
probes about 2.8 times more volume for
late T-dwarfs than the 900 square degree CFBDS, and even more for
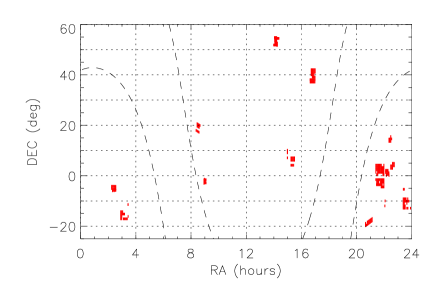
redder (and thus likely cooler) objects. Figure
1 shows the sky coverage of CFBDSIR as of March
2010. The optical data is public and available on the CFHT archive,
while the NIR data becomes public after the standard one-year
CFHT proprietary period.
| Survey Name | () detection limit | mid-L maximal detection (pc) | mid-T maximal detection (pc) | T9 maximal detection (pc) | Final coverage (sq deg) |
| CFBDS:RCS-2 | 22.5 (23.25) | 185 | 80 | 16 | 600 |
| CFBDS:CFHTLS-Very Wide | 22.8 (23.55) | 215 | 90 | 18 | 150 |
| CFBDS:CFHTLS-Wide | 23.3 (24.05) | 270 | 115 | 22 | 170 |
| Survey Name | detection limit | mid-L maximal detection (pc) | mid-T maximal detection (pc) | T9 maximal detection (pc) | Final coverage(sq deg) |
| CFBDSIR | 20.0 | 235 | 145 | 35 | 335 |
-
CFBDS initial detections are made in and only better than detections are used. CFBDSIR makes the initial detection in , using only better than detections in , and is only limited in by no detections. We define any -band object with a signal below the threshold as a no detection or ”z’-dropout”.
Survey rationale. Ultracool brown dwarfs have for the MegaCam and WIRCam photometric systems, with some already observed at . Given the relative depth of the optical and NIR exposures, most of the T-dwarfs earlier than T7 detected in the -band image will have a -band counterpart. The objects detected at and not at (hereafter -dropouts) are thus good candidates for some of the coolest T-dwarfs known (T7), and possibly even cooler Y dwarfs.
Since our most interesting candidates are likely to only be
detected in -band, we need to carefully eliminate most sources of
contamination in this band. The main contaminants are detectors artefacts,
variable objects and asteroids. As described in
detail in section 3.2, our point spread function
(hereafter PSF)
analysis removes most artefacts, while all asteroids are eliminated
because they move between the two exposures taken at each
pointing. Supernovae and other strongly variable objects have to
be rejected
during the follow-up, but their numbers are kept low thanks to the
relative shallowness of the survey. Since we select
all PSF-looking -band dropouts, CFBDSIR also very efficiently
identifies high-proper motion objects: if the proper motion is high
enough that a -band source cannot be cross-matched with its
-band counterpart, the automatic pipeline keeps the
candidate in the selection as a -band
dropout. Visual examination of all selected candidates subsequently
identifies those high proper motion sources easily.
NIR Follow-up. The NIR follow-up of CFBDSIR candidates removes the remaining candidates but also provides an efficient characterisation of the confirmed candidates. Ultracool brown dwarfs can be singled out by their blue and colours owing to stronger H2O, CH4 and probably NH3 absorption than earlier T dwarfs. The CFBDSIR follow-up of the first 66 square degrees from CFBDSIR required about 3.5 nights on SOFI (Moorwood et al. 1998) at NTT. We were able to observe all 55 T-dwarfs candidates identified and to confirm 6 of them as T-dwarfs, including 3 ultracool brown dwarfs (later than T7 dwarfs and possible Y dwarfs) candidates. The rationale of the NIR follow-up is the following.
-
•
A short (5 to 10 minute dithered image, with 30-s individual exposures), -band exposure confirms the candidate and eliminates any remaining contaminants from variable sources, such as supernovae or detector artefacts. For confirmed candidates, this image also provides good signal-to-noise (from 20 to about 100, depending on the target magnitude) -band photometry, better than the photometry on the detection image.
-
•
All candidates confirmed with this SOFI photometry are imaged in -band to characterise them as ultracool brown dwarfs or earlier T-dwarfs. A 10-20 minute dithered sequence, with 20-s individual exposures, usually achieve good signal-to-noise photometry, with an accuracy better than 5%.
-
•
All confirmed candidates with measured 0.1 are potential ultra-cool brown dwarfs that can be further characterised by acquiring -band photometry, if enough observing time is available. A 15-30 minute dithered sequence, with 15-s exposures typically achieves good signal-to-noise photometry in .
It should be noted that this very efficient confirmation and characterisation photometric follow-up is made possible by visitor-mode observation combined with the automatic image reduction by SOFI pipeline Gasgano. A simple photometric analysis can be carried out by the observer only minutes after the exposures allowing and possibly and photometry to be derived on-the-fly. It is then possible to choose the follow-up strategy most suited to each individual candidate. The final astrometric and photometric calibration is done using 2MASS (Skrutskie et al. 2006) stars in the field as references.
3 Survey analysis
Ultracool brown dwarfs are extremely red objects 25 to 60 times (3.5 to 4.5 magnitudes) brighter in -band that in band. This means that even if our images are about 3 to 4 magnitudes deeper than the detection -band images, many of our candidates with strong band detection will not appear at all in the images. However, a non detection in band is a very strong sign that the candidate is a very red astrophysical source with , exactly what we are looking for. The other alternative is that these sources are spurious, such as unrecognised artefacts (remaining detector cross-talk, unflagged hot pixel, optical ghost, etc.) on the image. Since ultracool brown dwarfs are extremely rare ( our preliminary estimate is 1 per 25 square degree, so fewer than 1 per sources down to =20.0), false detection rates of even 1 per 104 real sources would greatly outnumber true brown dwarfs. We therefore need a very robust analysis of the discovery images to tie down the number of artefacts before we finally weed them out during the photometric follow-up of the candidates.
3.1 Image reduction
The WIRCam observations targeted 335 existing MegaCam fields from CFBDS, that have already been observed in and . The reduction of MegaCam data is described by Delorme et al. (2008b).
Images were run through the ‘I‘iwi Interpretor of the WIRCam Images (‘I‘iwi - www.cfht.hawaii.edu/Instruments/Imaging/WIRCam) at CFHT, which does non-linearity correction, dark subtraction, flat-fielding, sky subtraction, bad pixel masking, photometric calibration, and rough astrometric calibration. Cross-talk subtraction was also performed on the 06B and 07A data, affected by amplifier to amplifier cross-talk.
Each set of 2 times 9 WIRCam images covering one MegaCam image was then co-aligned, using the image used as the astrometric reference. This astrometric calibration was performed with Scamp (Bertin 2006), and the images were stacked using Swarp(Bertin et al. 2002). This produced 1 square degree WIRCam images aligned with each targeted MegaCam field.
3.2 Image analysis
Since our stacks are only 2 exposures deep, the final frame is the average of both exposures. To easily reject moving solar system objects from our detection catalogues, we also produced a ”minimum” image of both exposures. This combined image contains the lower of the pixel values of the two exposures, and is effectively devoid of all those objects that moved by more than one FWHM between the exposures. We carried out the analysis using the double-image mode of Sextractor (Bertin & Arnouts 1996), with source detection on the ”minimum” image and photometric measurements on the average image, using PSF fitting. The different analysis steps are described here:
-
•
Spatially variable PSF models of the images are built with PSFex (Bertin et al. 2010), using single stars within the image as prototypes..
-
•
The sources on the minimal image are identified using Sextractor. Their astrometry and photometry are derived by PSF fitting. (The latter is discarded from thereon, but is included in the fit). Since moving objects are at different positions in the two exposures that were stacked to produce the minimal image, they do not appear in the resulting source list.
-
•
A flux-only PSF fitting at the position of the sources identified on the minimal sum stacked image is then carried out on the average stacked image. This step produces the final WIRCam -band catalogue.
-
•
The MegaCam -band catalogue of the corresponding field is then produced using a similar position and flux PSF fitting with Sextractor.
-
•
The -band and -band catalogues are cross-matched so that each source in the -band catalogue is associated with a magnitude. In case there is no -band couterpart to a -band detection, which is then a “-dropout”, the source is given the 5 sigma detection magnitude limit of the full image as its magnitude and the corresponding colour is then considered as a lower limit of its actual colour.
3.3 Filtering and candidate selection
The selection of ultracool brown dwarfs candidates in our catalogue aims at the greatest possible completeness (i.e. finding most of the ultracool dwarfs actually detectable on the images) while keeping the number of contaminants down to an acceptable level. Contaminants are particularly critical because the most promising candidates are the -dropouts for which only a magnitude and a lower limit on the colour is known. To keep the number of contaminants relatively low, we only selected sources with a signal-to-noise ratio above 10 in the -band stack.
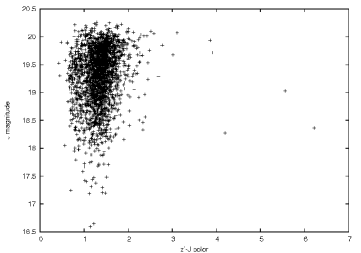
As visible in Fig. 2, brown dwarfs later than T8 populate the 3.8 colour range. This figure as well as Fig. 4 make use of spectra from http://www.jach.hawaii.edu/skl/LTdata.html (Martín et al. 1999; Kirkpatrick et al. 2000; Geballe et al. 2001; Leggett et al. 2002; Burgasser et al. 2003; Knapp et al. 2004; Golimowski et al. 2004; Chiu et al. 2006). As described in Delorme et al. (2008b) these colours are synthesised from the spectra using the filters, atmosphere, telescope and detector transmission and sensitivity of the instruments used in CFBDSIR. Given the large colour spread of late T-dwarfs, we set a very conservative colour selection threshold of 3.5, to select as many ultracool dwarfs as possible. Since the 3.53.8 colour range is mainly populated by warmer T-dwarfs and is still very far from any densely populated colour locus, as illustrated by Fig. 3, including it in our selection does not increase the number of contaminants significantly.
In addition to this colour selection, the main filtering criterion is based on the from PSF fitting, to distinguish point sources from galaxies and artefacts, following the same method as described in Delorme et al. (2008b). Since brown dwarfs are point sources, this morphological rejection of all non-point-source-like objects effectively removes many non-stellar contaminants.
This automated selection produces an average of 6 candidates per square degree. Each of these is visually examined to remove remaining contaminants. In addition to inspecting both the -band and the -band images, we examine the -band image (available from the CFBDS), to reject some variable contaminants, as well as possible contamination by atypical broad absorption line quasars, none of which is known to be very red in both and (P.Hall, private communication and Hall et al. 2002). Since the 5 detection limits of the CFBDS images (between 24.5 and 25.5) are significantly deeper than the images, broad absorption line quasars with should be visible on the image. We identified one such object, CFBDSIR232451-045852, with 4.7 and =0.9.
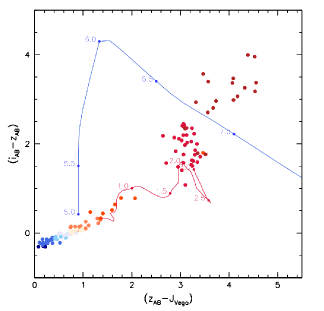
Very high-redshift (z6), star-forming galaxies and evolved galaxies with strong Balmer/4000Å breaks at z2, shown in Fig. 4, are other possible contaminants. While the surface density of J20 high-redshift, star-forming galaxies is unknown (the brightest of these objects discovered so far have J25 (Ouchi et al. 2009), five magnitudes fainter than our detection limit), the expected exponential cut-off in the luminosity function suggests that the probability of finding any such galaxy in CFBDSIR is extremely low. Balmer/4000Å break galaxies at z2.5 do enter the fringe of our selected colour range; however, their colour is typically below 5, ensuring they are detected in the -band CFBDS images and are then eliminated from our candidate list.
After this final visual check, we end up with about 1 ultracool brown dwarf candidate per square degree, which has to be confirmed with pointed NIR observations.
4 Results
4.1 Photometric confirmation of 3 ultracool brown dwarfs
The 55 candidates found in a 66 square degree subset of the data were followed-up with photometry at the ESO New Technology Telescope, using the SOFI near infrared camera during visitor mode runs 083.C-0797(A) and 082.C-0506(A), in July 2009 and March 2009. These pointed NIR observations confirm six T-dwarfs, of which 3 are robust ultracool brown dwarf candidates. Those are likely to be either very late T-dwarfs (T8) or cooler Y dwarfs. The brighter 2 of the 3 earlier T candidates are re-identifications of CFBDS-discovered brown dwarfs, spectroscopically confirmed as T3.5 and T5 (Albert et al., submitted.).
The candidates identified in the remaining 269 square degrees have
not yet been followed-up, and they certainly include mostly contaminants.
Extrapolating the results from the 66 square degree pilot subset
of CFBDSIR to the full survey, we expect to find 15 ultracool
brown dwarfs. Low-resolution NIR spectroscopy of the confirmed
ultracool brown dwarfs will be needed to derive spectral types and
characterise their cool atmosphere physics.
Photometric properties of ultra-red brown dwarf candidates
After the March 2009 , and follow-up observations, one candidate stood out as particularly interesting. We then obtained additional WIRCam , and photometry for this object, CFBDSIR J145829+101343 (hereafter CFBDSIR1458). The resulting magnitudes are presented in Table 2. The SOFI photometry in this table has additional uncertainty because its calibration is bootstrapped from a small number of good 2MASS reference stars in the narrow field of the SOFI NTT images, especially so in the and bands.
CFBDSIR1458 colours are detailed in Table 3 and shown in Fig. 6, and can be summarised as follows:
-
•
Very red far-red colours: 3.94, which Table 3 compares to those of other ultracool brown dwarfs;
- •
 |
 |
 |
 |
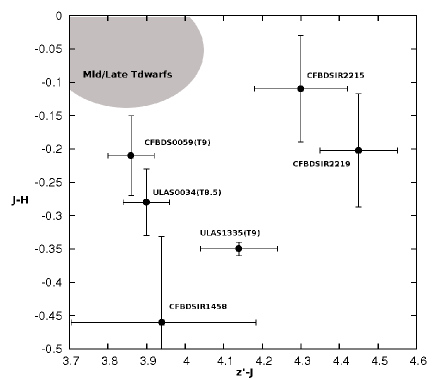
A second follow-up run at NTT on July 2009, confirmed 2 other ultra-red objects, CFBDSIR221903.07+002417.92 and CFBDSIR221505.06+003053.11 (hereafter CFBDSIR2219 and CFBDSIR2215), with even redder colours, typical of ultracool brown dwarfs. These objects have redder than any known T8+ brown dwarf. CFBDSIR2215, however, has only a moderately blue colour, which would be compatible with an earlier (i.e. T5-T7) spectral type, suggesting a peculiar spectrum. The photometric properties of these objects are described in Table 3 and Fig. 5.
| Filter | s | |||
|---|---|---|---|---|
| Mag(1) | 0.24 | 19.660.02 | 20.120.13 | 20.600.37 |
| Mag(2) | - | 19.720.04 | 19.960.16 | 20.130.32 |
| Object | |||
|---|---|---|---|
| ULAS0034 | 3.900.06 | -0.280.05 | -0.120.06 |
| CFBDS0059 | 3.860.06 | -0.210.06 | -0.670.06 |
| ULAS1335 | 4.140.10 | -0.350.01 | -0.380.03 |
| 2MASS0939 | - | 0.180.181 | -0.580.10 |
| WOLF940B | 3.990.13 | -0.610.04 | -0.690.05 |
| CFBDSIR1458 | 3.940.24 | -0.460.13 | -1.020.37 |
| CFBDSIR2219 | 4.450.10 | -0.200.085 | - |
| CFBDSIR2215 | 4.300.12 | -0.110.08 | - |
While CFBDSIR2219 and CFBDSIR2215 are queued for NIR spectroscopic characterisation, we already obtained a spectrum of CFBDSIR1458, which we discuss in section 4.2.
Proper motion of CFBDSIR1458
Since the MegaCam image and the WIRCam image are co-aligned
by the CFBDSIR pipeline the proper motion is easily measured from
these 2 images. CFBDSIR1458 moves by +0.58″ in RA and
-0.95″ in DEC between the July 15, 2004 date of the
image and April 1, 2007 date of the image.
The centroiding and image alignment uncertainties are low, at
0.035″, but the error budget has to include chromatic
refraction and the uncertain parallactic motion. The estimated spectroscopic
distance is 23pc, with a likely range of 15–30 pc
(Table 4), which translates to a 0.04″maximum error
from the parallax. Due to the very steep spectral energy distribution
in the band, chromatic refraction here is of the order of the
measurement error. We also measured the proper motion between the
-band WIRCam discovery image and the band NTT follow-up
image, finding +0.32″ in RA and -0.80″ in DEC between
April 1, 2007 and March 5, 2009. This second measurement has
smaller centroiding and image-alignment uncertainties, 0.03″,
minimal chromatic refraction uncertainties since the two -band observations
were obtained at similar airmasses, and a small unceretainty from
the parallax because the two observations were coincidentally obtained
at closely matched times of the year. It is therefore our preferred proper
motion measurement, and is consistent with the previous one.
Table 4 presents the resulting yearly motion and kinematic
parameters.
| RA(″.yr-1) | DEC(″.yr-1) | RA(km.s-1) | DEC(km.s-1) |
|---|---|---|---|
| +0.170.016 | -0.410.016 | 18 | 46 |
-
The systematic errors induced by chromatic refraction and parallax effects are not corrected. The estimate of the absolute tangential velocity assumes a distance of 23pc.
4.2 Spectroscopic confirmation of a new ultracool brown dwarf
Observations and reduction
After reduction and analysis of the March 7, data, an ESO Director Discretionary Time observation request was submitted on March 20, 2009 to obtain low-resolution NIR spectroscopy of CFBDSIR1458. This proposal for 4 hours of -band observation, totalling 150 minutes of exposure on target, was accepted on April 22. The first observations were acquired on May 4, and the last on September 1, on average at high airmass, varying from 1.4 to more than 2.0.
The spectrum was extracted
and calibrated using our own IDL procedures. The reduction proceeded
as follows. The sequence of spectral images
were flat-fielded using an internal flat taken immediately after the
science frames. Since the trace was too faint for its position to be accurately
determined, its
curvature was derived from the reference star spectrum. The frames were
then pair-subtracted, effectively removing most of the
sky, dark current and hot pixels contributions. Each frame was
collapsed along the spectral dimension to determine the positive and
negative traces positions. We then extracted the spectra using positive
and negative extraction boxes that have identical but opposite
integrals; this minimised the contribution from residual sky line that
would have remained from the pair subtraction. The same operation was
performed
on the A0 telluric calibration star. Spectra derived from individual
image pairs were then median-combined into final target and calibration
star spectra. A telluric absorption spectrum was derived using the
calibration-star spectra. A black body spectrum with a temperature of 10
000K was assumed for the A0 star and hydrogen-lines were interpolated
over.
The target spectrum was then divided by the derived telluric transmission
spectrum. A first-order wavelength calibration was obtained from an
argon-lamp
spectrum, and fine-tuned by registering bright OH lines obtained from
a sum of the pair of images of interest.
Spectroscopic properties
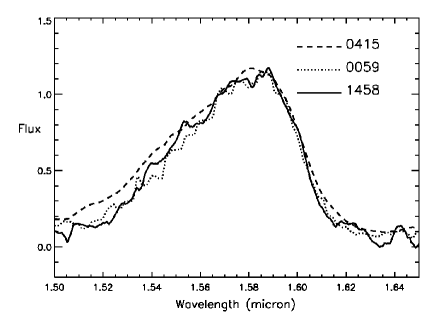
The resulting spectrum (Fig.7) has a low signal-to-noise owing to the faintness of the target () and its relatively high airmass at the time of the observations. We plan to obtain better signal-to-noise observations, as well as and -band low-resolution spectrum, but we were already able to derive from the present -band spectrum the spectroscopic indices described by Burgasser et al. (2006) and Delorme et al. (2008a), which quantify the strength of key molecular absorption bands. As shown in Table 5, this classifies CFBDSIR1458 as an ultracool brown dwarf with spectral type later than T8 and a temperature in the same range (500-600K) as the coolest brown dwarfs known. Direct comparison of the CFBDSIR1458 -band spectrum with other ultracool brown dwarfs (See Figs. 7 and 8) visually confirms that H2O and CH4 absorption in its atmosphere are significantly stronger than they are on 2MASS0415 (Burgasser et al. 2003) the T8 spectral template. This also strongly suggests that CFBDSIR1458 is indeed a later-than-T8 ultracool brown dwarf. The comparison with even cooler objects is less clear cut, mainly because of the low signal-to-noise of the spectrum, as emphasised by the strong variations in the spectral indices for 2 different -but both sufficiently sampled- binning of CFBDSIR1458 spectrum visible in Table 5. However, both the spectrum and the indices would tend to show that CFBDSIR1458 is not cooler than the coolest brown dwarfs already known.
This intermediate spectral feature would tentatively put CFBDSIR1458 in the same class as WOLF940B, that was classified as T8.5 by Burningham et al. (2009) who assigned a temperature of 550-600K to this object. Given the similarities in the -band indices of both objects, a reasonable estimate would put CFBDSIR1458 in the same temperature range. However, this rough estimate will need to be confirmed by higher signal-to-noise multi-bands spectroscopic observations. In particular, its very blue colour could be due to sub-solar metallicity (Leggett et al. 2010). Additional observations would also enable looking for the NH3 absorption in the CFBDSIR1458 spectrum, such as the probable absorption band identified by Delorme et al. (2008a). IRAC imaging in the 4.5micron channel would also be very valuable since temperature can be reliably derived from the [] colour (Leggett et al. 2010).
| Object | Sp. Type | H2O-H | CH4-H | NH3-H |
|---|---|---|---|---|
| Gl570D | T7.5 | 0.208 | 0.137 | 0.672 |
| 2MASS0415 | T8 | 0.183 | 0.104 | 0.625 |
| WOLF940B | T8+/Y? | 0.141 | 0.091 | 0.537 |
| CFBDSIR1458 (1) | T8+/Y? | 0.149 | 0.046 | 0.568 |
| CFBDSIR1458 (2) | T8+/Y? | 0.146 | 0.087 | 0.582 |
| ULAS0034 | T8+/Y? | 0.133 | 0.096 | 0.516 |
| CFBDS0059 | T8+/Y? | 0.119 | 0.084 | 0.526 |
| ULAS1335 | T8+/Y? | 0.114 | 0.077 | 0.564 |

5 Conclusion
We have described CFBDSIR, a new NIR survey dedicated at finding ultracool brown dwarfs and using WIRCam camera on the the CFHT. Complementing existing deep far-red data by new -band observations, we select brown dwarfs candidates on their very red colour. A robust PSF analysis allows us to derive reliable colours and to distinguish point-source-like brown dwarfs from most contaminants. The candidates are then confirmed by follow-up pointed NIR observations in -band and confirmed ultracool brown dwarfs are imaged in and bands. We used these photometric measurements to identify several new brown dwarfs, including 3 objects likely as cool as and possibly even cooler than any published brown dwarfs.
We presented CFBSIR1458, the first CFBDSIR ultracool brown dwarf confirmed by spectroscopy. The analysis of its -band spectra, though at relatively low-signal-to-noise, robustly confirms it as later than T8 spectral type and hints at a temperature in the 550-600K range, so among the coolest brown dwarfs discovered. When the 335 square degree survey is completed, we expect to discover a sample of 10 to 15 ultracool brown dwarfs, more than doubling the currently known population of later than T8 objects and enabling study of them as a population rather than extreme individual objects. This will put strong constraints on cool stellar and planetary atmosphere, and with additional mid-infrared follow-up, will help to define the selection criteria for the upcoming WISE survey.
Acknowledgements.
Thanks go to the queue observers at CFHT who obtained data for this paper. This research has made use of the VizieR catalogue access tool, of SIMBAD database and of Aladin, operated at CDS, Strasbourg. This research has benefitted from the M, L, and T-dwarf compendium housed at DwarfArchives.org and maintained by Chris Gelino, Davy Kirkpatrick, and Adam Burgasser. Financial support from the ”Programme National de Physique Stellaire” (PNPS) of CNRS/INSU, France, is gratefully acknowledged.References
- Allard et al. (2007) Allard, F., Allard, N. F., Homeier, D., et al. 2007, A&A, 474, L21
- Bertin (2006) Bertin, E. 2006, in Astronomical Society of the Pacific Conference Series, Vol. 351, Astronomical Data Analysis Software and Systems XV, ed. C. Gabriel, C. Arviset, D. Ponz, & S. Enrique, 112–+
- Bertin & Arnouts (1996) Bertin, E. & Arnouts, S. 1996, A&AS, 117, 393
- Bertin et al. (2010) Bertin, E., Delorme, P., Baillard, A., Marmo, C., & Semah, G. 2010, A&Ain prep.
- Bertin et al. (2002) Bertin, E., Mellier, Y., Radovich, M., et al. 2002, in Astronomical Society of the Pacific Conference Series, Vol. 281, Astronomical Data Analysis Software and Systems XI, ed. D. A. Bohlender, D. Durand, & T. H. Handley, 228–+
- Boulade et al. (2003) Boulade, O., Charlot, X., Abbon, P., et al. 2003, in Presented at the Society of Photo-Optical Instrumentation Engineers (SPIE) Conference, Vol. 4841, Instrument Design and Performance for Optical/Infrared Ground-based Telescopes. Edited by Iye, Masanori; Moorwood, Alan F. M. Proceedings of the SPIE, Volume 4841, pp. 72-81 (2003)., ed. M. Iye & A. F. M. Moorwood, 72–81
- Burgasser et al. (2009) Burgasser, A. J., Bloom, J., Cruz, K., et al. 2009, in Astronomy, Vol. 2010, AGB Stars and Related Phenomenastro2010: The Astronomy and Astrophysics Decadal Survey, 33–+
- Burgasser et al. (2006) Burgasser, A. J., Geballe, T. R., Leggett, S. K., Kirkpatrick, J. D., & Golimowski, D. A. 2006, ApJ, 637, 1067
- Burgasser et al. (2002) Burgasser, A. J., Kirkpatrick, J. D., Brown, M. E., et al. 2002, ApJ, 564, 421
- Burgasser et al. (2003) Burgasser, A. J., Kirkpatrick, J. D., Burrows, A., & al. 2003, ApJ, 592, 1186
- Burningham et al. (2010) Burningham, B., Leggett, S. K., Lucas, P. W., et al. 2010, MNRAS, 400
- Burningham et al. (2008) Burningham, B., Pinfield, D. J., Leggett, S. K., et al. 2008, MNRAS, 391, 320
- Burningham et al. (2009) Burningham, B., Pinfield, D. J., Leggett, S. K., et al. 2009, MNRAS, 395, 1237
- Chiu et al. (2006) Chiu, K., Fan, X., Leggett, S. K., et al. 2006, AJ, 131, 2722
- Cushing et al. (2006) Cushing, M. C., Roellig, T. L., Marley, M. S., et al. 2006, ApJ, 648, 614
- Delorme et al. (2008a) Delorme, P., Delfosse, X., Albert, L., & al. 2008a, A&A, 482, 961
- Delorme et al. (2008b) Delorme, P., Willott, C. J., Forveille, T., et al. 2008b, A&A, 484, 469
- Dupuy et al. (2009) Dupuy, T. J., Liu, M. C., & Ireland, M. J. 2009, ArXiv e-prints
- Epchtein et al. (1997) Epchtein, N., de Batz, B., Capoani, L., et al. 1997, The Messenger, 87, 27
- Geballe et al. (2001) Geballe, T. R., Saumon, D., Leggett, S. K., et al. 2001, ApJ, 556, 373
- Golimowski et al. (2004) Golimowski, D. A., Leggett, S. K., Marley, M. S., et al. 2004, AJ, 127, 3516
- Hall et al. (2002) Hall, P. B., Anderson, S. F., Strauss, M. A., et al. 2002, ApJS, 141, 267
- Kirkpatrick et al. (1999) Kirkpatrick, J. D., Reid, I. N., Liebert, J., & al. 1999, ApJ, 519, 802
- Kirkpatrick et al. (2000) Kirkpatrick, J. D., Reid, I. N., Liebert, J., & al. 2000, AJ, 120, 447
- Knapp et al. (2004) Knapp, G. R. et al. 2004, Astron. J., 127, 3553
- Kulkarni (1997) Kulkarni, S. R. 1997, Science, 276, 1350
- Lawrence et al. (2007) Lawrence, A., Warren, S. J., Almaini, O., et al. 2007, MNRAS, 379, 1599
- Leggett et al. (2010) Leggett, S. K., Burningham, B., Saumon, D., et al. 2010, ArXiv e-prints
- Leggett et al. (2009) Leggett, S. K., Cushing, M. C., Saumon, D., et al. 2009, ApJ, 695, 1517
- Leggett et al. (2002) Leggett, S. K., Hauschildt, P. H., Allard, F., Geballe, T. R., & Baron, E. 2002, MNRAS, 332, 78
- Liu et al. (2008) Liu, M. C., Dupuy, T. J., & Ireland, M. J. 2008, ApJ, 689, 436
- Lodieu et al. (2007) Lodieu, N., Pinfield, D. J., Leggett, S. K., et al. 2007, MNRAS, 379, 1423
- Lucas et al. (2010) Lucas, P. W., Tinney, C. G., Burningham, B., et al. 2010, ArXiv e-prints
- Martín et al. (1999) Martín, E. L., Delfosse, X., Basri, G., et al. 1999, AJ, 118, 2466
- Metchev et al. (2008) Metchev, S. A., Kirkpatrick, J. D., Berriman, G. B., & Looper, D. 2008, ApJ, 676, 1281
- Moorwood et al. (1998) Moorwood, A., Cuby, J., & Lidman, C. 1998, The Messenger, 91, 9
- Ouchi et al. (2009) Ouchi, M., Ono, Y., Egami, E., et al. 2009, ApJ, 696, 1164
- Puget et al. (2004) Puget, P., Stadler, E., Doyon, R., et al. 2004, in Society of Photo-Optical Instrumentation Engineers (SPIE) Conference Series, Vol. 5492, Society of Photo-Optical Instrumentation Engineers (SPIE) Conference Series, ed. A. F. M. Moorwood & M. Iye, 978–987
- Skrutskie et al. (2006) Skrutskie, M. F., Cutri, R. M., Stiening, R., et al. 2006, AJ, 131, 1163
- Stephens & Leggett (2004) Stephens, D. C. & Leggett, S. K. 2004, PASP, 116, 9
- Tinney et al. (2005) Tinney, C. G., Burgasser, A. J., Kirkpatrick, J. D., & McElwain, M. W. 2005, AJ, 130, 2326
- Warren et al. (2007) Warren, S. J., Mortlock, D. J., Leggett, S. K., & al. 2007, MNRAS, 381, 1400
- Willott et al. (2010) Willott, C. J., Delorme, P., Reylé, C., et al. 2010, AJ, 139, 906
- York et al. (2000) York, D. G., Adelman, J., Anderson, Jr., J. E., et al. 2000, AJ, 120, 1579