The O I] 1641Å line as a probe of symbiotic star winds
Abstract
Aims.
Methods.
Results.
Abstract
Context.
Aims. The neutral oxygen resonance 1302Å line can, if the optical depth is sufficiently high, de-excite by an intercombination transition at 1641Å to a metastable state. This has been noted in a number of previous studies but never systematically investigated as a diagnostic of the neutral red giant wind in symbiotic stars and symbiotic-like recurrent novae.
Methods. We used archival high resolution, and GHRS and STIS medium and high resolution, spectra to study a sample of symbiotic stars. The integrated fluxes were measured, where possible, for the O I 1302Å and O I] 1641Å lines.
Results. The intercombination 1641Å line is detected in a substantial number of symbiotic stars with optical depths that give column densities comparable with direct eclipse measures (EG And) and the evolution of the recurrent nova RS Oph 1985 in outburst. In four systems (EG And, Z And, V1016 Cyg, and RR Tel), we find that the O I] variations are strongly correlated with the optical light curve and outburst activity. This transition can also be important for the study of a wide variety of sources in which an ionization-bounded H II region is imbedded in an extensive neutral medium, including active galactic nuclei, and not only for evaluations of extinction.
Key Words.:
Stars-symbiotic stars, physical processes1 Introduction
Symbiotic stars present the unusual situation of a nearly neutral, stable environment centered on a cool giant star, in which a hot source, along with its surrounding ionized region, is imbedded. The radius of the H II region is determined only by the mass gainer’s effective temperature and luminosity, which in turn depend only on the accretion rate from the wind (or in the cases where a disk forms, from the flux distribution of the surrounding disk along with that of the underlying star). Since these can be separated using multiwavelength observations, and the incident spectra are simple at ultraviolet (UV) wavelengths (a hot white dwarf and/or an accretion disk continuum and emission line continuum), it is possible to model the formation of the spectrum comparatively easily. This is mainly because the wind of the companion red giant is at nearly its terminal velocity (see Vogel 1991, Pereira et al 1999) and, even if structured by the orbital motion and hydrodynamic processes related to the accretion (e.g. Dumm et al. 2000; Walder et al. 2008) this happens on a length scale far larger than the gainer and its ionized zone.
In such an environment several radiative processes, not usually encountered under nebular conditions, are observable. Principal among these are fluorescence due to various scattering mechanisms. Accidental resonances account for much of the down-conversion of UV emission to emission in the optical and near infrared. Perhaps the best known are those Fe II and related ions that can be excited by UV resonance transitions of highly-ionized species, e.g. C IV and its coincidence with ground state multiplets of Fe II that de-excite through optical forbidden transitions (Johansson 1983, 1988). Raman scattering (e.g. Schmid 1989), a nearly coincident resonance process that produces broad, down-converted emission lines, is particularly spectacular in the symbiotics, the most notable lines being those of O VI 6825, 7082Å that are produced by the near coincidence of the resonant O VI doublet 1031, 1037Å and H Ly. There is, in addition, a process whereby the UV resonance line of a neutral species can, by virtue of absorption in a surrounding neutral gas, produce both optical and UV emission lines through otherwise inaccessible forbidden transitions. This happens because the ionization potential of several neutral atoms, in particular oxygen, is slightly higher than that of hydrogen and can therefore form in the H II region along with those formed by recombination. Furthermore, resonant absorption by the neutral gas at energies significantly below the ionization limit can, if the optical depth is sufficiently large, lead to emission in alternate channels even in the resonant scattering case.
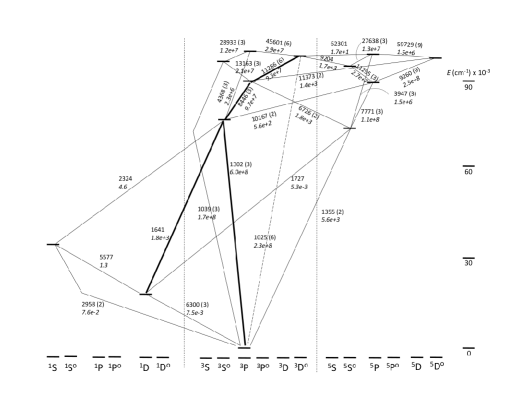
The O I spectrum is a case in point. The 1302 resonance line is one of the strongest emission features in the spectrum of late-type symbiotics. It forms in the H II region around the degenerate gainer since O I has a slightly higher ionization potential than neutral hydrogen. In addition to the ground state, the O I 3So 3P (1302, 1304, 1305Å) multiplet 5 is connected to two long-lived states through emission at 1641Å and 2324Å, both spin forbidden (intercombination) transitions (see Fig. 1), and their associated decay channels to the ground state. One such decay channel, 6300 Å, is well known from terrestrial auroral spectra. Also, the 1641 line has been used as a proxy measure of solar activity variability and its effect on the atmosphere (e.g. Bowers et al. 1987, see below). These lines are also well known from planetary nebulae (e.g. Feibelman 1997) and have been discussed in the literature for studies of interstellar extinction in Seyfert galaxies (Grandi 1983) and the determination of the oxygen abundance in cool stars ([O I] 6300, Nissen et al. 2002).
A difficulty presented by any neutral or singly-ionized resonance transitions is that the interstellar medium, possessing the same resonance transitions, is opaque along many lines of sight, especially for distances of several kiloparsecs that are typical of symbiotic and planetary nebular targets. This is exacerbated for cosmological distances where the intervening Ly forest potentially contaminates the whole redshift range from that of the host galaxy to nearly the local standard of rest. These systems should, therefore, present sufficient line of sight optical depths to produce detectable O I] emission.
In a study of the UV spectra of the recurrent nova RS Oph during its 1985 outburst, Shore & Aufdenberg (1991) noted the presence of a transient emission line on the red wing of He II 1640 relatively early in the outburst and identified this as O I] 1641. This line was also identified by Aufdenberg (1993) in the spectrum of RR Tel. In a recent study of the 2006-2009 outburst of the S-type symbiotic star AG Dra, we discussed the variations of the optical spectra, concentrating on the optical Raman features (Shore, Wahlgren, Genovali, et al. 2010). This survey included an examination of archival material as well as optical high-resolution spectra. The absence of the [O I] 6300 line was noted but it was suggested that it would be worthwhile checking the existing archive of high resolution UV data for O I] 1641. This symbiotic is a special case, having a radial velocity of 144 km s-1; any resonance line originating from the star is well shifted in wavelength with respect to its ISM components. In this paper we report on our search of the archives for the presence of O I] 1641, as well as other O I lines, in the spectra of symbiotic stars. As mentioned above, the O I spectrum originates in the vicinity of the red-giant star. Observations of the O I] line may prove to be useful diagnostics of the red-giant wind and its sources of excitation. Correlation of the UV lines with optical and near-infrared (near-IR) O I lines would therefore enable studies of symbiotic star properties and behavior in the absence of UV spectra.
2 Observations
We retrieved all MAST archival spectra for symbiotic stars taken with the International Ultraviolet Explorer (IUE) satellite at high resolution (R 10000, large aperture) and Hubble Space Telescope () GHRS and STIS medium resolution (G140M, G160M) spectra. No echelle spectra exist for symbiotic stars. For AG Dra, these were supplemented with Telescopio Nazionale Galileo (TNG) high resolution optical spectra. Note was taken of literature sources presenting symbiotic spectra that included O I lines. Figure 2 presents a sample of O I] 1641 + He II 1640 line profiles for six symbiotics from /STIS spectra. The high spectral resolution of the STIS instrument clearly shows that the O I] 1641 line can be located either within or outside of the He II 1640 profile.
2.1 Stellar sample
The available data sets are not of a homogeneous quality, since they were obtained for various scientific purposes, as well as serving as a calibration target. In addition, these data neither represent a thorough nor even sampling of light curves or eruptive events. Therefore, statistics and correlations are directed to the observed occurrence of O I] 1641 and its possible excitation mechanism. Stars for which the line was detected or suspected of being present in the available spectra are the following:
-
•
Z And: The line is visible in high resolution spectra, its variations are discussed in the following section. The system is both eclipsing (as for CH Cyg) and a very active variable with jet-like outflows having been detected.
-
•
EG And: Two GHRS spectra show the He II and O I] lines. The forbidden line is strong and easily visible on the lower resolution spectra. There are five STIS pointings, see Crowley et al. (2008) for details. They note the presence of the line but do not study its variations relative to the orbital phase. The main point is that there is almost no variability in the STIS spectra while the He II line is strongly Fe-curtained. The line is present in all spectra taken outside of eclipse, its variation, based on the data, is discussed in the next section.
-
•
CH Cyg: The UV absorption Fe-curtain spectrum is among the strongest of any symbiotic star. Although cited by Hack & Selvelli (1982), the O I] line is weak when present, blended with He II, and visible in two IUE high resolution spectra, SWP8940 (MJD 44365) and SWP10878 (MJD 44596).
-
•
CI Cyg: There is one GHRS spectrum, showing one of the strongest and most unusual O I] lines; the intensity relative to He II is very high. There is one published study (Mikolajewska et al. 2006) that discusses the O I], but it does not discuss the line formation. Possibly present in spectra during the mid-1990s.
-
•
V1016 Cyg: For the high resolution spectra, many are saturated at He II and partially mask any weaker emission lines, but the O I] line is apparent in spectrum SWP05612 and possibility detected in other spectra. Only a single G140L STIS spectrum is available from the archives, the resolution of which is insufficient to detect the O I]. The line variations are discussed in the next section.
-
•
V1329 Cyg: The O I] line is possibly present at a level just above the approximate continuum noise level for several spectra, especially in SWP29816.
-
•
AG Dra: O I] is strong, one STIS spectrum shows this perfectly. Weakly present in the red wing of He II 1640 in the spectrum SWP25444. The O I] line is, however, too weak to measure in the archival spectra and there is only one STIS spectrum (2003 Apr. 19, see Shore et al. 2010), for which the O I] 1641 flux is erg s-1cm-2 and the (O I 1302/O I] 1641) ratio is 10.2. Mikolajewska et al. (1995) propose a moderately small inclination and no eclipses.
-
•
RW Hya: Two GHRS and one STIS low resolution spectra show only a hint of O I], mainly as a redward-extended wing on He II that could mask the unresolved line.
-
•
SY Mus: High resolution spectra (including SWP14236) show the O I] line.
-
•
AG Peg: Two GHRS spectra give a possible indication of the line, but it is clearly weak. Possibly present in the spectrum SWP37420, the shortest exposure available.
-
•
RX Pup: There is one STIS spectrum but no detectable emission at O I]. An spectrum (SWP14240) shows the line.
-
•
HM Sge: Only high resolution are available, and there is a possibility that these show the O I] line.
-
•
RR Tel: The most studied of the symbiotic stars in this sample, spectra were taken with GHRS and STIS as a standard for calibration of wavelengths and comparisons between instruments. The O I] line is very strong. The line is also strong in spectra.
-
•
KX TrA: Weakly present in the spectra SWP38741, SWP38742.
2.2 Notes and correlations
For the stars AS210, S190, R Aqr, AE Ara, T CrB, BF Cyg, and AX Per the O I] line was either absent or too weak to measure in the available data, in all cases only spectra exist. Based on the available spectra mentioned, two-thirds of the symbiotic stars have shown the presence of O I] 1641. Among the remaining classical symbiotics from Kenyon (1986), Allen (1984), and Belcyński et al (2000), Y CrA, V443 Her, BX Mon, AR Pav, CL Sco, HK Sco, CL Sco, and AS296 have only low resolution IUE archival spectra, and are therefore not useful for detecting O I] 1641.

Although not measured in the previous studies (especially the outburst analysis by Shore et al. (1996)), the O I] line is detected in IUE high dispersion spectra of the 1985 outburst of the symbiotic-like recurrent nova RS Oph. In Fig. 3 we show three early spectra, from 10 days (SWP 25248), 25 days (SWP 25290), and 30 days (SWP 25328) after optical maximum. The O I] line is clearly detected in only one of these, SWP 25290, which was obtained during the broad-line phase of the permitted lines and when the inferred neutral column density was about cm-2 based on the Fe-curtain absorption (derived from the narrow line components of C IV, see Shore et al. (1996)). Its radial velocity is consistent with that of the binary system, km s-1. To our knowledge, the line O I 1.12895 m has only been identified in symbiotic and related star spectra by Evans et al. (2007), where it was recorded in post outburst spectra of RS Oph.

We show four examples of long term variability of this line in Fig. 4 for EG And, Fig. 5 for V1016 Cyg, Fig.6 and Fig.7 for RR Tel, and Fig. 8 for Z And. The precipitous drop in the RR Tel flux corresponds to a step in the visual magnitude light curve, obtained from the AAVSO website. Similarly, the spike in the Z And O I] flux corresponds to a spike in the visual magnitude light curve. The AAVSO visual magnitude light curve for V1016 Cyg shows a weak correlation with peaks in the O I] flux in Fig. 5. The sparser EG And data in Fig. 4 is more difficult to correlate with its light curve; however, the amplitude of the O I] flux is similar to the visual magnitude amplitude over a period that is similar to the 482 day period of its (orbit/pulsation). This latter is an eclipsing system in which the line of sight optical depth is so large, due to the absorption line and Rayleigh scattering opacities, as to obscure the entire region, including the O I] line. For non-eclipsing systems, the optical depth appears never to be so large that the O I], which is always optically thin, is not seen. As with the Raman feature, the line is formed close to the ionized-neutral interface in the red giant wind and for low inclination systems should always be visible.

Parimucha et al. (2002) have shown that the fluxes for resonance lines of ionized species (C III-C IV, N III-N V, etc.) in V1016 Cyg showed a well defined minimum at around MJD 47000. It is possible that the O I] line, which shows an almost lightcurve, may reach minimum strength slightly earlier.

The secular development of the O I] strength in RR Tel is the same as the slow decline of the magnitude, according to the AAVSO light curves, for the entire period of the measurements. In addition, since in this system the stellar radial velocity suffices to displace the O I 1302Å line from within the interstellar absorption, it is possible to study the long term variation of the 1302Å to 1641Å line flux ratio, shown in Fig. 7. There is an apparently asymptotic trend with F(1302)/F(1641) 0.4 at late times in the IUE data set. This flux ratio agrees with the STIS observations from almost a decade later.


The integrated flux variations of the 1641Å line for Z And (Fig. 8) shows a strong correlation with the long term optical variations (based on the AAVSO archive), especially the strong outburst between MJD 46000 and 47000. In the figure, the zero flux values are the conjunctions when it is heavily obscured (according to Friedjung et al. 2010) that were otherwise well exposed (not, as in several symbiotic stars, over- or underexposures that we have ignored in the analysis).
The HST data set includes extended wavelength coverage at high spectral resolution and signal-to-noise for the stars AG Dra, EG And, and RR Tel. This allows for a search of multiple lines from O I for the purpose of investigating emission line excitation mechanisms. STIS spectra for AG Dra extend from the vacuum UV to the red. Emission is observed for 1302, 1304, 1305, 1355, 1358, 1641. The 1304 line is nearly entirely removed by saturated absorption from the ISM feature Si II 1304.370, while the O I 1302 emission line is impinged upon by its saturated ISM counterpart (as an example we show the 1300Å region of AG Dra in Fig. 9). Several lines (2324, 8446, 9204, 9260) may have marginal detections, and no evidence exists for the presence of others (5577, 6300, 6363, 6391). The 2324 line is suspect due to broadening of the 2324 Å feature (C II + O I).

For EG And the data are limited to UV wavelengths, showing emission for 1302,1304,1305,1355, and 1358. Emission in O I 2324.738, if present, is blended with the emission feature C II 2324.69, which is one of five lines that comprise the C II UV2 2s2 2p 2Po - 2s 2p2 4P multiplet, all of which are found in emission. O I 1727.106 does not appear to be present. Emission is not found for lines at the longer wavelengths (2958, 2972) as the continuum flux of the cool star, the increased number of absorption lines, and the lower transition probabilities render these lines difficult to detect. The RR Tel data set clearly shows emission from O I 1302, 1304, 1305, 1641, 5577, 6300, 6363. The detection of 2324 line is complicated by blending with C II, with the lines of this multiplet not being in proportion to their relative values. Strong emission at 1025 is not evident (see below).
The O I] 1641 emission appears to be positively correlated with the O VI Raman emission at 6825, 7082. Based on ORFEUS spectra, Schmid et al. (1999) compared emission from the O VI 1032, 1038 Å resonance doublet with the Raman scattering features for six symbiotic stars. Of these six, five have UV spectra that can be searched for O I]. We find that the strongest O VI Raman emitters (AG Dra, RR Tel) are also the strongest O I] emitters, while three others (AG Peg, Z And, V1016 Cyg) present both weak O I] and weak O VI Raman lines. The O VI FUV doublet has two contributors, the white dwarf wind and surrounding ionized cavity within the red giant wind, that are Raman scattered by Ly absorption by the H I in the wind. The O I] line samples the same warm neutral H wind zone. Crowley et al. (2008), for instance, find that this lies about 1013cm (a small fraction of the semimajor axis of the system) from the white dwarf and it is in the cooler zone that both oxygen and hydrogen are neutrals. Since the O I 1302Å line arises from recombination in the H II region, whose boundary is virtually the same for the two species, the 1641Å line probes the same region as the Raman feature. During outburst events, for instance for Z And around MJD 46700 (Fig. 7), the O I] line notably and briefly strengthened and when the He II line was hidden by a sufficient optical depth in the Fe-curtain absorption the O I] was also obscured.
3 Discussion
Several fluorescence processes can lead to the population of levels that will ultimately lead to emission of O I] 1641 Å. Coincidence of H Ly 1025.722 with O I 1025.762 will populate the O I 3d 3Do (97488 cm-1) level from the ground level. The dominant decay chain (according to their Einstein transition probabilities, see Fig. 1) from the 3d 3Do level (11285 and 8446) will populate the 3s 3So (76794 cm-1) level, which subsequently decays through three channels (1302, 1641, 2324), two of which are commonly detected in symbiotic star spectra. In addition to the Ly O I pumping, McMurry & Jordan (2000) identified CO emission fluorescently-excited by O I UV 2 resonance line emission near 1302 in the UV spectrum of Tau.
A second pumping mechanism for the O I 76794 cm-1 level is He II 1640 for those stars which have a broad He II line. This is evident for RR Tel and EG And, and less so for RW Hya and AG Peg, in Fig. 2. Other possible pumping mechanisms that might lead to population enhancement of this O I level are: 1) H Ly 937.803 Å coincident with O I 937.841 to pump the O I 106765 cm-1 level, which can decay to the 76794 cm -1 level through the chain 14110, 4368 Å, among others. 2) H Ly6 930.748 and He II 930.342 can pump the O I 8s 3So 107497 cm-1 level, which decays to the 76794 cm-1 level through the chains 12790, 4368 or 5298, 8446. 3) C II 2324.69 emission is coincident with O I 2324.738 and can pump the O I 76794 cm-1 level from the metastable O I level 33792 cm-1. The five lines of C II multiplet 2 are seen in emission in a number of symbiotics and symbiotic novae (RR Tel). Direct excitation by the resonance line should, however, be more effective in symbiotics, as in the terrestrial case since the Ly lines are so optically thick and the illumination is from the companion, not in situ from the chromosphere (there will, of course, be a contribution from the spectrum of the late-type component but this is small compared to that from white dwarf environment).
Population of the O I 76794 cm-1 level via electron recombination is possible through additional decay chains. Spectral observations at infrared wavelengths may offer a means of determining the dominant excitation mechanisms by detecting other emission lines. The number of lines from the O I spectrum that have been observed in astronomical targets, in particular symbiotic stars and novae, are few. Common UV lines detected include transitions at wavelengths 1302, 1304, 1305, 1355, 1358, 1641. At optical wavelengths 6300, 6363 are found in planetary nebula spectra with 6300 commonly used for abundance analysis in cool stars. For near-IR wavelengths, detections, or suspicions of detections, have been mentioned for 8446 Å in AG Dra (Iijima et al. 1987), and 11289 (Evans et al. 2007). Absorption lines at 7771, 7773, 7774 are commonly used in abundance analysis in a variety of stars. There is also the curious appearance of an undiscussed weak emission line near 2.9 m (Schild, Boyle & Schmid 1992) in spectra of several symbiotics. Conspicuous by their absence from discussion and published spectra are lines of large transition probability (4368, 9204, 9260 for example) and small transition probability (1727, 2324, 2958, 2972). A full accounting of O I lines for any target would be useful for determining the excitation conditions and better enable the physical modeling.
The importance of the O I] 1641 line for the symbiotics is as a possible tool for as long as ultraviolet spectroscopy is available. Oddly, although this line has been included in a number of identification lists at high resolution, it has never been exploited as a diagnostic for symbiotics or related systems. It has, however, been noted as a contributor to the energetics of AGN when the O I resonance line is sufficiently optically thick. Grandi (1983), in discussing reddening determinations for AGN using the resonance and Bowen fluorescence O I UV2 lines (1302, 1304 vs 8446) noted that the line ratio O I] 1641 (UV146) to the resonance multiplet is often unusually large, given the branching ratio. This can be accounted for by a large enough optical depth to strongly self-absorb the ground state lines. With a Ly optical depth as large as the reduction in 1302 is sufficient to produce an integrated flux of only a factor of 2 larger than the forbidden transition. The inhomogeneous regions around the central engine often show such large opacities while still permitting observation of the nucleus along a given sight line. More recently, the chromospheric O I spectrum has been rediscussed for a few main-sequence and evolved F, G, and K stars by Koncewicz (2005) and Koncewicz & Jordan (2007). There is another mode to produce the O I] 1641 emission, the coincidence of Ly 1025.72 and the O I resonance line (UV4) at 1025.77 that pumps the 3Do 97488 cm-1 level , which then decays through the 11286, 8446, 1641, 6300 chain.
To date, however, most of the literature deals with the O I lines in the context of planetary – specifically, terrestrial – atmospheric structure and composition. Atomic oxygen forms in excited states by dissociative collisions between O2 and electrons. These transitions have been used for studying the oxygen abundance and temperature structure of the troposphere in a number of papers, e.g. Meier & Conway (1985), and Conway et al. (1988). Doering & Gulcicek (1989) include the 1355, 1358 lines. Since the O I] transition is always optically thin and absent in the reflected solar spectrum this transition probes almost the entire terrestrial stratosphere and ionosphere. The branching ratio (Garstang 1961, Erdman & Zipf 1986) is O I] 1641/O I 1302 = 5.110-6 with an uncertainty of 30% . The most recent compilation, Wiese et al. (1996), gives (1641)/(1302) = 5.410-6. Following Grandi (1983), based on escape probability formalism (Kwan & Krolik 1981), we can estimate the required column density in the resonance line. The observed branching ratio is 1 for all systems in which the O I] 1641Å line is detected in our survey, the implied optical depth for 1302 is , where is the oscillator strength and is the wind velocity in km s-1, that for a solar O/H ratio (, see Asplund et al. 2009) gives a column density NH 1023 cm-2 for the neutral absorption region. This is the same order of magnitude as the column density in absorption required to explain the narrow UV emission line variations during the early RS Oph outburst (Shore et al. 1996) and similar to that derived by Crowley et al. (2008) from eclipse spectra of EG And. Using the length scale from the photoionization modeling in Crowley et al. (2008), who obtain a standoff distance for the neutral region from the white dwarf in EG And of about 1013 cm, gives a characteristic number density of about 1010 cm-3. For a wind velocity of 50 km s-1 and using R13 =(R/1013 cm) gives an estimate of the mass loss rate for the red giant of 10-6 R213 M☉ yr-1. This estimate is different between systems (there are several with lower branching ratios, others with higher, and in many cases the stellar radial velocity is not sufficient to displace the 1302 line from within the interstellar absorption. The optical depth expected for the red-giant wind in the FUV O I doublet, combined with the opacity of the Ly transition, suggest that this is not a dominant mechanism in producing the 1641 line and that the O I opacity suffices.
Acknowledgements.
We thank J. P. Aufdenberg, K. Genovali, J. Mikolajewska, C. Rossi, and R. Viotti, and the (anonymous) referee for valuable discussions and suggestions. The and the GHRS and STIS spectra were obtained from the MAST archive of STScI and archival visual photometric data were provided by the AAVSO. GMW acknowledges support from NASA Grant NNG06GJ29G.References
- (1) Allen, D. A. 1984, PASAu, 5, 369
- (2) Asplund, M., Grevesse, N., Sauval, A. Jacques, & Scott, P. 2009, ARA&A, 47, 481
- (3) Aufdenberg, J. 1993, ApJS, 87, 337
- (4) Belczyński, K., Mikolajewska, J., Munari, U., Ivison, R. J., & Friedjung, M. 2000, A&AS, 146, 407
- (5) Bowers, C. W. et al. 1987, JGR, 92, 235
- (6) Conway, R.R., Meier, R.R., & Huffman, R.E. 1988, P&SS, 36, 963
- (7) Crowley, C., Espey, B. R., & McCandlss, S. R. 2008, ApJ, 675, 711
- (8) Doering, J. P. & Gulcicek,E. E. 1989, JGR, 94, 2733
- (9) Dumm, T., Folini, D., Nussbaumer, H. et al. 2000, A&A, 35, 1014
- (10) Erdman, P. W. & Zipf, E. C. 1986, GeoRL, 13, 506
- (11) Evans, A., Kerr, T., Yang, Bin, et al. 2007, MNRAS, 374, L1
- (12) Feibelman, W. 1997, PASP, 109, 982
- (13) Friedjung, M., Mikolajewska, J., Zajczyk, A., & Eriksson, M. 2010, A&A, in press (arXiv:1001.0310)
- (14) Garstang, R.H. 1961, AJ, 66, 284
- (15) Grandi, S. A. 1983, ApJ, 268, 591
- (16) Iijima, T., Vittone, A., Chochol, D. 1987, A&A, 178, 203
- (17) Johansson, S. 1983, MNRAS, 205, 71P
- (18) Johansson, S. 1988, ApJ, 327, L85
- (19) Kenyon, S. J. 1986, The Symbiotic Stars Cambridge: Cambridge Univ. Press
- (20) Koncewicz, R. 2005, in Proceedings of the 13th Workshop on Cool Stars, Stellar Systems, and the Sun, Eds. F. Favata, G.A.J. Hussein and B. Battrick, ESA SP-560, p.709
- (21) Koncewicz, R. & Jordan, C. 2007, MNRAS, 374, 220
- (22) Kwan & Krolik 1981, ApJ, 250, 478
- (23) McMurry, A.D. & Jordan, C. 2000, MNRAS, 313, 423
- (24) Meier, R. R. & Conway, R. R. 1985, GeoRL, 12, 601
- (25) Mikolajewska, J. Kenyon, S. J., Mikolajewski, M., Garcia, M. R., & Polidan, R. S. 1995, AJ 109, 1289
- (26) Mikolajewska, J., Friedjung, M., & Quiroga, C. 2006, A&A, 460, 191
- (27) Nissen, P.E., Primas, F., Asplund, M. & Lambert, D.L. 2002, A&A, 390, 235
- (28) Parimucha, S., Chochol, D., Pribulla, T., Buson, L. M. & Vittone, A. A. 2002, A&A, 391, 999
- (29) Pereira, C. B., Ortega, V. G., & Monte-Lima, I. 1991, A&A, 344, 607
- (30) Ralchenko, Yu., Kramida, A.E., Reader, J. and NIST ASD Team 2008, NIST Atomic Spectra Database (version 3.1.5), URL: http://physics.nist.gov/asd3.
- (31) Schmid, H.M. 1989, A&A, 211, L31
- (32) Schmid, H.M., Krautter, J., Appenzeller, I., Barnstedt, J., et al 1999, A&A 348, 950
- (33) Shore, S. N., & Aufdenberg, J. 1991, BAAS, 23, 942
- (34) Shore, S. N., Kenyon, S. J., Starrfield, S., & Sonneborn, G. 1996,ApJ, 456, 717
- (35) Shore, S. N., Wahlgren, G. M., Genovali, K., et al. 2010, A&A, 510, A70
- (36) Vogel, M. 1991, A&A, 249, 173
- (37) Walder, R., Folini, D., & Shore, S. N. 2008, A&A, 484, L9
- (38) Wiese, W., Fuhr, J.R., & Deters, T.M. 1996, Atomic transition probabilities of carbon, nitrogen, and oxygen: a critical data compilation, (American Chemical Society: Washington D.C.)