Ultraviolet variability of the mCP star 56 Arietis ††thanks: Based on data from the satellite.
Abstract
The spectrophotometric variability of the mCP star 56 Ari in the far-UV spectral region from 1150 Å to 1980 Å is investigated. This study is based on the archival IUE data obtained at different phases of the rotational cycle. The brightness of 56 Ari is not constant in the investigated wavelengths over the whole rotational period. The monochromatic light curves continuously change their shape with wavelength. The comparison of energy distributions at three phases show that the first minimum of light curves at phase 0.25 is replaced by the maximum for 1608 Å, but the second minimum of light curves at phase 0.65 absent in the spectral region between 1938 Å and 1980 Å. The variable broad features in the far-UV connected with a non-uniform distribution of silicon over the surface of 56 Ari influence substantially the light variations in the UV.
Key words: stars: chemically peculiar – stars: variable – stars: individual; 56 Arietis
1 Introduction
The mCP star 56 Arietis (SX Ari, HD 19832 HR 954) belongs to the Si-group. It shows light, spectrum and magnetic field variations with a relatively short period of 0.728 days first established by Provin (1953). Jamar (1978) investigated the ultraviolet spectral variations of six CP Si stars, including 56 Ari, by means of observations obtained from the Sky Survey Telescope (S2/68) on the TD1 satellite. In the case of 56 Ari, the author established that the short wavelength region is clearly in phase opposition with the remaining part of the spectrum with a null wavelength region at 1600 Å. Sonneborn & Panek (1984) and Stepień & Czechowski (1993) analysed the spectrophotometric behavior of this star, using the International Ultraviolet Explorer () data and the published visual spectrophotometric data. Sonneborn & Panek confirmed that the spectrophotometric variations above and below 1600 Å are roughly antiphased. The authors mentioned that the light curves at the various wavelengths show remarkable differences in exact phase and shape which indicate that the mechanism of flux redistribution is complex. On the other hand, Stepień & Czechowski pointed out that the variations in the visual spectral region are in antiphase to the UV variations, but there exists no null region in the spectrum of 56 Ari. Instead, the light curve changes continuosly its shape. Unfortunately the authors are restricted to a qualitative comparison of light variations in selected spectral bands only with variations of silicon and helium in visual spectral region. In the far-UV there are a number of features and spectral lines that are mainly responsible for variability of the fluxes in the spectra of CP Si stars. This may be due to the fact that authors have called the light curves ”monochromatic”, although they were determined by averaging the fluxes over intervals [-10, +10] Å for given . Moreover, the authors investigated only two series of the low-dispersion spectra obtained in December 1981 (17 SWP spectra) and other in February 1984 (7 SWP spectra). It should be that they did not study the variation of the flux around 1780 Å. This spectral feature may be also due to Si II, but this feature is not identified yet.
Many improvements were made to the standard processing of data along the years. The more relevant modifications are: 1) the use of a new noise model, 2) a more accurate representation of the spatial profile of the spectrum, and 3) a more reliable determination of the background. These, together with other modifications, were taken into account in the INES system developed by the ESA Observatory. The data from satellite are available from the INES Principal Center http://ines.vilspa.esa.es or from the INES National Hosts (Wamsteker 2000).
In this paper, the low-dispersion spectra of CP Si star 56 Ari are analysed using the final archive. Moreover, the variability of selected features in the far-UV can be established.
2 Observational data
2.1 spectra
Three series observations of 56 Ari obtained with Short Wavelength Prime (SWP) camera were received from the final archive:
-
•
the first one contains 19 low-dispersion SWP spectra obtained in December 1981,
-
•
the second one contains 13 low-dispersion and 5 high-dispersion SWP spectra obtained in February 1984,
-
•
the third one contains 8 low-dispersion and 6 high-dispersion SWP spectra obtained in August and September 1990.
In all cases, the large-aperture observational data were held.
In the archive, each high-dispersion image has an associated ”rebinned” spectrum, which is obtained by rebinning the ”concatenated” spectrum at the same wavelength step size (1.6764 Å/pixel) as low resolution data (González-Riestra et al. 2000). This data set represents an important complement to the low resolution archive, and it is especially useful for time variability studies. In our study, the ”rebinned” spectra from high-dispersion images of 56 Ari were used. Finally, we analysed 49 SWP spectra, distributed quite smoothly over the rotational period.
3 The period variations of 56 Ari
The rotational period of 56 Ari has been studied by various investigators over 48 years (see, e.g., Adelman et al. (2001)). Musielok (1988) found the increase in the rotational period of 4 s per 100 years from analysis of the and photometric data. Adelman & Fried (1993) and Žižnovský et al. (2000) noted slight variations of the amplitude and shapes even within the same photometric band. Recently, Adelman et al. (2001) studied all possible variations for this star from 1952 to 2000. They confirmed the increase in the rotational period, but with a rate of about 2 s per 100 years. The authors pointed out that there was an evidence for a second period of about 5 years attributed to the precession of the axis of rotation.
3.1 A possible long-term variations of 56 Ari
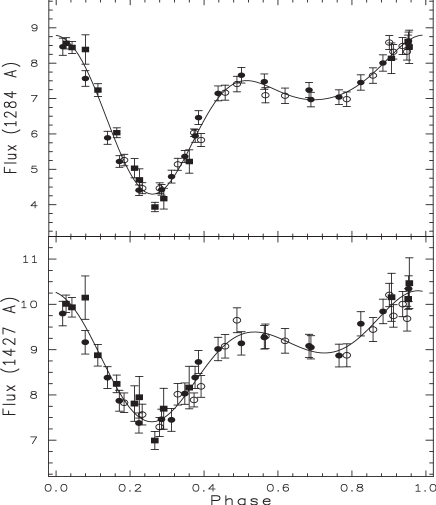
Three series of 56 Ari observations obtained with SWP camera cover about 9 years. This fact allows us to investigate a possible systematic differences between three sets of data in order to confirm or not the second 5 years period found by Adelman et al. (2001). Hence, we expect the maxima differences between three sets of data where the amplitudes of flux variations reaches the maxima values (see Sect. 4.2). One can see that there are not significant systematic differences between three sets of data, as illustrated by Fig 1. Generally, taking into account the observational uncertainties of the fluxes in the spectral region from 1150 Å to 1980 Å, it is impossible to confirm the second 5 years period found by Adelman et al. (2001).
3.2 The accepted period variations of 56 Ari
The period variation for 56 Ari are quite challengeable. Nevertheless, in our investigation the phases of the monochromatic light curves in the far-UV were computed by using ephemerides with constant and linearily changing period obtained by Adelman et al. (2001). Additionally, the ephemeris with constant period obtained by Adelman & Fried (1993) was used as well. It should be noted that the difference in the ephemeris with constant period is only in the epoch of the photometric light minimum. In the most cases the monochromatic light curves in the far-UV exhibit the maximum of the flux at phase 0.0 with the ephemeris of Adelman & Fried (1993):
| (1) |
With this ephemeris, the monochromatic light curves of 56 Ari show, as a rule, two maxima and two minima in the far-UV spectral region (Fig. 1). The phases for the observational data were computed using Eq. (1).
4 Data analysis
To analyse the spectra of 56 Ari we used the linearized least-squares method. An attempt was made to describe the light curves in a quantitative way by adjusting a Fourier series. This method is described by North (1987) and assumes that the shape of the curve has the form:
| (2) |
where = - and = 2/. The and are zero epoch and rotational period of the ephemeris, respectively. The coefficients of the fitted curves define the average energy distribution over the cycle of the variability. From several scans distributed over the period one can produce light curves at different wavelengths. In all wavelength the data could be fitted by Fourier series limited to =3, i.e. by the fundamental frequency and its first two harmonics. The least-squares fit was applied to separate short-wavelength monochromatic light curves.
4.1 Identification of the observed lines and features in the spectrum of 56 Ari
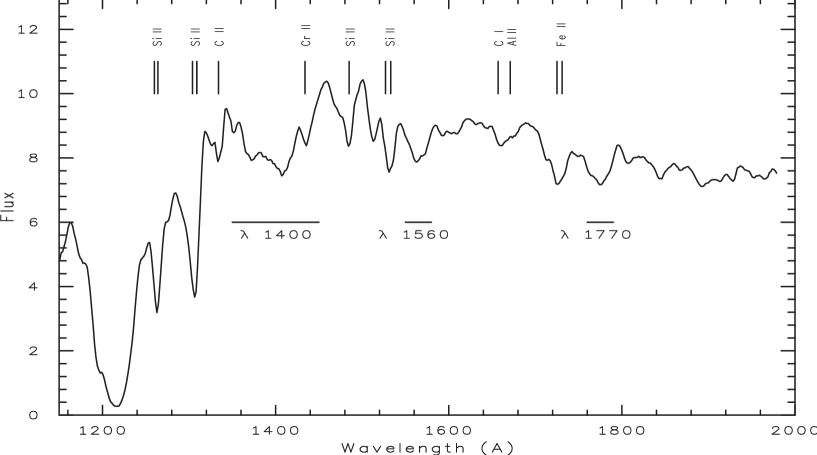
Figure 2 displays the average energy distribution of 56 Ari over the cycle of the variability in the spectral region from 1150 Å to 1980 Å. Prominent lines are indicated in Fig. 2 with their identification. One can see in Fig. 2 that Si II appears as the main absorber with the strong resonance lines at 1260-64 ÅÅ, 1304-09 ÅÅ, 1485 Å, 1526-33 ÅÅ, while the weaker one at 1808-16 ÅÅ is not detectable at this resolution. According to Artru & Lanz (1987), the strong lines in the spectrum of CP stars appear from C II at 1334 Å and Al II at 1671 Å, which is close to a strong C I at 1657 Å line. Fe II form a blend at 1725-31 ÅÅ and Cr II produces line at 1434 Å.
Three large features at 1400 Å, 1560 Å and 1770 Å, which are strongly enhanced in the spectrum of CP stars, are well seen in spectrum of 56 Ari. Lanz et al. (1996) gave strong arguments supporting the idea that the intense autoionization resonanses of Si II could explain the features at 1400 Å and 1560 Å in the spectrum of CP stars. On the other hand, they were unable to identify the depression at 1770 Å. Another element may cause this strong depression. It should be noted that the blend at 1304-09 ÅÅ has two major contributors: the resonance doublet and the autoionising multiplets (Artru & Lanz 1987).
4.2 The monochromatic light variations in pseudo-continuum
First, it is necessary to fix the continuum in the low dispersion data. This is very difficult in the far-UV due to the lines crowding. Nevertheless, One can find some high flux points located at the same wavelengths in several spectra of 56 Ari. It should be noted that such choice of the high continuum might be a ”pseudo-continuum”. But, there is no chance to reach the true continuum, if it occurs at higher wavelengths. Several monochromatic light curves in the ”pseudo-continuum” at different wavelengths were formed. The examples of light curves together with the fitted three-frequency cosine curves are shown in Fig. 3. Note the vertical scales differ for each part of the figure. In order to exclude overlaping, the curves at 1502, 1621 and 1906 ÅÅ were shifted down to the values of , and , respectively.
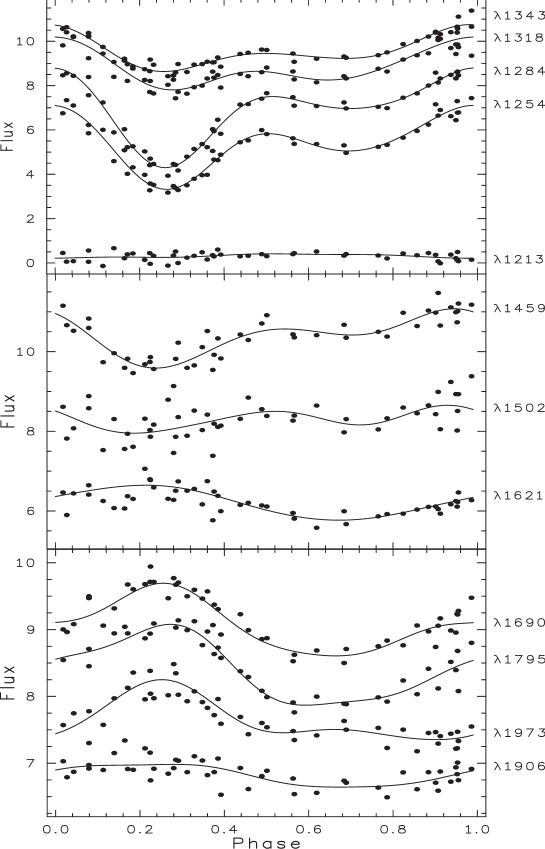
The light curves of 56 Ari change their shape with wavelength. All curves in the spectral region with 1600 Å have a similar shape: the primary maximum at phase 0.0, a deep minimum at phase 0.25, while a secondary maximum and minimum around the phases 0.5 and 0.65, respectively. It should be noted, that Stepień & Czechowski (1993) obtained a deep minimum at phase 0.8-0.9 and another one at phase 0.3-0.4 (see their Fig. 2). This disagreement may arise because they computed the phases with the old ephemeris given by Hardie & Schroeder (1963). The double-wave light variations in this spectral region are in antiphase to the variations in the visual spectral region (Adelman & Fried 1993). The exception is the core of line at 1213 Å where the amplitude of light variations is practically zero over the period of rotation. Another rapidly rotating CP star CU Vir displays the same behavior for the core of line (Sokolov 2000).
The amplitude of the minimum at phase 0.25 decreases with increasing wavelength, but at 1600 Å and beyond this minimum is replaced by a maximum. This maximum is seen up to 1980 Å, except for the cores of the blends at 1671, 1727 Å, the feature at 1770 Å and aroud 1900 Å, where the maximum disappears again (see Fig. 4). The second minimum decreases with increasing wavelength and then disappears at 1973 Å. At 1621 Å the amplitude of the two features is the same and, as a result, the cosine wave is seen at this wavelength. A very complex monochromatic light variations are detected in the far-UV of 56 Ari. The spectrophotometric behavior in the far-UV of the star CU Vir is quite similar. In the spectrum of CU Vir the first minimum is replaced by the maximum at 1611 Å and the second minimum disappears at 1962 Å (Sokolov 2000).
4.3 The null wavelength regions
The spectrum of 56 Ari is highly variable in the wavelength interval from 1150 Å to 1980 Å over the whole rotational period. This indicates that even when monochromatic light curves beyond a given wavelength are in antiphase to those in shorter wavelengths, we do not observe a truly ”null wavelength region” where the monochromatic light curve has a zero amplitude. Instead, it is possible to establish the wavelengths where the fluxes of the primary and secondary minima transform into the maxima. We will call this a local ”null wavelength regions”. Thus, the differences of the energy distributions between phases 0.0 and two minima reflect a dependence of the amplitude of light variations at phases of minima on wavelength.
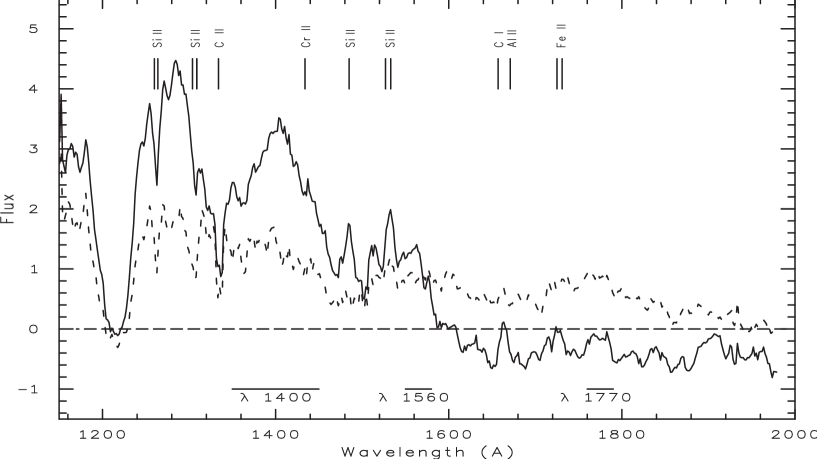
Using the coefficients of the fitted curves in each wavelength, the energy distributions at phases 0.0, 0.25 and 0.65 were computed. Figure 4 presents the differences in the fluxes between phases 0.0 and 0.25 and between phases 0.0 and 0.65 of the rotational period of 56 Ari. It is apparent from Fig. 4 that the first minimum at phase 0.25 is seen up to 1586 Å. The local ”null wavelength region” for the first minimum is located in the spectral region between 1586 Å and 1608 Å, where the fluxes at phases 0.0 and 0.25 are equal. For 1608 Å the first minimum is replaced by the maximum, except for the cores of Al II at 1671, Fe II at 1727 ÅÅ, the feature at 1770 Å and aroud 1900 Å, where the local ”null wavelength region” for the first minimum is seen again. On the other hand, the differences of the fluxes at phases 0.0 and 0.65 slowly decrease with increasing wavelength. The second minimum at phase 0.65 is seen up to the end of SWP spectrum, as illustrated by Fig. 4. The local ”null wavelength region” for the second minimum is reached in the spectral region between 1938 Å and 1980 Å, where the fluxes at phases 0.0 and 0.65 are equal. Note that the amplitudes of light variations at phases 0.25 and 0.65 reach the minimum values at 1340 Å and in the cores of Si II resonance lines at 1260-64 ÅÅ and 1304-09 ÅÅ.
For silicon-rich stars with the effective temperature of about 10000 - 15000 K, Si II becomes the major source of continuum opacity in spectral region with 1600 Å. Lanz et al. (1996) have shown that the Si II opacity is comparable to the H I opacity at many frequencies and can produce most UV features of these stars. The variability of the Si II continuum opacity could explain the deep minimum of the flux at phase 0.25 and its redistribution in longer wavelengths for the star 56 Ari. The amplitude of the first minimum at phase 0.25 reaches the maxima values of 45% and 65% in the large feature at 1400 Å and in the continuum at 1280 Å, respectively. The theoretical continuum spectrum which includes the Si II continuum opacity shows at this wavelengths the maxima values of the total continuum opacity (see Fig. 5 from Lanz et al. (1996)). Also, the minimum of amplitude (11.9%) at 1340 Å corresponds to the wavelength, where Si II continuum opacity is minimal. On the other hand, the differences of the fluxes at phases 0.0 and 0.65 slowly decrease with increasing wavelength. Probably, there are other blanketing source in the far-UV of 56 Ari. First of all, we should expect a close correlation between light variations and a non-uniform distribution of silicon on the surface of 56 Ari.
4.4 Variation of the broad features
Two broad features at 1400, 1560 ÅÅ are well seen in spectrum of 56 Ari, as illustrated by Fig. 2. Remembering the identifications detailed in Sect. 4.1, we have also included in our investigation the unidentified diffuse depression around 1770 Å (see Fig. 2).
To measure the total absorption in the broad features at 1400, 1560 and 1770 ÅÅ we have formed the photometric indices , and , expressed in magnitudes:
| (3) | |||
where all filters are 10 Å wide for the index and all filters are 7 Å wide for the and the indices. These indices are analogous to the index of Shore & Brown (1987). The equivalent width measurement is not the best way of determining the strength of the broad feature. Shore & Brown (1987) noted that there is more uncertainty associated with the equivalent width measurements than the impersonal photometry due largely to judgement exercised in the placement of the continuum. Therefore, that the equivalent widths are correlated with index is a useful result, since it means that one can rely on the automated procedure for measuring the total absorption at 1400 Å (see Fig. 4 from Shore & Brown (1987)).
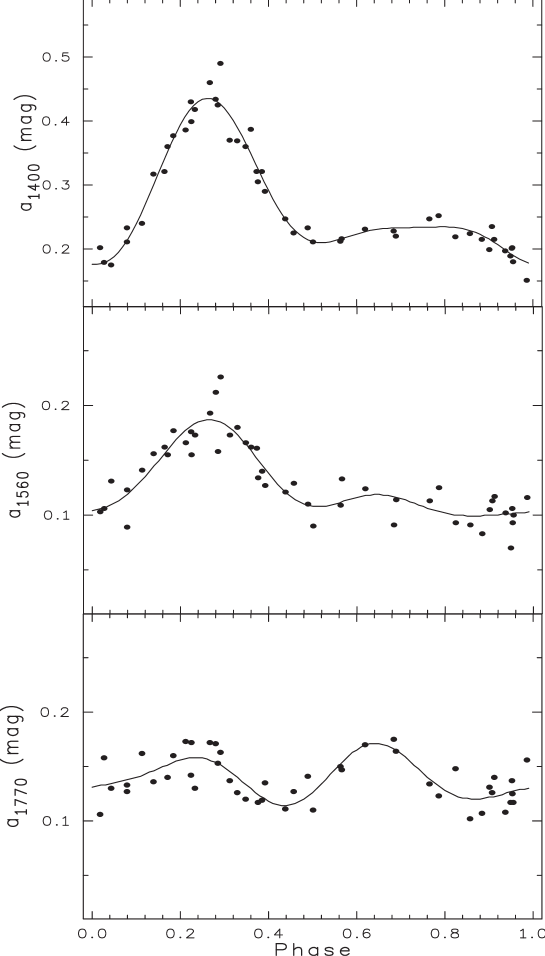
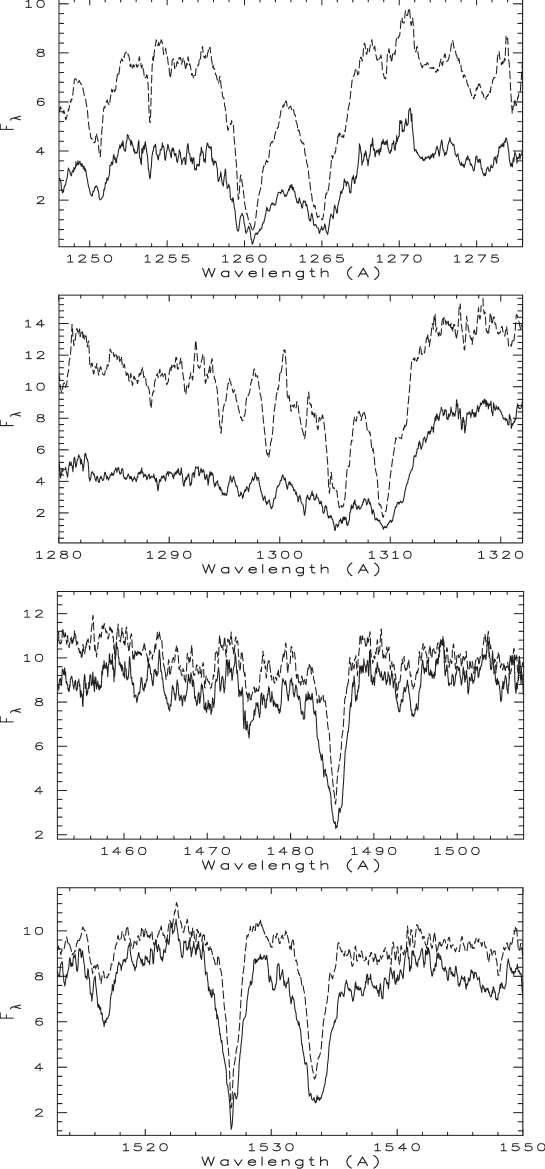
Figure 5 shows the variations of the measured total absorption in the broad features at 1400, 1560 and 1770 ÅÅ versus the rotational phase. The solid lines represent least-squares fits by three-frequency cosine functions. As one can see from Fig. 5, the deviation of the observational data from the fitted curve may be significant. The maxima deviations of the observational data from the fitted curves of the photometric indices , and are equal to 0.064 mag, 0.041 mag and 0.028 mag, respectively. The mean standard deviation of the residuals scatter around the fitted curve () were computed. For fitted curves of the photometric indices , and the are equal to 0.019 mag, 0.016 mag and 0.015 mag, respectively.
We should expect a close correlation between light variations and the variations of the UV features. In fact, the variability of the broad features is rather complex. Thus, the index shows the maximum around the 0.25 phase with amplitude of 0.25 mag. Note that, within errors, this index does not vary at phases 0.5-1.0. The index also shows the maximum around the 0.25 phase but with amplitude of 0.1 mag and it does not vary at phases 0.5-1.0 either. On the other hand, the index shows the primary maximum at phase 0.25 and the secondary maximum at phase 0.65. Both maxima have very small (0.05 mag) amplitude. Quantitative comparison of the monochromatic light curves with variations of the broad features shows that only variations of the primary minimum of light curves are in antiphase to the variations of the Si II features as if Si II were concentrated in one spot only. However, the monochromatic light curves are completely in antiphase to the index variations.
5 Discussion
Additional sources of variable opacity must be involved in order to explain the existence of the second minimum at phase 0.65 of the monochromatic light curves. At the first time, Panek (1982) noted that flux redistribution by no single element can explain the light variations at all wavelengths, although Si II dominates in the range 1150-1500 Å. Stepień & Czechowski (1993) investigated the influence of silicon, helium, and iron on the monochromatic light variations in the spectrum of 56 Ari. The authors noted that more quantitative comparison of the light variations with the variations of Si II 4128 Å shows some inconsistency. Also, they concluded that the variations of helium seem to have very little influence on the light variations and the assumed strict in phase variation of iron with silicon, as observations suggest, is probably an over-interpretation of the existing data.
Two different causes contribute to flux variability in the spectra of CP stars: variable line blocking and changes in the continuum flux. To illustrate the importance of the second cause in the spectrum of 56 Ari, we compare the energy distribution at the phases 0.0 and 0.25 using high-dispersion spectra. In this way, the regions of the Si II resonance lines were selected. The mean high-dispersion spectra were computed at the phases 0.0 and 0.25 using images SWP 39489, SWP 39678, SWP 39680 and SWP 22331, SWP 22333, SWP 39685, respectively. Figure 6 exhibits the mean high-dispersion spectra of 56 Ari in the regions of Si II resonance lines at the phases 0.0 and 0.25. The comparison of these two energy distributions show that in the regions of Si II resonance lines at 1260-64 Å and 1304-09 Å the variability of the Si II continuum opacity could explain the deep minimum of the flux at phase 0.25 for the star 56 Ari. Note that the exception is the cores of these Si II resonance lines where the variability of the flux is negligible. On the other hand, in the regions of Si II resonance lines at 1485 Å and 1526-33 Å the variability of the flux in the continuum is significantly less, but the profiles of these Si II resonance lines are more variable. This result supports the idea to use the low-dispersion spectra of 56 Ari in order to investigate the variability of the monochromatic light curves.
6 Conclusions
The archival spectrophotometric observations of 56 Ari permit to analyse the light variations in the far-UV spectral region from 1150 Å to 1980 Å and to compare them with the variations in the cores of the spectral features and lines. Although the double-wave light variations in this spectral region are in antiphase to those in the visual region, the spectrum of 56 Ari is highly variable in the wavelength interval from 1150 Å to 1980 Å over the whole rotational period. The first minimum of the light curves at phase 0.25 is replaced by the maximum for 1608 Å, but the second minimum of the light curves at phase 0.65 is seen up to the end of SWP spectrum. As a result, the monochromatic light curves continuously change their shape with wavelength. The amplitudes of light variations reach the minimum values in the core of line, where the flux is formed in the outer layers of the stellar atmosphere.
The variable broad features in the far-UV connected with a non-uniform distribution of silicon over the surface of 56 Ari influence substantially the light variations in the UV. The anticorrelation between the light variations in the far-UV and the silicon features intensity variations is caused by extra blocking of the flux in the far-UV and its redistribution in the longer wavelengths. Moreover the comparison of these two mean high-dispersion spectra of 56 Ari show that in the regions of Si II resonance lines at 1260-64 Å and 1304-09 Å the variability of the Si II continuum opacity could explain the deep minimum of the flux at phase 0.25 for this star.
References
- 1 Adelman S.J., Fried R., 1993, Astron. J., 105, 1103
- 2 Adelman S.J., Malanushenko V., Ryabchikova T.A., Savanov I., 2001, Astron. Astrophys., 375, 982
- 3 Artru M.-C., Lanz T., 1987, Astron. Astrophys., 182, 273
- 4 González-Riestra R., Cassatella A., Solano E, Altamore A., Wamsteker W., 2000, Astron. Astrophys. Suppl. Ser., 141, 343
- 5 Hardie R.H., Schroeder N.H., 1963, Astrophys. J., 138, 350
- 6 Jamar C., 1978, Astron. Astrophys., 70, 379
- 7 Lanz T., Artru M.C., Dourneuf M.Le., Hubeny I., 1996, Astron. Astrophys., 309, 218
- 8 Musielok B., 1988, IBVS, 3257
- 9 North P., 1987, Astron. Astrophys. Suppl. Ser., 69, 371
- 10 Panek R.J., 1982, Bull. Amer. Astron. Soc., 14, 876
- 11 Provin S.S., 1953, Astrophys. J., 118, 281
- 12 Shore S.N., Brown D.N., 1987, Astron. Astrophys., 184, 219
- 13 Sokolov N.A., 2000, Astron. Astrophys., 353, 707
- 14 Sonneborn G., Panek R.J., 1984, Bull. Amer. Astron. Soc., 16, 893
- 15 Stepień K., Czechowski W., 1993, Astron. Astrophys., 268, 187
- 16 Wamsteker W., 2000, ”The INES Newsleter”, ESA
- 17 Žižnovský J., Schwartz P., Zverko J., 2000, IBVS, 4835