Search for the Sunyaev-Zel’dovich Effect in a Giant Radio Galaxy B1358+305
Abstract
We present results of an imaging observation of the central region of a giant radio galaxy B1358+305. The classical, standard scenario of Fanaroff-Riley II radio galaxies suggests that shock produced hot electrons contained in a radio galaxy are a good reservoir of the jet-supplied energy from active nuclei. The aim of our observation is to search for the Sunyaev-Zel’dovich effect induced by these hot electrons. The observation was performed at 21 GHz with the Nobeyama 45-m telescope. Deep imaging observation of a wide region of size with the beam size enables the most detailed examination of the possible thermal energy of electrons contained in a radio galaxy. The resultant intensity fluctuation is 0.56 mJy beam-1 (in terms of the Compton -parameter, ) at a 95 % confidence level. The intensity fluctuation obtained with imaging analysis sets the most stringent upper limit on the fluctuations in the central region of a giant radio galaxy obtained so far, and our results will be a toehold for future plans of SZE observation in a radio galaxy.
1 Introduction
Extended lobes of radio galaxies are interesting as a probe of the energetics of active galaxies. In the standard model of radio galaxies of Fanaroff-Riley type II (FR-II; Fanaroff & Riley, 1974), radio lobes are formed by shock interactions of the jets with the surrounding intergalactic medium at the jet extremities (Scheuer, 1974; Blandford & Rees, 1974). In this scenario, radio lobes consist mainly of the jet-supplied matter that passed the termination shock. The gas density in the radio lobes is sufficiently low that radiative cooling is ineffective, resulting in the energy supplied to the radio lobes to be well conserved for the lifetime of the radio galaxy. The lobe has a higher pressure than the ambient intergalactic medium (IGM) due to shock-compression, and it can expand supersonically into the ambient IGM (“overpressured cocoon”: Blandford & Rees, 1974; Begelman & Cioffi, 1989; Nath, 1995; Heinz, Reynolds, & Begelman, 1998; Yamada et al., 1999). It is expected to form a shell of IGM matter compressed by the external shock exterior to the radio lobes.
Detections of inverse Compton scattered photons in the X-ray energy bands of radio galaxies can drastically improve our understanding of the properties of hotspots and radio lobes. The distribution of energy among the magnetic field component and in the non-thermal electrons has been investigated by examining the spectral energy distribution from the radio to X-ray bands (e.g., for Cygnus A, Harris, Carilli, & Perley 1994; Wilson, Young, & Shopbell 2000; for 3C123, Hardcastle, Birkinshaw, and Worrall 2001; for 3C295, Harris et al. 2000; for Pictor A, Wilson, Young, & Shopbell 2001; for 3C120, Harris et al. 1999; for 3C390.3, Harris, Leighly, & Leahy 1998). The results of these studies revealed that high energy electrons of have an energy comparable to or greater than that in the magnetic field (e.g., Tashiro et al., 1998; Grandi et al., 2003; Croston et al., 2005; Isobe et al., 2006, 2009). If the energy spectrum of non-thermal electrons is given by a power-law (), most of the non-thermal electron energy is carried by those electrons characterized by energies near the lower cut-off energy of for . However, direct measurements of the thermal and/or low energy ( or less) electrons are quite difficult, since the plasma density in a radio galaxy is too low to emit detectable radiation. The standard overpressured cocoon models of FR-II radio galaxies are characterized by two types of shocks, i.e., the external and the internal (jet-terminal) shock, where the latter is believed to be observed as hotspots. In this model, radio galaxies emit synchrotron radiation by shock accelerated electrons with an acceleration efficiency , which is inferred to be low ( and are energy of synchrotron-emitting electrons and total internal energy, respectively). If we adopt the standard model and assume the low acceleration efficiency in both shocks (low ), we can expect that a large amount of thermal electron energy, as well as non-thermal, synchrotron-emitting electron energy. In order to investigate the energetics of active galaxies, it is quite important to measure all of the energy in the electron component, including those that emitting strongly.
In this paper we employ the Sunyaev-Zel’dovich effect (SZE) as a tool to measure the energy of the electrons in a radio galaxy. The SZE represents the spectral deformation of the Cosmic Microwave Background (CMB) radiation due to the inverse Compton scattering of these photons by the energetic electrons (Zel’dovich & Sunyaev, 1969) in the galaxy. The intensity change of the thermal SZE is classically described as follows (Zel’dovich & Sunyaev, 1969);
| (1) | |||||
| (2) |
where is the non-dimensional frequency, is the temperature of the CMB, is the Boltzmann constant, is the electron kinetic temperature, is the cross section of Thomson scattering, is the electron number density, is the electron mass, and is the electron thermal pressure, respectively, integrated along the line of sight. Equation (2) shows that the Compton parameter is proportional to the sum of the thermal pressure of electrons along the line of sight. Therefore we can estimate the thermal energy of the electrons contained in a radio galaxy with the thermal SZE. Similarly, the decrease in CMB intensity by SZE in the Rayleigh-Jeans regime reflects all of the electron energy, not only the high energy electrons which generate X-ray photons, but also the lower energy electrons and the thermal electrons. Although the energy distribution of the electrons is lost in the SZE (Eq.[2]), it measures the total energy deposited in the radio galaxy. In this paper, we ignore the non-thermal and kinetic SZE as well as relativistic corrections and focus mainly on thermal SZE as the first trial observation (Birkinshaw, 1999; Enßlin & Kaiser, 2000; Yamada & Fujita, 2001).
The study of the SZE has been directed toward understanding the thermal properties of the intra cluster medium (ICM), and it has been detected in dozens of clusters of galaxies (see for recent reviews, Birkinshaw 1999; Carlstrom et al. 2001; Rephaeli 2002). Among the numerous SZE detections in clusters of galaxies, McKinnon et al. (1991) first tried to detect the SZE in the radio lobes with the NRAO 12-m telescope at 90 GHz using the double-subtraction method. They observed 4 FR-II radio galaxies whose lobe sizes were smaller than the beam size, and obtained upper limits on the antenna temperature fluctuation ( mK, or ). In this paper, we report on the results of the imaging observation of a giant radio galaxy B1358+305, extending much further in angular size than the beam size ( in our observation) using the Nobeyama 45-m telescope at 21 GHz. A two dimensional imaging study of a region in a radio galaxy is expected to provide the most reliable limit on the SZE in a radio galaxy by resolving the substructure within and the emission sources in the field of view.
The organization of the paper is as follows. In Section 2 we briefly review the overpressured cocoon model (see for detail, Yamada et al., 1999). In Section 3 we describe the features of our target B1358+305, and the observation and analysis procedures. In Section 4 the results are presented. We discuss the possible uncertainties in the estimation of the SZE amplitude in B1358+305 and their implications for radio galaxy models in section 5. Finally, we summarize our conclusions and future prospects in the last section.
2 Overview of Overpressured Cocoon Model
To provide an interpretative framework, we review our model of the overpressured cocoon (see for details Yamada et al., 1999), which is an extension of the classical overpressured-cocoon model of Begelman & Cioffi (1989). In this model, the jets from the AGNs form external shocks at the interaction with the surrounding IGM. Due to the action of the reverse shock (or internal shock), the jets are compressed. In the FR-II radio galaxies, the compressed jet matter at the locations of the internal shock is believed to appear as hotspots. The IGM compressed by the external shock is in pressure balance with the internal shock compressed jet matter at a contact discontinuity. A high pressure gas clump forms around the AGN, which expands supersonically into the IGM (Begelman & Cioffi, 1989; Nath, 1995; Heinz, Reynolds, & Begelman, 1998; Yamada et al., 1999). Hereafter we use the term “cocoon” as the region consisting of both the jet-supplied matter and the shock-compressed IGM throughout this paper.111Note that the definition of the term “cocoon” can change with different authors, and should not be confused with that defined herein. The cocoon expands as its internal energy, supplied by the jet, increases with time. In this paper, for simplicity, we first treat is a single free parameter that characterizes the cocoon, and assume that the cocoon has an approximately spatially uniform thermal electron distribution. Thus the parameter is to be taken as an appropriately intensity-weighted mean value over the cocoon, and hereafter we denote the mean value as . This assumption may not be fully consistent with current observations, but its simplicity can provide a basis for feasibility evaluation and interpretation as a first step (see Section 5.2 for the discussion of this assumption).
In these models, most of the matter that has passed through the shock is assumed to be almost fully thermalized except for a small fraction, which is assumed to be non-thermal. The density in the cocoon is insufficient for effective radiative cooling and, hence, the cocoon is expected to conserve nearly all of the kinetic energy of the jets. Furthermore, the cocoon is expected to remain hot for a relatively long time due to the low radiative cooling efficiency (an effective life time could be yrs or more: see Yamada et al., 1999). Even taking into account the work against the surrounding IGM, the cocoon would remain hot for yrs (Yamada et al., 1999). Therefore the energy contained in a cocoon can be written as
| (3) |
where is the kinetic luminosity of the jets, and is life time scale of the AGN (typically yrs).
For the thermal SZE as written (2) with the thermal pressure in the cocoon and the low value of , the total energy of the cocoon becomes which is proportional to (Eq.[2]). This estimate indicates that SZE, which is proportional to , provides a good measure of thermalized electrons and the jet-supplied energy contained in the cocoon. We employ this interpretative framework and attempt to measure the energy contained in electrons in a radio galaxy.
Since direct measurement of from observation is difficult, equation (3) is not used to estimate the expected value for the Compton parameter. Instead, we use the synchrotron emission argument and make the assumption that the synchrotron-emitting electrons are generated by diffuse shock acceleration with a small acceleration efficiency (again, we assume is the same for the internal and external shocks). The minimum energy of the synchrotron-emitting electrons can be estimated from the synchrotron luminosity using the minimum energy condition, which in the simplest form (Moffet, 1975) is given by
| (4) |
where is the ratio of energies of non-thermal protons and non-thermal electrons, is the photon index of synchrotron emission, and are the upper and the lower limits of observation frequencies, and is the volume of the synchrotron-emitting region, respectively. Once we obtain the minimum energy , we can estimate , where the inequality takes into account the larger internal energy compared with the minimum energy. If we adopt the small acceleration efficiency of the shock-accelerated electrons , the thermal electron energy contained in a cocoon is evaluated by Compton parameter as,
| (5) | |||||
| (6) |
along the line of the sight that passes through the center of the cocoon. Numerical values are based on the assumption that the axial ratio of the cocoon is 1:3 (Figure 1) and the adopted cosmological parameters ( km s-1 Mpc-1, , , Spergel et al. 2003). For the mean acceleration efficiency , we take the small value that is observationally suggested (: Sturner et al., 1997; Baring et al., 1999; Loeb & Waxman, 2000, e.g.,). The synchrotron-emitting electron energy in B1358+305 was estimated to be ergs cm-3 in the 10 MHz 10 GHz band by Parma et al. (1996) (Yamada & Parma, private communication), who assumed that the energy ratio of non-thermal protons and electrons, and the filling factor of the synchrotron electrons are equal to be unity. Note that equation (6) indicates the Comptonization parameter , or the amplitude of the intensity decrement of SZE is proportional to the length within the radio galaxy along the line of sight, so that a giant source can yield a large value of .
3 Observations and Data Reductions
3.1 Strategy of Search for SZE in a Radio Galaxy
Our basic plan of observation in search for the SZE signal in a radio galaxy and the feasibility evaluation are provided below. Compared to the case of galaxy clusters, the spatial extent of the cocoon relative to the radio lobes is less understood both theoretically and observationally (see McNamara & Nulsen, 2007, and references therein). We, therefore, develop the basic observational plan paying a special attention to the extent of the cocoon as follows.
1) The amplitude of the intensity decrement of SZE is proportional to the length along the line of sight (Eq.[6]). Hence a large radio galaxy should be selected as a target.
2) In order to reduce the cancellation of the intensity decrement of SZE by the emission from the radio lobes, the observation frequency should be higher than that used in the observations of the synchrotron emission of the radio lobes. Synchrotron emission has a power-law spectral energy distribution with a typical about 0.7, and its intensity decreases with in the GHz regime.
3) Taking into account the potentially wider spatial extent of the cocoon in comparison to the radio lobes that is assumed in the classical hydrodynamic models (e.g., Begelman & Cioffi, 1989), a wider region than the radio lobes should be mapped.
4) Since the expected signal of the SZE is weak and the cocoon structure is not well understood, substructures and emission sources within the mapped region should be carefully resolved and removed. To resolve the substructures and to take account of the proportionality of the parameter to the length scale along the line of sight (Eq.[6]), a giant radio galaxy whose angular size is also large should be selected as a target.
In addition to the point 2, the amplitude of the thermal SZE is known to be maximum at GHz (Birkinshaw, 1999), hence the first choice for the observation frequency is 90 GHz. However, the beam size decreases with the observation wavelength, and thus the observation frequency cannot be too high in order to perform the imaging observation of a wide region (the point 4) in a reasonable timescale. The beam size at 90 GHz of the NRO 45-m telescope is about 20′′, which is too small to image the large central region of B1358+305 () to achieve a reasonable signal-to-noise ratio within a realistic timescale (see discussion on the feasibility in Section 3.1.1 below). Additionally the atmospheric stability becomes worse for higher frequencies in this waveband, or the typical system temperature 250 - 900 K at 80 - 90 GHz is much higher than that at 21GHz ( 100 - 150 K). Hence, the required observational time becomes unrealistically long.
We chose the single-dish observation as the first trial rather than interferometric observation. This follows from the fact that the hydrodynamic models predict a smoother distribution of SZE compared to galaxy clusters (Begelman & Cioffi, 1989; Yamada et al., 1999). In other words, the smooth SZE signal would be resolved out if an interferometric observation were carried out. However, interferometric observations would be useful for detecting the SZE for more compact objects with known structures. In addition, high angular resolution observation with interferometers can also be used to remove emission source contaminations within a field of view. Both single-dish and interferometric observations have their advantages and disadvantages. In order to avoid the risk of resolving out of the possibly extended SZE signal, we use the single-dish observation strategy to measure the total flux.
Given these considerations and the low luminosity at 10 GHz, we decided to observe the central region of a giant radio galaxy B1358+305 with the NRO 45-m telescope at 21GHz. The typical beam size of the 45-m telescope is at this frequency. The low system temperature (typically 100 - 150 K) and a wide bandwidth (2 GHz) of the HEMT 22 receiver installed on the 45-m telescope led to a decrease in the necessary observation time for an SZE search in a faint giant radio galaxy. The detailed set-ups and observation method are described in Section 3.3 below.
3.1.1 Feasibility Estimation
The imaging sensitivity for the observation with the 45-m telescope at 21 GHz is about 7.55 mK , where the typical system temperature is taken to be 135 K, the aperture efficiency is estimated to be 0.8, and the bandwidth is taken to be 2 GHz for one of the dual channels, respectively. In order to obtain a 3 detection of the expected intensity fluctuation from equation (6) or 0.30 mK with the beam width in the central region, the imaging sensitivity estimated above requires an observation time of about 67.3 hrs.
The estimated observation time implies a deep imaging. As the expected SZE decrement in the B1358+305 is small, we examine the cumulative contributions from background (or foreground) discrete sources to the intensity fluctuation. Franceschini et al. (1989) calculated the expected fluctuations of the antenna temperature () as a function of beamwidth at 6 cm, produced by randomly distributed sources within a flux range (see Figure 3 in Franceschini et al. 1989). We assume that contributing sources have a spectral index on average (), and estimate the fluctuation of the brightness temperature at 21 GHz to be . In terms of Compton parameter, this temperature fluctuation corresponds to from equation (1). The evaluated confusion limit is only marginally smaller than the expected SZE (Eq.[6]). Hence in the data analysis procedure, emission sources in the field of view should be carefully removed from the integration.
3.2 The Giant Radio Galaxy B1358+305
B1358+305 is one of the largest radio galaxies of FR-II type at a moderate redshift (, Parma et al. 1996; Saripalli et al. 1996). Employing cosmological parameters for the -dominated flat universe (Spergel et al., 2003), its projected size amounts to 926 kpc, extending over in the plane of the sky (Parma et al., 1996).222Parma et al. (1996) estimated the size of B1358+305 to be 1.34 Mpc making use of cosmological parameters km s-1 Mpc-1 and . We update cosmological parameters in this paper. It has a relatively low radio luminosity (W Hz-1), and the spectral age was estimated to about 2.5 – yrs from the multi-band imaging observations (Parma et al., 1996). Parma et al. (1996) further calculated the advance speed of the shock head of B1358+305 as – ( is the lobe length, is the spectral age, is the speed of light, respectively). From the balance of the external ram pressure and the jet ram pressure, they concluded that the environment density of B1358+305 is quite low ( cm-3), and B1358+305 is overpressured even for transverse direction, for an ambient temperature as high as that of a typical poor cluster environment ( K). This makes B1358+305 a good target in the sense that it resembles the classical model.
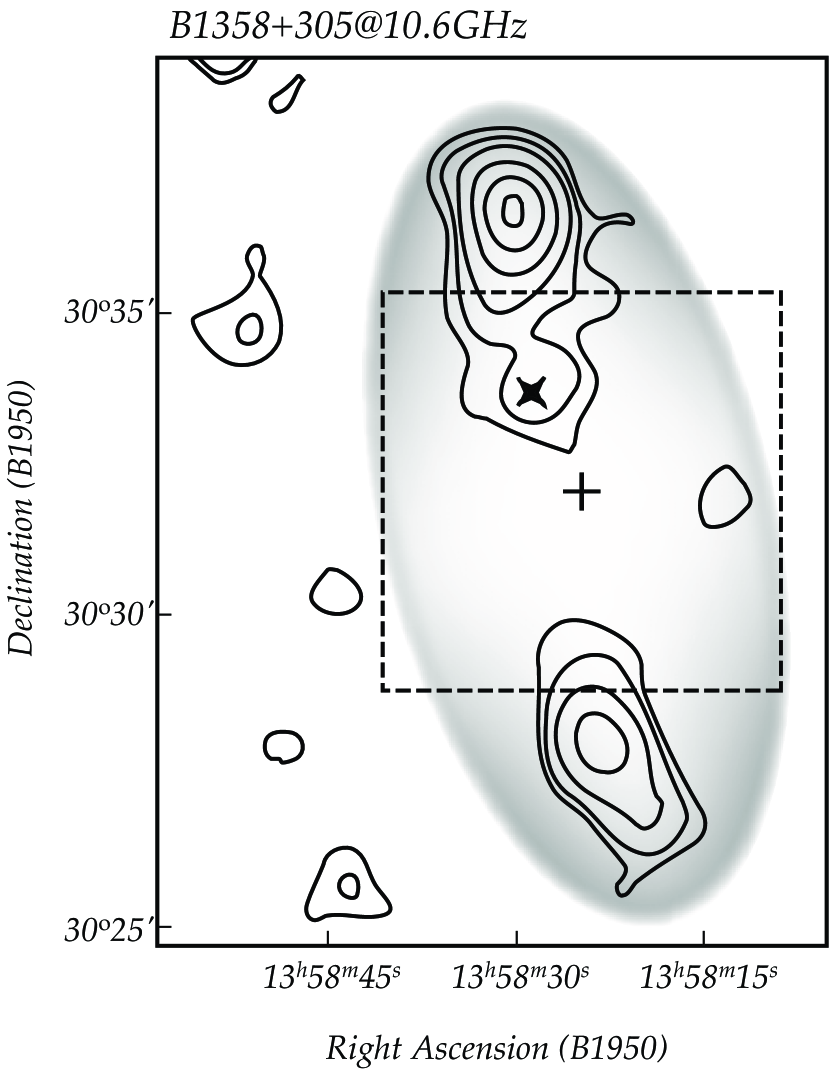
B1358+305 has an FR-II morphology with two aligned lobes with a radio core, which resides closer to the northern lobe. As SZE appears as the decrement of the CMB in the frequency range 200 GHz, any compensating radio emission should be avoided. Since the lobe intensity rapidly decreases towards the region slightly south of the core, we focused on that region in order to avoid the lobe emission contamination as much as possible (Figure 1).
3.3 Observations
Observations of B1358+305 were performed with the HEMT 22 receiver on the Nobeyama 45-m telescope from 2001 February 28 to March 18. The receiver has 2 GHz bandwidth, and is equipped with dual channels which can simultaneously receive two circular polarization components, which enables the reduction of the required observation time. The near-central region in B1358+305 of size around () was raster-scanned with spacing, which created a map composed of pixels. Since the jet axis is nearly along the declination, raster-scans were performed along the RA-DEC coordinates in turn. The scan speed is about s-1, resulting in the acquisition of one map in s. The exposure time was about 74.8 ksec in total, corresponding to 618 s for each pixel. The system noise temperature was about K on average, ranging from about just below 130 K to nearly 150 K. The noise produced by the fluctuations in the atmosphere were reduced by the simultaneous observation of an off-source point via the beam switching technique. The off-source point is about 400′′ away in azimuth direction to the east and was simultaneously observed at 15 Hz. The antenna temperature was calibrated using the chopper-wheel method, while the optical depths of the atmosphere were measured by elevation scans. Since the atmospheric optical depths were about 0.04 throughout the observing period, the flux was not corrected for atmospheric absorption. The main beam size was estimated to be by observing 3C273. With this beam size we can image a large () area in a reasonable timescale, simultaneously resolving the substructures in the mapped region. For the pointing and flux calibrator, we used 3C286 about away from the center of the image. The pointing offset was monitored about every hour, and was typically smaller than throughout the observing period. The flux of 3C286 was assumed to be Jy (Ott et al., 1994), and it was used to evaluate the aperture efficiency of the telescope. Due to the good weather conditions, the aperture efficiency was stable during the latter half of the observation period (rms of the flux variation is about 5%). In the former period, the stability was slightly worse (the flux variation reached about 10%), and we carefully corrected each observation using the efficiency measured just before the observation.
3.4 Data Reduction and Analysis
Raster-scans were performed in two orthogonal directions (along the right ascension and the declination coordinates) in turn in order to obtain pairs of orthogonally scanned maps taken as close together in time as possible. Within a raster-scanned map, antenna temperature fluctuations induced by the time variation of the atmospheric conditions, instability of the detectors or other instruments and so on, appeared along the scanning direction (scanning noise). The scanning noise in the data was reduced by combining the two orthogonally scanned maps in the Fourier space via the basket-weaving method (Sieber, Haslam, & Salter 1979; Kuno 1993).
Although we tried to avoid contamination from lobe emissions into the mapped region, some of the scans suffered from lobe emissions in the operation of beam switching. Due to the limited throw amplitude () and to the rotation of the position angle of the beam switch, emissions from one of the lobes entered into the reference field, resulting in over-subtraction in a part of the mapped region (less than 1/4 of the mapped area at most). This over-subtraction generated artificial intensity decrements. We identified the affected pixels in each scan and removed them in the integration. In the identification process, we made use of the 10.6 GHz map of Saripalli et al. (1996) (see Figure 1), and set the position of the reference beam away from the main beam. Since at 21 GHz both lobes are expected to be dimmer than displayed in the map in Saripalli et al. (1996) (the spectrum is a decreasing function of frequency), the procedure above does not overlook the affected pixels. Due to this partial masking in the integration, the noise level is not uniform in the obtained integrated map, ranging from 0.72 mJy beam-1 to 1.2 mJy beam-1 (1 level): in spite of the loss of some pixels, however, the root mean square of the intensity in the integrated map reached 1.22 mJy beam-1 with emission sources.
In order to evaluate the noise level without emission sources, we constructed two independent maps by dividing the maps taken in the former and the latter halves of the observing period, and subtracted the latter from the former. In this process, emission from true sources should cancel out and the resultant map should contain only random noise. The rms fluctuation of the differential map constructed in this way is 1.01 mJy beam-1.
4 Results
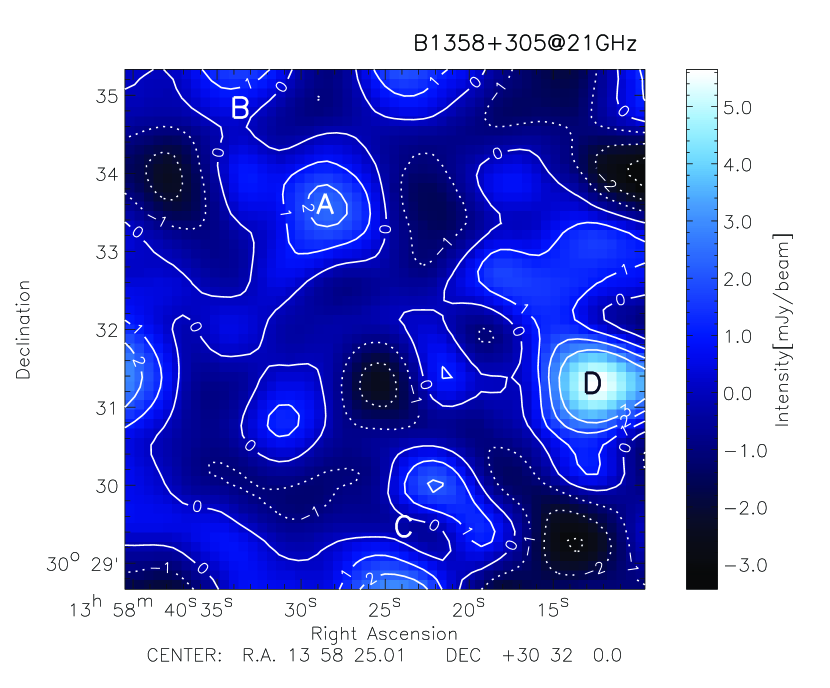
Figure 2 shows the integrated map of the central region of B1358+305. One can easily identify the AGN component and the innermost edges of the two radio lobes in this figure, which appear also in Figure 1. On the right edge of the map exists a bright region, with a peak intensity of mJy beam-1 (source “D”). We failed to find any identified source corresponding to this bright spot in any catalogue from the radio to X-ray energy band, though, it indeed appears on the VLA NVSS 1.4 GHz map and the Effelsberg 10.6 GHz map obtained by Saripalli et al. (1996). Taking into account a relatively large beam size (), we recognize it as an unknown point source.
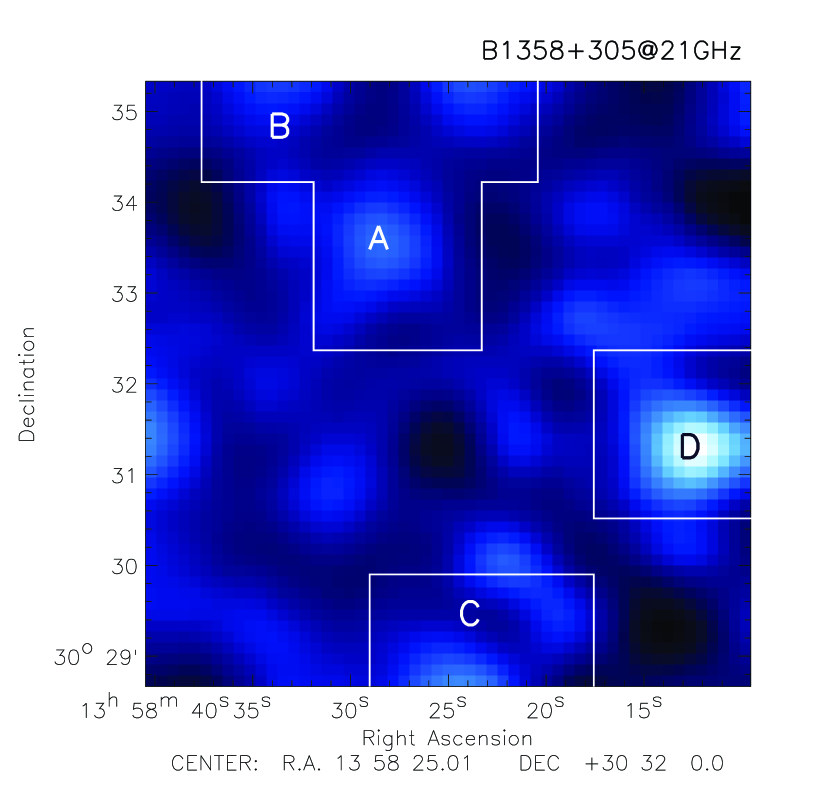
Since emissions from the sources smear out the SZ flux decrement, it is necessary to subtract them from the map. However, it is quite difficult to obtain the correct zero flux level for mainly two reasons. One is related to the larger uncertainties in models of cocoons in comparison with clusters of galaxies. In the case of a galaxy cluster, a well-established model obtained by X-ray observation (so-called model) is available. Thus, one can set the baseline (zero flux level) at a sufficient distance (; see e.g., Komatsu et al. 2001) from the center with the help of the X-ray observation. On the other hand, in the case of the theoretical model for the cocoon, there are many uncertainties in its morphology. For example, the density distribution of the surrounding medium (e.g., Kaiser & Alexander, 1999) or the magnetic fields alter the shape of the cocoon (see Burns, Norman, & Clarke 1991 for a review of numerical simulations, and for examples of MHD simulations, see e.g., Clarke, Norman & Burns 1986; Lind et al. 1989). The other reason is that our deep imaging of this region approaches the confusion limit, so the background fluctuation impedes the establishment of a definitive zero flux level (see Section 3.1.1). Therefore, we could not ascertain the absolute intensity of the sources included in the map at 21 GHz, and it is difficult to correctly subtract the emission from the true emission sources. Instead we evaluated the intensity fluctuation in the mapped region, and re-defined the baseline so that the average fluctuation became zero. In order to calculate the intensity fluctuation, we masked the emission source regions. These regions around the emission sources are indicated by white lines in Figure 3. The baseline of the map is re-defined after the source removal so as to set the average intensity of the remaining pixels to be zero.
4.1 Structure of the Cocoon
In order to improve the effective signal-to-noise ratio, we constructed projections of the two-dimensional map along two orthogonal directions. We can also expect that these projections reflect the structure of the cocoon more clearly than the original two-dimensional map if the data contains the SZE signal from the cocoon of B1358+305. As can be seen in Figure 1, the jet axis is almost perpendicular to the right ascension. Thus, we can examine the structure perpendicular (parallel) to the jet axis by projecting the map along the declination (right ascension) coordinates. In the process of projection, we average the pixels along each column or row without using the masked pixels corresponding to the emission sources that are indicated with the white lines in Figure 3.
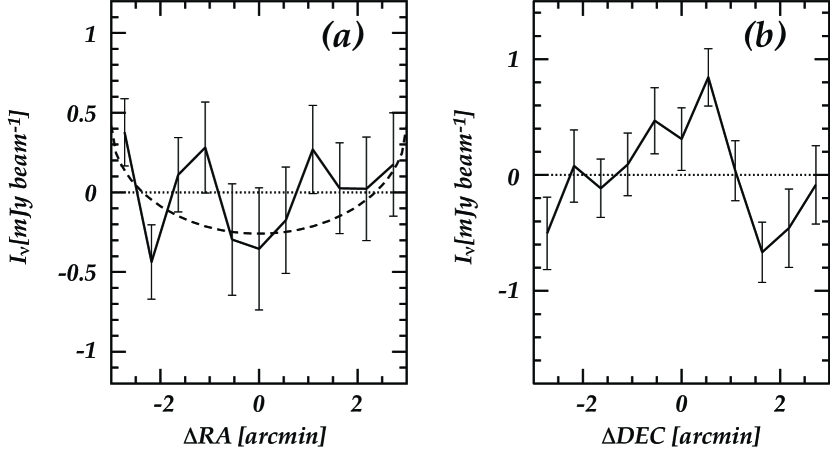
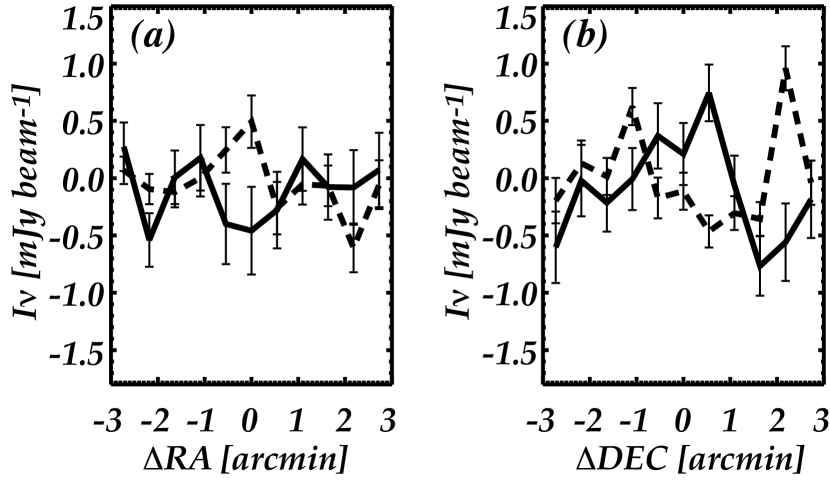
Figure 4 (a) shows the projection along the jet axis (the declination coordinate). A relatively dark region appears at about west of the central column. Comparing Figure 4 (a) with the original two-dimensional map (Figure 2), one can see the decrement appearing in Figure 4 (a) mainly picks up the dark region between the unidentified source labeled “D” in the map and the AGN (labeled “A”). However, as the statistical errors are large (error bars in Figure 4 correspond to ) even though they are reduced by in averaging over each column ( is the number of pixels included), we cannot rule out the possibility that the projection obtained here is consistent with a flat distribution (no SZE signal accompanied B1358+305). As shown in Figure 1, B1358+305 has a relatively large axis ratio, and it is reasonable to approximate it as a cylinder with an axis along the jet axis. Hydrodynamic simulations (e.g., Loken et al., 1992; Kaiser & Alexander, 1999; Scheck et al., 2002) show that the pressure is nearly uniform inside a cocoon when the density distribution of the surrounding IGM is nearly flat (there will be a difference in at internal and external shocks, and accordingly would not be spatially uniform as is suggested by observation, but this assumption is discussed separately in Section 5.2 below). Since (Eq.[2], where is the length cut through the cocoon along the line of sight), the projection along the jet axis is expected to present in the isobaric cocoon, where is the angular distance projected onto the sky from the map center. For a cylindrical cocoon, therefore, the intensity decrement is proportional to . We overplot the expected profile () based on equation (6) with fiducial values on Figure 4 (a) as a dashed line, offset so that the average intensity is equal to zero. The obtained distribution is not inconsistent with the expected one or with the flat distribution. This implies the dominance of the statistical errors over the signal reflecting the possible cocoon structure in the observed region. We estimate the standard deviation from the flat distribution,
| (7) |
which sets the upper limit at the 95% confidence level (Eq.[1]).
We further examine the allowed upper limit for a Compton parameter by a chi-square test of the data for the projection along the jet axis and the expected profile from a cylindrical cocoon model . We find that as long as 0.32 mJy beam-1 (or ), these two distributions can agree at the 95% confidence level. Herewith we denote these as and .
We have also constructed the projection onto the jet axis. If the cocoon has a prolate figure and lies in the plane of the sky, the pressure scale length along the jet axis is larger than the declination range of the observed field (see Figure 1). Hence, the projection onto the jet axis would display a more moderate decrement in contrast with the projection along the jet axis.333If the jet axis is not straight or the inclination angle is not small, the projected profile will be different from the one described here. However, Parma et al. (1996) concluded that a bend of the jet or the inclination are not so significant, from the contrast of the intensity of northern and southern lobes. Figure 4 (b) shows the projection onto the jet axis. There clearly exist a peak about north of the central row and two decrements toward both edges, which are not consistent with the expectation from the isobaric cocoon model filled with thermal electrons (Section 2). These decrements are due to the two dark regions north and south of the unidentified source “D” (at around : see Figure 2). The standard deviation from a flat distribution derived from the projection in this direction (onto the jet axis) is 0.44 mJy beam-1, which is larger than the statistical error estimated from the noise level of the original two-dimensional map in the process of the projection (, mJy beam-1 on average). Even though the dark regions appearing in Figure 4 may indeed suggest the existence of SZE signals, we cannot rule out the possibility that these are not due to B1358+305.
In order to examine the dominant source of the fluctuations in Figures 4 (a) and 4 (b), we analyzed the differential map in Section 3.4 in the same manner as the total map. Specifically, the differential map was constructed by dividing the observation period into the former half and the latter half. Figure 5 shows the fluctuations in the projections of the differential map overplotted with dashed lines on the total map (solid lines, the same as Figure 4). The projections on the both axes have similar amplitudes (the rms of the projection along the jet axis is 0.27 mJy beam-1 and the projection onto the jet axis is 0.43 mJy beam-1) as those of the total map, but their distributions do not resemble the total map. Taking into account the fact that real signals, including foreground or background emission sources in the field of view, do not appear in the differential map, we conclude that the fluctuations in Figure 5 are largely caused by the excess atmospheric noises at 21 GHz.
5 Discussion
Due to the lack of definite information about the position of the edge of the cocoon, it is difficult to define a concrete baseline. For this reason we evaluated the relative variation of the intensity in the map. In order to improve the signal-to-noise ratio, we made two projections on orthogonal directions. A differential map analysis in Section 3.4 shows that the main source of the relative fluctuations in these projections is the excess atmospheric noise rather than the true SZE signal induced by the hot electrons in B1358+305.
We discuss possible factors that may reduce the true amplitude of SZE in B1358+305 in comparison to the estimate with equation (6), including a non-uniform distribution of thermal electrons. In addition, the degree to which our results can affect the previous studies on pressure balance of B1358+305 (Section 5.3) is examined. Finally, we direct attention on radio galaxies in clusters of galaxies to demonstrate the usefulness of the SZE as a probe of the energetics of radio galaxy in a more general sense to guide future observations. It is to be emphasized that the intensity fluctuations discussed in this section should not be confused with a true SZE signal in B1358+305, but only as a rough guide for a quantitative discussion.
5.1 Thermal Evolution of the Cocoon
The expected amplitude of SZE is estimated using a steady mean acceleration efficiency (Eq.[6]). If is significantly different from assumed, the expected value of is also affected. In particular, different cooling timescales for the thermal and non-thermal electrons may alter from the fiducial value (=0.05 in Eq.[6]) in time, especially in the central region where the oldest population is contained. Since an underestimate of leads to the overestimate of the expected amplitude (Eq. [6]), we examine whether the different cooling timescales for the thermal and non-thermal electrons can significantly alter using a simple argument about exhaustion of the internal energy. Since the cooling timescale is strongly dependent on the electron energy , we discuss synchrotron electrons of high ( or more) and thermal electrons ( at keV) separately.
Parma et al. (1996) derived the spectral ages of the non-thermal electrons for both the northern and southern lobes using the compiled multi-frequency observation of B1358+305 from 325 MHz to 10550 MHz, finding the break frequency to be 2.4 GHz from the integrated spectral energy distribution. Further fitting of the multi-frequency images with the energy loss formula including synchrotron and CMB inverse Compton losses leads to spectral ages of for B1358+305 in the range yrs yrs. Since the synchrotron cooling timescale and inverse Compton cooling timescales are proportional to , lower energy electrons have a longer cooling timescale. The simple scaling of the above estimation by Parma et al. (1996) indicates that an electron that emits 325 MHz synchrotron light has a spectral age of about a few times of yrs, or even in the extreme case yrs at best. We adopt yrs as the typical cooling time scale for the non-thermal electrons.
On the other hand, a relativistic Maxwellian distribution of high temperature thermal electrons,
| (8) |
spans over for 100 keV (where is the second order modified Bessel function, , and is the non-dimensional electron temperature). We estimate the cooling timescales following Sarazin (1999). Inverse Compton scattering of CMB photons, synchrotron self-Compton scattering, Coulomb cooling, and bremsstrahlung are taken into account as cooling processes. The density of the IGM and in B1358+305 is quite low ( cm-3; Parma et al. 1996), and thus bremsstrahlung and line cooling are negligibly small compared with the other processes. In this low energy regime () and in the very poor environment (the density of the surrounding IGM was estimated to be cm cm-3; see Table 3 of Parma et al. 1996), the major cooling mechanisms are inverse Compton cooling and the Coulomb cooling, but the cooling time is longer than the Hubble time ( yrs). Therefore, the thermal energy of electrons is conserved for a typical cooling time of the synchrotron electron ( yrs). Even if we adopt a cooling timescale for electrons that radiate low frequency 325 MHz photons ( yrs), it is unlikely that the cooling time of thermal electrons is lower than that of non-thermal electrons. In other words, as long as the radio lobes of B1358+305 are bright in synchrotron emission, the thermal energy of electrons in B1358+305 does not change in time. Therefore, it is unlikely that the lack of the detection of an intensity decrement in B1358+305 is attributable to the loss of thermal electrons by cooling.
In addition to the cooling processes described above, some models emphasize the importance of adiabatic expansion (Ito et al., 2008) or backflows of jet matter that escapes thermalization at the shock interaction (Scheck et al., 2002). These models predict a lower thermal pressure of electrons than the model of Begelman & Cioffi (1989). Quantitative evaluation of these effects has yet to be determined, but it is to be noted that our model tends to overestimate the thermal pressure of the electrons in a cocoon. If these effects that reduce the thermal pressure of electrons are significant in the evolution of a radio galaxy, much more sensitive observations will be necessary.
5.2 Non-Thermal Electrons in Radio Lobes
In this paper, we adopted a model based on the classical overpressured cocoon model with a constant and uniform mean shock acceleration efficiency , and a uniform distribution of thermal electrons within a cocoon as the simplest and most optimistic interpretation of the observation (Section 2). However, in spite of the search for X-rays in radio galaxies in galaxy clusters, the clear evidence for non-thermal electron acceleration at the external shock has not been found except for objects such as Cen A (Croston et al., 2009). Although this lack of clear evidence may reflect the limited observational sensitivity or angular resolution, the uncertainty in determining is also likely to contribute. Especially, at the internal shock or termination shock of the relativistic jets, can be as large as close to unity, while at the non-relativistic external shock is much smaller. In this case, the radio lobes within the shocked shell would have only a small population of thermal electrons, whereas the shocked shell has a large fraction of thermal electrons as in the first adopted model (Section 2).
The spatial SZE profile of this model would differ significantly from that adopted (see Section 4.1). The amplitude of SZE caused by non-thermal power law electrons depends on the parameters describing the electron energy distributions (e.g., the power law index, the lower and upper cut-off energies, and the break energy if any). The ratio of thermal and non-thermal SZE amplitudes is consequently dependent on these parameters. If the non-thermal SZE amplitude is much smaller than thermal SZE in the radio lobes, the SZE spatial profile for this case would not reflect the length passing through the cocoon, but the length passing through the shocked IGM shell. Therefore, it may have a flatter SZE distribution as compared to that in Section 4.1 (). This possibility makes the detection of SZE much more difficult (see e.g., Pfrommer, Enß lin & Sarazin, 2005; Colafrancesco, 2008; Hardcastle & Looney, 2008). On the contrary, it may also be possible that the non-thermal SZE amplitude is similar to the thermal SZE. In this case, the spatial profile does not differ from that in Section 4.1, and detection of SZE is unlikely to be significantly more difficult compared with the cocoon model filled with thermal electrons (Section 2). Multi-frequency observation will be necessary to discriminate these distributions (see Section 5.4 below). Additionally, it is possible that a mature giant radio galaxy does not expand supersonically in the lateral direction (e.g., Konar et al., 2009). In this case, the SZE signal peaks at the head of the external shock and decreases toward the central region where we observe (see below). Since the diffuse shock acceleration efficiency problem remains to be solved, we cannot exclude either of these scenarios with different acceleration efficiencies. In order to solve this problem and to obtain a deeper understanding of the subsequent dynamical and thermal evolution of a radio galaxy, progress in both theoretical studies of shock acceleration efficiency and higher sensitivity observations will be required.
Radio images and some X-ray images of radio galaxies suggest that the central region close to the nucleus lack the energetic electrons that many hydrodynamic models suggest. If this applies to B1358+305, our results would correspond to genuine atmospheric noise. However, the X-ray images of a FR-II radio galaxy MS0735+74221 and Cygnus A show extended diffuse X-ray emissions that fill the central regions (see for a review, McNamara & Nulsen, 2007, and references therein). In addition, Hardcastle & Looney (2008) observed bright FR-II galaxies at 90 GHz with the BIMA, and found that some of their sample (3C 20 and 3C 388) have extended emissions that cover the central regions. Although there are ambiguities in the distributions of the thermal and synchrotron electrons, these results imply that some FR-II radio galaxies seem to have electron populations at the central regions away from the jets and hotspots. We cannot tell if B1358+305 is deficient of electrons because of a small number of past observations or limited sensitivity of our results. Hence we conclude that our results are largely due to atmospheric noise, but we cannot completely rule out the small SZE signal in B1358+305, and much higher sensitivity is required in future observations.
5.3 Expansion of B1358+305
Since only upper limits on the parameter were obtained. we compare our results with past studies of B1358+305 in the case where (1) the true pressure is close to that derived from the upper limit, and (2) the true pressure is significantly lower than the obtained upper limit.
Consider the first case. Since the observed region does not extend over the entire cocoon, the perpendicular projection onto the jet axis will show a flatter intensity distribution than the parallel projection (i.e., the pressure scale length along the jet axis is longer than the declination range of the observed field: see Figure 1). Hence, it is more easily subject to the contamination from the background emission sources and the excess atmospheric noise. On the other hand, the right ascension range of the observation is expected to be comparable to the cocoon width and the parallel projection along the jet axis is expected to represent the structure of the cocoon (Section 4.2). Therefore, we employ the upper limit of the parameter calculated with the projection along the jet axis ( mJy beam-1, or ) in the discussion below. If we assume that the obtained intensity fluctuation accompanies B1358+305, then the electron pressure derives dyne cm-2 (Eq.[6]) for =300 kpc. If we take values obtained by the chi-square test , the equivalent electron pressure becomes dyne cm-2. On the other hand, Parma et al. (1996) deduced the jet ram-pressure to be dyne cm-2, which is comparable to the equipartition value under the assumption that B1358+305 expands supersonically. This result is quantitatively consistent with Parma et al. (1996) in the sense that B1358+305 expands supersonically against the surrounding IGM. However, the results obtained using the upper limit in our observation ( dyne cm-2) are almost double the result of Parma et al. (1996) ( dyne cm-2). This difference would come from the assumed parameter value (Eq.[6]), and may imply a larger mean acceleration efficiency () in B1358+305 and significant contribution from non-thermal SZE of smaller amplitude than thermal SZE.
Since the intensity fluctuations obtained turned out to be dominated by the excess atmospheric fluctuations, however, it is also possible that the true thermal electron pressure in B1358+305 is much lower than that calculated with or (the case (2)). Because B1358+305 resides in a poor environment, it is difficult to directly measure the IGM pressure around it. Instead we estimate the external pressure under the assumption that the environment resembles an extremely poor galaxy cluster or a group of galaxies, and assume the IGM temperature to be K. For the density, we can take the cosmological baryon density at the redshift as the reference value, and describe the IGM density with a density excess parameter , cm-3 (Spergel et al., 2003), which sets the lower limit to the IGM pressure to be dyne cm-2. In this case, if the true thermal electron pressure in B1358+305 is less than of that inferred from our upper limit, it indicates that thermal electrons do not play a major role in supporting the radio lobe against the external pressure. We note that this conclusion strongly depends on the estimate of the IGM pressure and the SZE measurement. Deeper X-ray observations for the pressure determination of the IGM and much sensitive SZE measurement are required to be more conclusive.
5.4 Comparison with X-ray Observations of Radio Galaxies in Clusters of Galaxies
Finally, we discuss the X-ray observations in conjunction with the SZE in radio galaxies as effective means of probing the pressure of a cocoon (also see Pfrommer, Enß lin & Sarazin, 2005). The observations by ROSAT and Chandra satellites have revealed that radio lobes of radio galaxies centered at the cluster of galaxies generate cavities in the surface brightness distribution of the X-ray emitting intracluster medium (e.g., Böhringer et al., 1993; Carlli, Perley, & Harris, 1994; McNamara et al., 2000; Fabian et al., 2000; McNamara & Nulsen, 2007). These are considered to be due to the pressure in the lobe overwhelming that of the surrounding hot ICM. Hardcastle & Worrall (2000) and Leahy & Gizani (2002), however, discovered that the ICM pressure inferred by the X-ray emission obtained by ROSAT observation of bright FR-II radio galaxies is much higher than the minimum pressure estimated by the synchrotron luminosity in the radio band for large ( kpc) radio galaxies. A detailed study by Leahy & Gizani (2001) confirmed this pressure discrepancy for 3C388. These results suggest the dominance of the other forms of pressure above that due to the synchrotron electrons (and magnetic field) in the radio lobes.
Hardcastle & Worrall (2000) argued that plausible candidates for carrying the “invisible” pressure are non-thermal protons, magnetic field with strength differing from that derived from the minimum energy condition (), or low energy electrons which do not emit strong radiation in the observed energy bands. If we assume that in the internal shock is as small as that in the external shock, the radio lobes could have a significant amount of thermal electrons (Section 2). In this case, the pressure of the thermal electrons could be one of the candidates for the origin of the “invisible” pressure. Since SZE is sensitive only to electron energy, it is a good probe of either the thermal electrons or non-thermal electrons of low energy which do not emit high frequency emission in the observation bands. The observational different signature between thermal and non-thermal SZE is the frequency of zero amplitude (e.g., Birkinshaw, 1999). Specifically, the thermal SZE has the null frequency ( GHz) which is almost independent of the gas temperature, whereas the null frequency of non-thermal SZE changes with the electron energy distribution parameters. Hence, future multi-frequency observations that covers the null frequency of thermal SZE will be a tool to probe the electron contribution to the “invisible” pressure components in the cocoon. On the other hand, if of the internal shock is larger than that of the external shock and close to unity, resulting in a significant difference in the fractions of thermal and non-thermal electrons in the shocked shell and the radio lobes inside, SZE studies become much more difficult. In this case, the multi-frequency observation should be carried out over more than one region. For example, multi-frequency observations of the head-top region of the bow shock will be able to determination the contribution of mainly thermal electrons formed at the external shock. This can be used to correct the observation of the central region apart from the shock-head, where the thermal and non-thermal SZE coexist.444For the radio galaxy in a galaxy cluster, another difficult problem is to distinguish the contribution from the unshocked ICM. In order to examine this contribution, multi-dimensional modeling of a radio galaxy embedded in the ICM is necessary. In summary, the SZE can be a probe of electron contribution to the “invisible” pressure in a radio galaxy, but discrimination between thermal and non-thermal contributions requires sensitive multi-frequency and multi-region observations in the future.
For the other sources of pressure, it is unlikely that the magnetic field is significantly different from . For example, X-ray observations have shown that majority of the radio galaxies tend to have larger particle energy than that of the magnetic field (for a recent results, see Isobe et al., 2009, and references therein). Protons, as another possible candidate for the “invisible” pressure, on the other hand, would lead to an SZE much smaller than that given by equation (6). The existence of high-energy protons should be probed in the hard X-ray and/or -ray regime (Scheck et al., 2002).
6 Conclusion
We have reported the results of a trial observation of SZE in a giant radio galaxy B1358+305 with the Nobeyama 45-m telescope at 21 GHz. By performing the imaging observation, we have obtained the most stringent upper limit achieved for the Compton parameter in a radio galaxy. The obtained upper limit is close to the expected value derived for a low acceleration efficiency of synchrotron electrons at the shock (the low value , see Eq. [6]), but detailed analysis shows that the obtained intensity fluctuation is likely to be caused by the excess atmospheric noise. If we assume that the obtained intensity fluctuations in the observed region were due to the thermal electrons in the cocoon of B1358+305, our results are qualitatively consistent with the supersonic expansion of B1358+305 but for the original assumption being too small. Alternatively, if the true pressure of thermal electrons is much lower than that derived from the obtained upper limit, our observation is not sensitive enough to derive any definitive conclusions on the pressure balance of B1358+305. Since the SZE is sensitive only to electron energy, it would serve as a probe of the pressure components in radio galaxies as well as galaxy clusters. Future high sensitive multi-frequency SZE observations of multi-regions will provide an important information about the contributions of thermal or low-energy non-thermal electrons to the total pressure of a radio galaxy. This may provide a clue for disentangling the pressure discrepancy between the surrounding ICM derived by X-ray observations and the minimum energy of radio galaxies at the centers of clusters of galaxies (Hardcastle & Worrall, 2000; Leahy & Gizani, 2002). Though we have failed to obtain a definitive SZE signal with the Nobeyama 45-m telescope, higher frequency observations using either a large field-of-view (e.g., ), multi-beam receivers on large (e.g., 30 m) single dish telescopes, or interferometers with a large number of small dishes (e.g., cm) similar to the AMiBA project555See http://amiba.asiaa.sinica.edu.tw/ for the AMiBA project. might lead to the detection of SZE of a cocoon. The SZE would provide a new observational tool to probe the energetics of radio galaxies, along with the projects to detect low frequency radio emission from non-thermal low energy electrons like the Long Wavelength Array (LWA: Harris, 2005).
References
- Baring et al. (1999) Baring, M. G., Ellison, D. C., Reynolds, S. P., Greiner, I. A. & Goret, P. 1999, ApJ, 513.
- Begelman & Cioffi (1989) Begelman, M. C., & Cioffi, D. F. 1989, ApJ, 345, L21.
- Birkinshaw (1999) Birkinshaw, M. 1999, Phys. Rept., 310, 97.
- Blandford & Rees (1974) Blandford, R. D., & Rees, M. J. 1974, MNRAS, 169, 395.
- Blundell & Rawlings (2000) Blundell, K. M., & Rawlings, S. 2000, AJ, 119, 1111.
- Böhringer et al. (1993) Böhringer, H., Voges, W., Fabian, A. C., Edge, A., C., Neumann, D. M. 1993, MNRAS, 264, L25.
- Burns, Norman, & Clarke (1991) Burns, J. O., Norman, M. L., & Clarke, D. A. 1991, Science, 253, 522.
- Carlli, Perley, & Harris (1994) Carilli, C, L., Perley, R. A., & Harris, D. E. 1994, MNRAS, 270, 130.
- Carlstrom et al. (2001) Carlstrom, J. E., Joy, M., Grego, L., et al. 2001”Constructing the Universe with Clusters of Galaxies”, IAP Conf. eds. F. Durret & G. Gerbal (arXiv:astro-ph/0103480).
- Clarke, Norman & Burns (1986) Clarke, D. A., Norman, M. L., & Burns, J, O. 1986, ApJ, 311, L63.
- Colafrancesco (2008) Colafrancesco, S. 2008, MNRAS, 385, 2041.
- Croston et al. (2005) Croston, J. H. et al. 2005, ApJ, 626, 733.
- Croston et al. (2009) Croston, J. H. et al. 2009, MNRAS, 395, 1999.
- Enßlin & Kaiser (2000) Enßlin, T. A., & Kaiser, C. R. 2000, A&A, 360, 417.
- Fabian et al. (2000) Fabian, A. C., Sanders, J. S., Ettori, S., et al. 2000, MNRAS, 318, L65.
- Fanaroff & Riley (1974) Fanaroff, B. L., & Riley, J. M. 1974, MNRAS, 167, 31.
- Franceschini et al. (1989) Franceschini, A., Toffolatti, L., Danese, L., & De Zotti, G. 1989, ApJ, 344, 35.
- Grandi et al. (2003) Grandi, P. et al. 2003,ApJ. 586, 123.
- Heinz, Reynolds, & Begelman (1998) Heinz, S., Reynolds, C. S., & Begelman, M. C. 1998, MNRAS, 501, 126.
- Hardcastle & Worrall (2000) Hardcastle, M. J., & Worrall, D. M. 2000, MNRAS, 319, 562.
- Hardcastle, Birkinshaw, and Worrall (2001) Hardcastle, M. J., Birkinshaw, M., & Worrall, D. M. 2001, MNRAS, 323, L17.
- Hardcastle & Looney (2008) Hardcastle, M. J. & Looney, 2008, MNRAS, 388, 176.
- Harris, Carilli, & Perley (1994) Harris, D. E., Carilli, C. L., & Perley, R. A. 1994, Nature, 367, 713.
- Harris, Leighly, & Leahy (1998) Harris, D. E., Leighly, K. M., & Leahy, J. P. 1998, ApJ, 499, L149.
- Harris et al. (1999) Harris, D. E., Hjorth, J., Sadun, A. C., Silverman, J. D., Vestergaard, M. 1999, MNRAS, 518, 213.
- Harris et al. (2000) Harris, D. E., Nulsen, P. E. J., Ponman, T. J., et al. 2000, ApJ, 530, L81.
- Harris (2005) Harris, D. E. F, 2005, proceedings of ”Clark Lake to the Long Wavelength Array: Bill Erickson’s Radio Science”, ASP Conf. Ser, vol. 345, 254.
- Isobe et al. (2006) Isobe, N., et al. 2006, ApJ, 645, 256.
- Isobe et al. (2009) Isobe, N. et al. 2009, ApJ, 706, 454.
- Ito et al. (2008) Ito, H., Kino, M., Kawakau, N., Isobe N. & Yamada, S. 2008, ApJ, 685, 828.
- Kaiser & Alexander (1999) Kaiser, C., & Alexander, P. 1999, MNRAS, 305, 707.
- Komatsu et al. (2001) Komatsu, E., Matsuo, H., Kitayama, T., et al. 2001, PASJ, 53, 57.
- Konar et al. (2009) Konar, C., Hardcastle, M. J., Croston, J. H. & Saikia, D. J. 2009, MNRAS, 400, 480.
- Kuno (1993) Kuno, N. 1993, PhD Thesis, Tohoku University.
- Leahy & Gizani (2001) Leahy, J. P., & Gizani, N. A. B. 2001, ApJ, 555, 709.
- Leahy & Gizani (2002) Leahy, J. P., & Gizani, N. A. B. 2002, NewA Rev., 46, 117.
- Lind et al. (1989) Lind, K. R., Payne, D. G., Meier, D. L., & Blandford, R. D. 1989, ApJ, 344, 89.
- Loeb & Waxman (2000) Loeb, A.& Waxman, E. 2000, Nature, 405, 156.
- Loken et al. (1992) Loken, C., Burns, J. O., Clarke, & Norman, M. L. 1992, ApJ, 392, 54.
- McKinnon et al. (1991) McKinnon M.M., Owen F.N., & Eilek J.A. 1991, AJ, 101, 2026.
- McNamara et al. (2000) McNamara, B. R., Wise, M., Nulsen, P. E., et al. 2000, ApJ, 534, L135.
- McNamara & Nulsen (2007) McNamara, B. R. & Nulsen, P. E. J. 2007, ARA&A, 45, 117.
- Moffet (1975) Moffet, A. T. 1975, ”Galaxies and the Universe”, ed. Sandage, A., Sandage, M. & Kristian, J., the Chicago University Press.
- Nath (1995) Nath, B. B. 1995, MNRAS, 274, 208.
- Ott et al. (1994) Ott, M., Witzel, A., Quirrenbach, A., et al. 1994, A&A, 284, 331.
- Parma et al. (1996) Parma, P., de Ruiter, H. R., Mack, K.-H., et al. 1996, A&A, 311, 49.
- Pfrommer, Enß lin & Sarazin (2005) Pfrommer, C., Enß lin, T. A. & Sarazin, C. L. 2005, A&A, 430, 799.
- Rephaeli (2002) Rephaeli, Y. 2002, Space Science Reviews, 100, 61.
- Saripalli et al. (1996) Saripalli, L., Mack, K.-H., Klein, U., Strom, R., Singal, A. K. 1996, A&A, 306, 708.
- Sarazin (1999) Sarazin, C. L. 1999, ApJ, 520, 529.
- Scheck et al. (2002) Scheck, L., Aloy, M. A., Martí, J. M., Gómez, J. L. & Müller, E., 2002, MNRAS, 331, 615.
- Scheuer (1974) Scheuer, P. A. G. 1974, MNRAS, 166, 513.
- Sieber, Haslam, & Salter (1979) Sieber, W., Haslam, C. G., & Salter, C. J. 1979, A&A, 74, 361.
- Spergel et al. (2003) Spergel, D. N. et al. ApJS, 148, 175.
- Sturner et al. (1997) Sturner, S. J., Skibo, J. G., Dermer, C. D., & Mattox, J. R. 1997, ApJ, 490, 619.
- Tashiro et al. (1998) Tashiro, M. et al. 1998, ApJ, 499, 713.
- Wardle et al. (1998) Wardle, J. F. C., Homan, D. C., Ojha, R. & Roberts, D. H. 1998, Nature, 395, 457.
- Wilson, Young, & Shopbell (2000) Wilson, A. S., Young, A. J., & Shopbell, P. L. 2000, ApJ, 544, L27.
- Wilson, Young, & Shopbell (2001) Wilson, A. S., Young, A. J., & Shopbell, P. L. 2001, ApJ, 547, 740.
- Yamada et al. (1999) Yamada, M., Sugiyama, N., & Silk, J. 1999, ApJ, 522, 66.
- Yamada & Fujita (2001) Yamada, M., & Fujita, Y. 2001, ApJ, 553, 145.
- Zel’dovich & Sunyaev (1969) Zel’dovich, Ya. B., & Sunyaev, R. A. 1969, ApJS, 4, 301.