Coexistence of ’+ 208Pb’ cluster structures and single-particle excitations in Po128
Abstract
Excited states in 212Po have been populated by transfer using the 208Pb(18O, 14C) reaction at 85 MeV beam energy and studied with the EUROBALL IV multidetector array. The level scheme has been extended up to MeV excitation energy from the triple coincidence data. Spin and parity values of most of the observed states have been assigned from the angular distributions and angular correlations. Several lines with E 1 MeV have been found to be shifted by the Doppler effect, allowing for the measurements of the associated lifetimes by the DSAM method. The values, found in the range [0.1-0.6] ps, lead to very enhanced E1 transitions. All the emitting states, which have non-natural parity values, are discussed in terms of -208Pb structure. They are in the same excitation-energy range as the states issued from shell-model configurations.
pacs:
25.70.Hi, 27.80.+w, 23.20.-g, 21.60.GxI Introduction
The 212Po nucleus is the last member of the 232Th radioactive chain. As early as 1916, Rutherford and Wood discovered ru16 the emission of particles from the end of this chain, the ”active deposit” of thorium (formerly named as ThB). Many years later, this was interpreted as the decays of several states of 212Po, particularly its ground state which is a pure emitter, with a very short half-life, 0.299(2) s. Afterwards new activities were produced by heavy/light-ion bombardments of bismuth and lead, and their decay spectra were measured pe62 . These studies have shown that an -line at 11.6 MeV arises directly from an isomeric state of 212Po with a half-life of 45 s, i.e. longer than the ground-state one. The very large hindrance factor for this emission was explained by spin and parity assignments of 18+ for the 212Po isomeric state, which has been located at 2.9 MeV excitation energy.
Besides these two extreme states, other levels were identified from the -decay of the two long-lived states of 212Bi or via light-ion induced transfer reactions, such as (18O,14C) or (9Be, n) on a 208Pb target bo81 ; po87 , and all the yrast levels were discussed in terms of shell model configurations. The 212Po nucleus has been also studied in neutron-evaporation channels from total-fusion reactions, using either a radioactive target su85 , 210Pb(, 2n), or a radioactive beam po03 ; ga05 , 208Pb(8He,4n). However, the limited number of the target nuclei or the projectiles did not sizeably improve the spectroscopic data obtained in the 208Pb(9Be, n) reaction po87 .
There were numerous attempts to give a microscopic description of the decay of the ground state of 212Po. The use of shell-model configurations fails to reproduce the large value of its rate by an order of magnitude, meaning that the -particle formation is badly predicted within this approach. When complemented by cluster-model-type basis states va92 , the decay width is predicted in good agreement with the experimental value, the amount of clustering in the ground state of 212Po being 0.3. This is not far from the high degrees of clustering well known in some light nuclei where the two neutrons and the two protons occupy the same orbit, which is not fulfilled in the present case.
The existence of the cluster would also act upon the properties of the excited states of 212Po. Whereas shell-model approaches work well to predict the excitation energy of the yrast states po87 , they cannot reproduce their large experimental B(E2) transition strengths, which are well accounted for from the clustering (see for instance refs. bu94 ; ho94 ; oh95 ; bu96 ). All these results point to the fact that the positive-parity yrast states do contain both components, shell-model configurations and clustering, which are not easy to disentangle.
In this paper, we present a new class of excited states of 212Po, which have non-natural parity and are connected by enhanced E1 transitions to the yrast states. Low-lying shell-model excitations do not lead to such non-natural parity states and these states are the first experimental evidence of ”pure” -cluster states in heavy nuclei. The 212Po nuclei have been obtained using the (18O,14C) transfer reaction on a thick 208Pb target and measurements have been performed. The experimental conditions and the various analysis techniques are presented in section II. Section III is devoted to the experimental results which comprise i) the analysis of the reaction mechanism leading to the 212Po channel, ii) the new level scheme of 212Po, iii) the lifetime measurements using the Doppler Shift Attenuation Method (DSAM) , and iv) the branching ratios of the yrast states. In the last part (section IV) we review several properties of the first excited states of 212Po in order to underline the contribution of the -clustering. Then we discuss the oscillatory motion of the -core distance which may give rise to non-natural parity states.
A letter highlighting parts of the present study has been recently published as10 .
II Experimental details
II.1 Reaction, -ray detection and analysis
Excited states in 212Po were populated by transfer using the 18OPb reaction, the 18O beam with an energy of 85 MeV being provided by the Vivitron tandem of IReS (Strasbourg). A 100 mg/cm2 self-supporting target of 208Pb was employed, which was thick enough to stop the recoiling 212Po nuclei. It is worth noting that due to this large thickness, the 18O beam was stopped in the Pb target too, and therefore the incident energy covered a large range of values, above and below the Coulomb barrier. The kinematics of the transfer leading to high-spin states in 212Po in this experiment is detailed below (see sect. III.1). The de-exciting -rays were recorded with the EUROBALL IV array consisting of 71 Compton-suppressed Ge detectors Euroball (15 cluster germanium detectors placed in the backward hemisphere with respect to the beam, 26 clover germanium detectors located around 90∘, 30 tapered single-crystal germanium detectors located at forward angles). Each cluster detector is composed of seven closely packed large-volume Ge crystals cluster and each clover detector consists of four smaller Ge crystals clover . The 239 Ge crystals of the Euroball array could be grouped into 13 rings, with the following angles with respect to the beam axis, 15.5∘ (5 crystals), 34.6∘ (10), 52.3∘ (15), 72.2∘ (26), 80.9∘ (26), 99.1∘ (26), 107.5∘ (26), 122.6∘ (10), 130.5∘ (30), 138.7∘ (25), 148.1∘ (15), 155.9∘ (15), and 163.5∘ (10), i.e. 3 rings forward, 4 rings close to 90∘ and 6 rings backward with respect to the beam axis.
Events were recorded on tape when at least 3 unsuppressed Ge detectors fired in prompt coincidence. In this way, a set of three- and higher-fold events were available for subsequent analysis, but only a small part of these data corresponds to 212Po events. Indeed the main objective of the experiment was actually the study of the fusion-fission channel which leads to the production of the high-spin states of fragments, mainly located on the neutron-rich side of the valley of stability po04 . The 212Po study became itself a goal when it turned out that its main lines were strong enough in our data set to be precisely analyzed. We have estimated that the cross section of the exit channel leading to 212Po is 10-20 mb, i.e. 10-20% of the cross section of the fusion-fission channel.
Various procedures have then been used for the offline analysis in order to fully characterize the excited levels of 212Po (excitation energy, spin and parity values, decay modes, and multipole matrix elements). Both multi-gated spectra and three-dimensional ’cubes’ have been built and analyzed with the Radware package ra95 , starting from the known transitions deexciting the yrast states po87 .
II.2 angular distributions and - angular correlations
We have checked whether the reaction mechanism involved here leads to spin alignments of 212Po with respect to the beam axis. Thus we have chosen several yrast transitions which are known to be quadrupole ones with (such as the 727, 405, and 357 keV transitions) or dipole ones with (such as the 577 keV one). Their angular distributions have been found to be symmetric around 90∘ (see examples in fig.1), the intensity of the quadrupole transitions being maximum along the beam axis, whereas the one of the dipole transition is maximum at 90∘, demonstrating that the spins are aligned in a plane perpendicular to the beam axis.
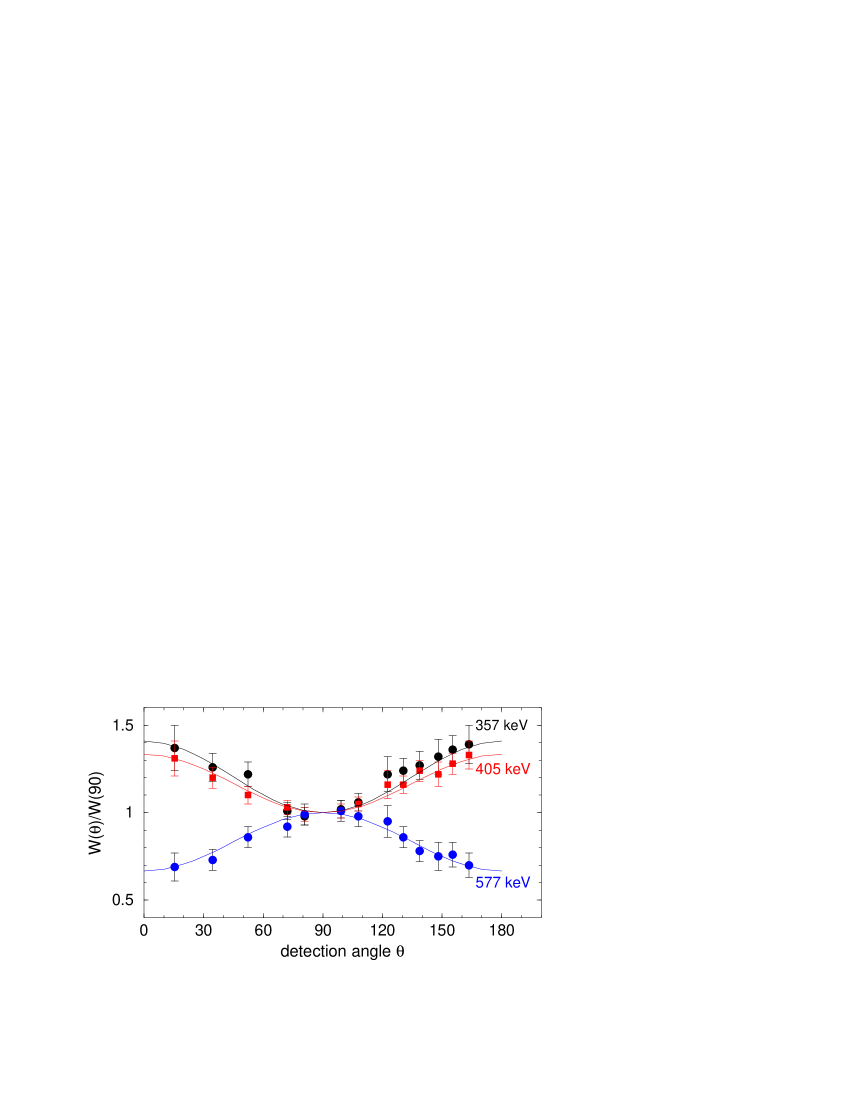
When fitted using standard Legendre polynomials , the obtained values of the angular coefficient / indicate that the alignment is partial, with an attenuation coefficient 0.7 ya67 .
This allowed us to analyze each gamma-ray angular distribution to determine its multipole order. In order to characterize the transitions having too weak intensity to be analyzed in that way, their anisotropies have been determined using the intensities measured at two angles relative to the beam axis, RADO=Iγ(39.3∘)/ Iγ(76.6∘), these two angles being the average angle of the tapered and cluster detectors in the one hand, and the average angle of the clover detectors in the other hand, when taking into account the symmetry of the distribution around 90∘. Assuming the same attenuation coefficient as mentioned above ( 0.7) theoretical ADO ratios of 0.85 and 1.30 are expected for pure stretched dipole and quadrupole transitions, respectively.
The analysis of - angular correlations of the most intense transitions has been also performed, in order to get rid of the spin alignment process. For that purpose, the coincidence rates of two successive transitions are analyzed as a function of , the average relative angle between the two fired detectors. The Euroball IV spectrometer had = 28441 combinations of 2 crystals, out of which only 2000 involved different values of relative angle within 2∘. Therefore, in order to keep reasonable numbers of counts, all the angles (taking into account the symmetry around 90∘) have been gathered around three average relative angles : 22∘, 46∘, and 75∘ .
The coincidence rate is increasing between 0∘ and 90∘ for the dipole-quadrupole cascades, whereas it decreases for the quadrupole-quadrupole or dipole-dipole ones. More precisely, the angular correlation functions at the three angles of interest were calculated for several combinations of spin sequences (see table 1), corresponding to typical multipole orders (quadrupole, dipole) and typical spin changes (). In order to check the method, angular correlations of transitions belonging to the yrast cascades of the fission fragments produced in this experiment and having well-known multipole orders were analyzed and the expected values were found in all cases as06 .
| R(22∘) | R(46∘) | R(75∘) | ||
|---|---|---|---|---|
| sequence | values | |||
| 6-6-4 | 0-2 | 1.23 | 1.12 | 1.00 |
| 6-4-2 | 2-2 | 1.13 | 1.06 | 1.00 |
| 5-4-3 | 1-1 | 1.06 | 1.03 | 1.00 |
| 5-4-2 | 1-2 | 0.92 | 0.96 | 1.00 |
| 7-6-6 | 1-0 | 0.91 | 0.95 | 1.00 |
II.3 Linear polarization
Linear polarization can be measured by the use of segmented detectors acting as a Compton polarimeter, such as the clover detectors of the Euroball IV array jo95 . We have performed such an analysis and have confirmed that the three most intense transitions of 212Po have an electric nature. Unfortunately the analysis of the transitions with weaker intensity (even those belonging to the yrast band) could not be done. While single-gated spectra are useless because of the large background, the statistics of the peaks in the double-gated clover spectra are too low to precisely measure the effect we are looking for (the counts in the ’Vertical’ and the ’Horizontal’ spectra have to differ by less than 10%). We have to stress that in this experiment, the major part of the -rays are emitted by the fragments of the fusion-fission exit channel, the summed multiplicity of their -ray cascades being around 20. On the other hand, the 212Po exit channel has a low -multiplicity. Such a situation is not as favourable as that of a rotational structure typically studied in a fusion-evaporation reaction, even weakly populated, since the high folds of their events strongly enhance the statistics of the multi-gated spectra.
II.4 Lifetime measurements
The stopping time of 212Po in the Pb target is about one picosecond, thus it would have been expected that all the transitions lying in the low-energy part of the level scheme are emitted at rest. Nevertheless we have found several -rays with Eγ 1 MeV which exhibit shifts and broadenings in energy due to the Doppler effect, meaning that they are emitted in flight and thus the corresponding excited states do have lifetimes shorter than 1 ps.
The lifetime determination using the Doppler-shift attenuation method (DSAM) is based on the time-correlation between the slowing-down of the recoiling ion and the decay of the nuclear level of interest (cf. e.g. ref. al78 ). At a fixed direction of observation, e.g. at an angle with respect to the beam axis, the spectrum (line-shape) of the registered -rays is given, because of the relation = , by the following formula:
| (1) |
Here, is the velocity projection on the observation axis, the function represents the time-dependent population of the level , is its decay constant and is the branching of the de-exciting transition . The recorded -ray spectrum is obtained by a convolution (folding) with the response function of the detector. The quantity is the stopping matrix which represents the normalized distributions of the velocity projection at different times . Depending on the experimental situation, additional corrections for geometry, efficiency, angular correlation and kinematics effects (cf. ref. al78 ) have also to be taken into account in Eq. 1. To reproduce the line-shape and derive the lifetime, it is necessary to correctly determine , which describes the stopping process, and to solve Eq. 1 with respect to the decay function of the level of interest . Thereby, the influence of the feeding i.e. of the cascade history has also to be considered.
III Experimental results
III.1 Kinematics of the reaction
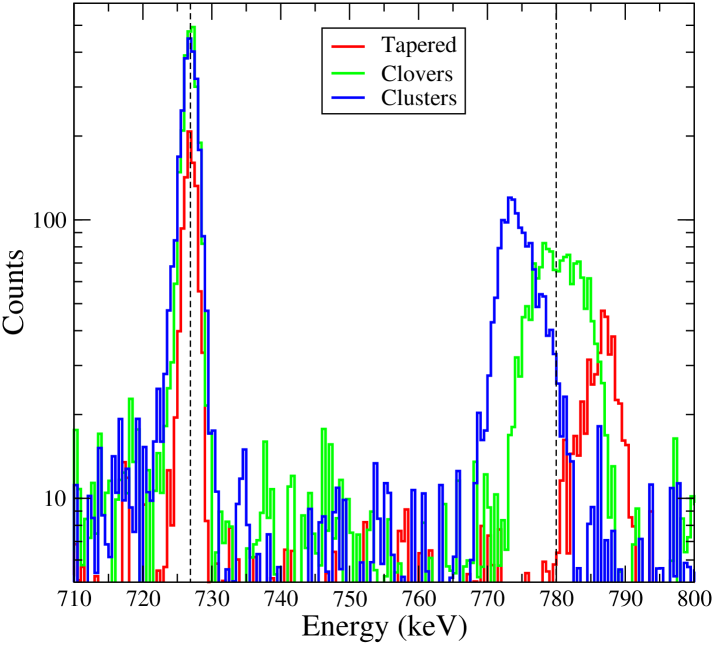
The Doppler effect, if any, can be used to determine the direction and the modulus of the velocity of the recoiling nuclei produced in the reaction. Fortunately, the 780 keV transition, located in the high-energy part of the level scheme (this is discussed below, see sect. III.2), displays only shifted components. This can be seen in the triple gated spectrum drawn in figure 2. The 780 keV transition is shifted and broadened by the Doppler effect, whereas the 727 keV () transition is emitted by a fully stopped nucleus.
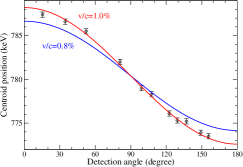
We have precisely measured the energy of the 780 keV transition as a function of the detector angle, the results are displayed in fig. 3. The symmetry around 90∘ implies that the 212Po nuclei recoil along the beam axis. The best fit gives =1% and a transition energy of 780.4 keV.
The direction and the modulus of this velocity indicate that the 14C ejectiles are also emitted along the beam axis, but in the backward direction111If the 14C ejectiles were emitted forward, the velocity of 212Po would be smaller than the velocity of 226Th, the compound nucleus of the 18O+208Pb complete fusion, i.e. 0.8%., which is in perfect agreement with previous results. Many years ago, transfer reactions induced by 16O on 208Pb have been studied vi77 in the energy range of 77 to 102 MeV, the scattered particles being identified using Si telescopes and their angular distribution measured in interval of 5-10∘ over the angular range of 30∘ to 160∘ in the laboratory system. The results are typical of a grazing collision, showing an energy dependence of the maximum of the distribution, which moves from 60∘ for 102 MeV incident beam to more than 160∘ for 80 MeV. Some years later, using the transfer reaction 208Pb(18O, 14C) at bombarding energies below 80 MeV bo81 , the first excited states of 212Po have been identified from the coincidences between backscattered ejectiles (within an angular range of 151∘ 166∘) and -rays.
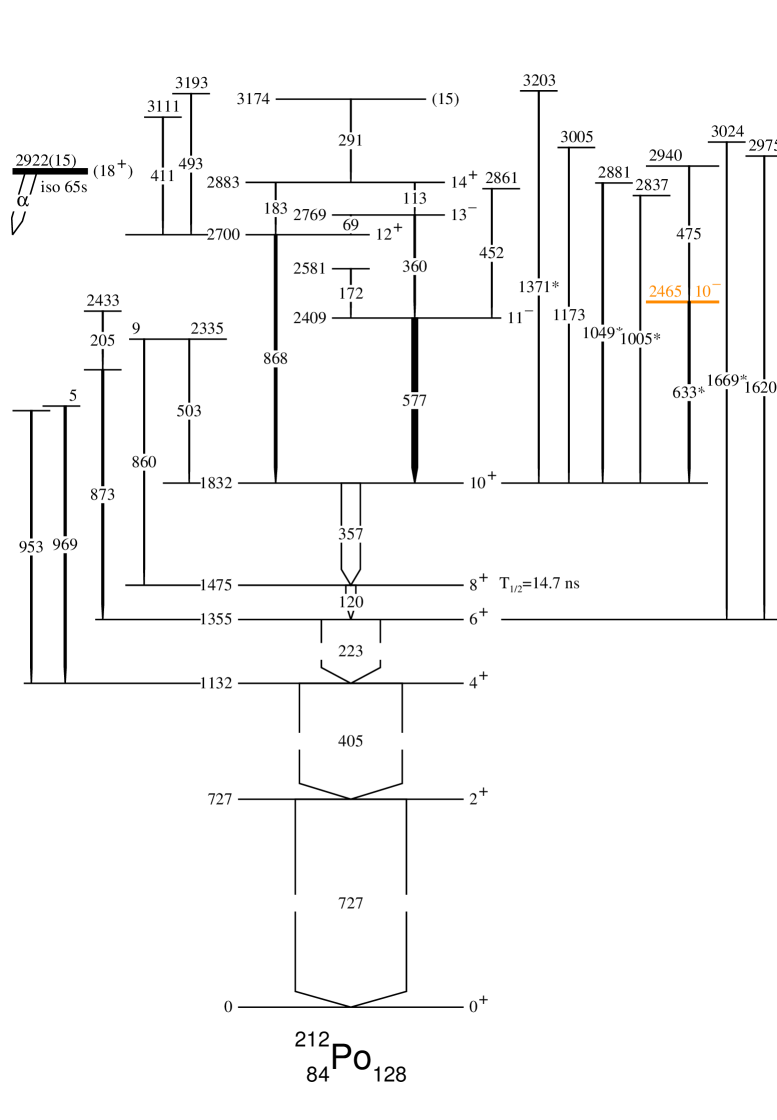
III.2 Level scheme of 212Po
We fully agree with the results previously obtained on the level scheme of 212Po po87 ; po03 ; ga05 , confirming both the identified -rays and their placement in the level scheme. Moreover we have assigned about 50 new -rays to 212Po, de-exciting 35 new excited states, about ten of which are located above 2.92 MeV, the energy of its (18+) long-lived state.
Typical coincidence spectra of 212Po are presented in figure 4.
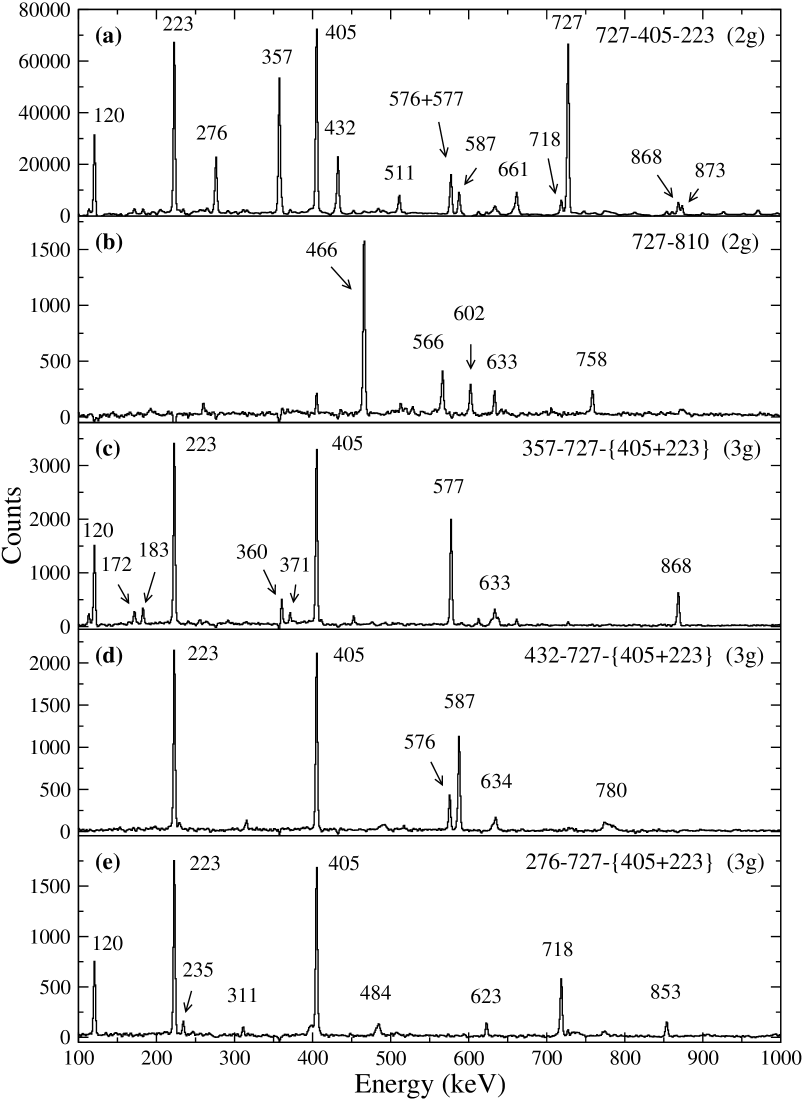
By requiring two conditions among the three most intense lines (727, 405 and 223 keV), almost all transitions of 212Po can be seen, the most intense ones are labeled in figure 4a. The 810 keV transition is located just above the 727 keV level line and cannot be seen in this spectrum. The spectrum of -rays in double coincidence with the 727 keV and 810 keV transitions (see figure 4b) shows the transitions belonging to the part of level scheme lying above the 810 keV transition. The three last spectra displayed in figures 4c, 4d and 4e have been obtained by triple gating on three transitions of 212Po, showing different parts of the level scheme which are well populated by the reaction used in this work. In the spectrum gated by two transitions of the yrast band and by the 432 keV line, one can even notice the Doppler-broadened 780 keV transition, which has allowed us to extract the velocity of the recoiling nuclei (see section III.1).
All the -rays observed in the reaction 208Pb(18O, 14C) are reported in table 2, including their relative intensity, the value of their anisotropy, RADO=Iγ(39.3∘)/ Iγ(76.6∘) and their location in the level scheme.
| E | I | E | I | ||||||||||
| (keV) | (keV) | (keV) | (keV) | (keV) | (keV) | ||||||||
| 69.2 | 6(3) | 2769.4 | 2700.4 | 566.3 | 14(3) | 1.32(14) | 2102.9 | 1536.8 | |||||
| 113.3 | 3(1) | 2882.8 | 2769.4 | 575.6 | 10(3) | 1.15(8) | 2362.7 | 1786.9 | |||||
| 120.3 | 90(10) | 1.28(18) | 1474.9 | 1354.6 | 577.1 | 49(7) | 0.82(2) | 2409.1 | 1832.0 | ||||
| 157.2 | 4(2) | 2102.9 | 1945.6 | 587.5 | 29(5) | 0.80(4) | 2374.2 | 1786.9 | |||||
| 171.7 | 5(2) | 2580.8 | 2409.1 | 601.9 | 9(3) | 0.89(15) | 2604.4 | 2002.5 | |||||
| 182.6 | 5(2) | 1.37(16) | 2882.8 | 2700.4 | 612.3∗ | 27(5) | 1.24(27) | 1744.3 | 1132.0 | ||||
| 205.1 | 5(2) | 2432.8 | 2227.7 | 7 | 622.6 | 3(1) | 0.78(10) | 2374.2 | 1751.0 | ||||
| 222.6 | 530(30) | 1.21(3) | 1354.6 | 1132.0 | 633.2 | 9(3) | 0.82(13) | 2170.0 | 1536.8 | ||||
| 229.8 | 3(1) | 2604.3 | 2374.2 | 633.3∗ | 15(3) | 1.20(16) | 2465.3 | 1832.0 | |||||
| 234.6 | 4(2) | 1.16(13) | 1985.7 | 1751.0 | 633.6 | 9(3) | 2420.5 | 1786.9 | |||||
| 249.7 | 3(1) | 2235.5 | 1985.7 | 637.3 | 2(1) | 2469.6 | 1832.0 | ||||||
| 255.2 | 2(1) | 3035.3 | 2780.2 | 661.3∗ | 51(7) | 1.19(9) | 2015.9 | 1354.6 | |||||
| 259.6 | 5(2) | 2362.7 | 2102.9 | 718.4 | 20(5) | 0.76(4) | 2469.6 | 1751.0 | |||||
| 264.7 | 7(2) | 0.99(9) | 2280.7 | 2015.9 | 727.1 | – | 1.14(2) | 727.1 | 0.0 | ||||
| 276.1∗ | 58(10) | 1.28(7) | 1751.0 | 1474.9 | 740.2∗ | 7(3) | 3209.8 | 2469.6 | |||||
| 291.4 | 3(2) | 3174.2 | 2882.8 | 748.1 | 6(3) | 2102.9 | 1354.6 | ||||||
| 310.8 | 3(2) | 2780.2 | 2469.6 | 757.2∗ | 8(3) | 2860.1 | 2102.9 | ||||||
| 315.5 | 3(2) | 2102.9 | 1786.9 | 758.4 | 10(3) | 1.15(11) | 2295.2 | 1536.8 | |||||
| 357.1 | 170(20) | 1.26(3) | 1832.0 | 1474.9 | 774 | 2(1) | 2525.0 | 1751.0 | |||||
| 358.5 | 11(3) | 2102.9 | 1744.3 | 780.4∗ | 23(5) | 1.34(9) | 3154.7 | 2374.2 | |||||
| 358.6 | 11(3) | 0.85(10) | 2374.2 | 2015.9 | 809.7 | 76(10) | 0.83(6) | 1536.8 | 727.1 | ||||
| 360.2 | 10(3) | 1.26(15) | 2769.4 | 2409.1 | 813.6∗ | 34(5) | 1.13(8) | 1945.6 | 1132.0 | ||||
| 371.0 | 3(1) | 2780.2 | 2409.1 | 853.4 | 7(2) | 0.98(20) | 2604.3 | 1751.0 | |||||
| 397.7∗ | 9(3) | 2867.3 | 2469.6 | 860.3 | 5(2) | 0.74(15) | 2335.1 | 1474.9 | 9 | ||||
| 404.9 | 924(25) | 1.19(2) | 1132.0 | 727.1 | 868.4 | 19(4) | 1.18(6) | 2700.4 | 1832.0 | ||||
| 405 | 6(3) | 1536.8 | 1132.0 | 873.1 | 14(3) | 0.84(5) | 2227.7 | 1354.6 | |||||
| 406.6∗ | 2(1) | 3010.9 | 2604.3 | 875.0 | 4(2) | 2877.5 | 2002.5 | ||||||
| 410.7 | 2(1) | 1.08(16) | 3111.1 | 2700.4 | 899.0 | 4(2) | 2374.2 | 1474.9 | |||||
| 432.3∗ | 75(10) | 1.22(6) | 1786.9 | 1354.6 | 926.2 | 6(3) | 0.67(14) | 2280.7 | 1354.6 | ||||
| 452.3 | 4(2) | 2861.4 | 2409.1 | 953.1 | 8(3) | 1.13(29) | 2085.1 | 1132.0 | |||||
| 465.7 | 50(5) | 0.89(9) | 2002.5 | 1536.8 | 968.9 | 14(3) | 0.86(10) | 2100.9 | 1132.0 | ||||
| 474.9 | 3(1) | 2940.2 | 2465.3 | 971.1 | 26(5) | 0.79(7) | 2102.9 | 1132.0 | |||||
| 483.7 | 4(2) | 2469.6 | 1985.7 | 994.9 | 4(2) | 2469.6 | 1474.9 | ||||||
| 484.5 | 7(3) | 2235.5 | 1751.0 | 1005∗ | 6(3) | 2837 | 1832.0 | ||||||
| 490.2∗ | 5(2) | 1.26(15) | 2864.5 | 2374.2 | 1020 | 8(2) | 0.76(7) | 2374.2 | 1354.6 | ||||
| 492.8 | 2(1) | 3193.2 | 2700.4 | 1049∗ | 9(3) | 1.03(17) | 2881 | 1832.0 | |||||
| 502.9 | 3(1) | 2335.1 | 1832.0 | 9 | 1172.7 | 2(1) | 3004.7 | 1832.0 | |||||
| 510.9 | 26(5) | 1.10(9) | 1985.7 | 1474.9 | 1371∗ | 6(3) | 1.16(20) | 3203 | 1832.0 | ||||
| 518.4 | 3(1) | 2880.9 | 2362.7 | 1620∗ | 6(3) | 2975 | 1354.6 | ||||||
| 563.8∗ | 10(3) | 2666.7 | 2102.9 | 1669∗ | 5(2) | 3024 | 1354.6 |
(a)
Uncertainties in transition energies are typically between 0.1 and 0.5 keV.
Transitions showing Doppler shift and broadening are marked by an asterisk,
their energy uncertainty can be larger (up to 2 keV).
(b)
Intensities measured in this experiment (i.e. with the requirement that a minimum of
three unsuppressed Ge detectors fired in prompt coincidence) are normalized to the sum of the values of the two transitions
populating the 2 state, Iγ(404.9 keV) + Iγ(809.7 keV) = 1000.
Results of the angular distributions and of angular correlations for the most intense -rays are given in tables 3 and 4. Values of conversion coefficients for the low-energy transitions extracted from total intensity balances done on some selected gated spectra are given in table 5, in comparison with theoretical values ki08 .
| Eγ | a | multipole order | spin sequence(b) |
|---|---|---|---|
| 727.1 | I=2 quadrupole | ||
| 404.9 | I=2 quadrupole | ||
| 222.6 | I=2 quadrupole | ||
| 357.1 | I=2 quadrupole | ||
| 577.1 | I=1 dipole | ||
| 868.4 | I=2 quadrupole | ||
| 276.1* | I=0 dipole | ||
| 432.3* | I=0 dipole | ||
| 465.7 | I=1 dipole | ||
| 575.6 | I=0 dipole | ||
| 587.5 | I=1 dipole | ||
| 661.3* | I=0 dipole | ||
| 718.4 | I=1 dipole | ||
| 1020 | I=1 dipole |
(a) The number in parenthesis is the error in the last digit.
(b) see text.
| Eγ-Eγ | R(22∘) | R(46∘) | R(75∘) |
|---|---|---|---|
| 405 - 727 | 1.10(4) | 1.06(2) | 1.00(1) |
| 223 - 405 | 1.10(3) | 1.05(2) | 1.00(1) |
| 577 - 357 | 0.89(5) | 0.97(4) | 1.00(3) |
| 223 - 276 | 1.12(6) | 1.09(4) | 1.00(2) |
| 223 - 432 | 1.15(6) | 1.12(4) | 1.00(3) |
| 223 - 661 | 1.22(7) | 1.08(5) | 1.00(3) |
| E | adopted | |||||
|---|---|---|---|---|---|---|
| (keV) | (exp) | (E1) | (E2) | (M1) | ||
| 69.2 | tot | 0.2(1) | 0.26 | 39.2 | 6.2 | E1 |
| 113.3 | tot | 3.0 | 0.33 | 4.26 | 7.77 | E1 |
| 120.3 | tot | 3.2(5) | 0.29 | 3.32 | 6.60 | E2 |
| K | 0.41 | |||||
| 182.6 | tot | 0.6(3) | 0.10 | 0.65 | 2.00 | E2 |
| 222.6 | tot | 0.33(5) | 0.063 | 0.33 | 1.15 | E2 |
| K | 0.13 | |||||
| 276.1* | tot | 0.37(7) | 0.038 | 0.162 | 0.635 | E1(a) |
| K | 0.4 | 0.031 | 0.081 | 0.516 | ||
| 432.3* | tot | 0.13(3) | 0.014 | 0.046 | 0.188 | E1(a) |
| K | 0.1 | 0.011 | 0.030 | 0.153 |
(a) see sect. III.3
The main feature of the level scheme of 212Po obtained in the present work is the rather low multiplicity of the cascades, meaning that the transfer reaction induced by 18O at a bombarding energy close to the Coulomb barrier does not provide so much angular momenta.
The new states which have been identified are lying in a medium range of excitation energy (2.5 MeV-3.2 MeV) and angular momentum (6-8). For the purpose of clarity, the level scheme has been split in two almost independent parts which are displayed in figures 5 and 6.
The first part of the level scheme (see fig. 5) shows the yrast states and the levels only linked to yrast states. We have extended the yrast cascade by only one transition, 291 keV, whereas many new -rays have been found to populate directly the lower-spin yrast states, some of them having a high energy. It is worth pointing out that both the 1620 keV and 1669 keV transitions are seen in coincidence with the 727 keV, 405 keV and 223 keV transitions, while their possible coincidence with the 120 keV line could be too lowered because of its very low intensity. We have chosen to place the two high-energy transitions directly above the 1335 keV state, but their location above the 1475 keV state cannot be excluded. The spin and parity values of all the yrast states are now determined unambiguously up to the 2883 keV level with Iπ=14+, on the basis of our results for angular distributions (table 3), angular correlations (table 4), ADO ratios (table 2), as well as the internal conversion electron coefficients of the low-energy transitions (table 5). Because of the E1 multipolarity of the 69 keV and the 113 keV transitions, the negative parity of the 2409 keV and the 2769 keV states is now clearly established.
The timing information from the germanium detectors have been used to measure the half-life of the 8+ yrast state. The procedures were checked using the delayed coincidences of isomeric states of various nuclei produced in this experiment, as described in ref. as06 . The time distribution between the emission of -rays located above the 1475 keV level and those below it gives T1/2 = 14(1) ns. This is lower than the value obtained in ref. po87 , which has been adopted in the ENSDF data base NNDC . On this other hand, our value is in better agreement with the two previous results li78 ; bo81 , T1/2 = 14.2(24) ns and T1/2 = 14.7(3) ns, respectively. Then, we select the most accurate value, as shown in fig. 5.
The second part of the level scheme (see fig. 6) shows several groups of excited states linked together and to the yrast states. Some levels display several decay paths which limit the spin values which can be assigned to the involved levels. For instance, the angular distribution results for the 810 keV, 971 keV and 1020 keV transitions (see tables 2 and 3) indicate that they are dipole transitions linking states with . Thus the spin values of the 1537 keV, 2103 keV and 2374 keV states are 3, 5, and 7, respectively, because of their other decay observed towards the yrast state having one unit more angular momentum (see fig. 6). Knowing that the 587 keV, 359 keV, and 623 keV transitions are dipole transitions linking states with , the spin values of the 1787 keV, 2016 keV states are even. As for the 432 keV transition linking two levels having an even- value, it could be assigned quadrupole transition with , as its angular coefficient is +0.27(7) (see table 3), or its coincidence rate with the 223 keV transition is maximum at 22∘ (see table 4). Nevertheless the value of the 1787 keV state cannot be 8+, because of its link to the 2103 keV state ( = 5) by means of the 315 keV transition. It is worth recalling that a pure dipole transition has almost identical angular distribution/angular correlations as a quadrupole one. Thus the spin value of the 1787 keV state is fixed to 6. Four other -rays drawn in fig. 6 (276 keV, 612 keV, 661 keV, and 814 keV) share the same features as the 432 keV transition. They exhibit Doppler shifts, they are located just above an yrast state, their angular properties indicate that they can be either quadrupole transitions linking states with or pure dipole transitions linking states with . Thus we adopt the same conclusion for all these transitions, they are dipole transitions linking states with , in agreement with the other decay paths of the states located above them. The negative parity of the 1744 keV, 1751 keV, 1787 keV, 1946 keV, and 2016 keV states will be discussed in the next section.
Due to coincidence relationships and/or spin values, we propose two different states at 2604 keV, one deexcites towards the 2003 keV state by means of the 602 keV transition, while the second one is linked to the 2374 keV state and to the 1751 keV one (see fig. 6). Secondly, two transitions at 968.9-971.1 keV deexcite two states close in energy (2100.9-2102.9 keV). Both members of the doublet, being clearly seen in coincidence with the two first yrast transitions, are located just above the 1132.0 keV level (see figs. 5 and 6). Whereas there is no other transition in coincidence with the lower-energy member, the higher-energy member exhibits the same coincidence relationships as the 566 keV transition (see fig. 6). Lastly, we have assumed that there is only one level at 2335 keV (deexcited by 861 and 503 keV transitions, see fig. 5), as well as only one level at 2281 keV (deexcited by the 265 keV and 926 keV transitions, see fig. 6) and one level at 2235 keV (deexcited by the 250 keV and 484 keV transitions) but we could not strengthen these three hypotheses because of lack of coincidence relationships.
III.3 Anomalous conversion coefficients of the 276 keV and 432 keV transitions
We have extracted the internal conversion electron coefficients of some transitions of 212Po by analyzing the relative intensities of transitions in cascade. The intensity imbalances of the 120.3 keV and the 222.6 keV transitions measured in spectra in double coincidence with at least one -ray located above them lead to (120 keV)=3.3(4) and (223 keV)=0.33(4), in good agreement with the theoretical values for E2 multipolarity ki08 . In addition (see table 5), we have found (276 keV)=0.37(7) and (432 keV)=0.13(3).
The vacancies in the K electron shell due to the emission of an internal conversion electron lead to X-ray emission and conversely the rate of X-rays emitted in any cascade is correlated to the values of the involved transitions. We have exploited this feature to measure some coefficients. For instance, in the spectra in double coincidence with the 79 keV K X-ray of Po and the 577 keV (or 357 keV) transition, the loss in intensity of the 120 keV transition is three times higher than the one of the 223 keV transition, in agreement with the ratio of their coefficient ki08 . In the spectrum in double coincidence with the 587 keV -ray and the 79 keV X-ray, the 432 keV transition exhibits the same drop in intensity as the 223 keV one (compare the A1 and A2 spectra of fig. 7). Thus we obtain (432 keV) (223 keV, E2)(= 0.13).

In the same way (see the B1 and B2 spectra of fig. 7), we get (276 keV) (120 keV, E2)(= 0.41).
The multipolarities of the 276 keV and 432 keV transitions derived from their values could be M1+E2, implying a mixing , 50% M1 + 50% E2. However, the occurrence of such a very large E2 component leads to major discrepancies:
-
The angular coefficient computed for such mixed multipolarities is no longer in agreement with the measured values, as the quadrupole component leads to a large decrease of the coefficient (for =+1) and even to a quasi-isotropic emission (for =-1).
-
The B(E2) reduced transition probability computed from the lifetime of the 1751 keV state (given in the next section) largely exceeds the recommended upper limit (RUL) for -ray strengths: B(E2, 276 keV) , that is larger than what is obtained for E2 transitions inside the superdeformed bands in the Hg-Pb region, B(E2, SD) .
It is noteworthy that the E2 component of the 432 keV transition would lead to B(E2) . Such a large value would be the sign of a quadrupole deformation, implying a rotational behaviour, contrary to what is observed (the 120 keV transition populating the same yrast state as the 432 keV transition has B(E2) , see fig. 13).
As well, the E1+M2 multipolarity that could account for the two values ( 15–20% M2) cannot be adopted because of the tremendous values of the B(M2) reduced transition probabilities calculated using the lifetimes of the states (given in the next section).
Thus we conclude that these transitions must have a pure E1 multipolarity, with anomalous conversion coefficients. In the theoretical calculations of the conversion coefficients such as those of ref. ki08 , the nucleus is assumed to be a homogeneously charged sphere, i.e. without any electromagnetic moment, and the electron remains outside the nucleus. Nevertheless, it is well known that the atomic electrons can penetrate within the nuclear charge and current distributions, giving additional nuclear matrix elements into the expression for the rate of internal-conversion-electron ejection ch56 . Then the conversion coefficients may have anomalous values depending on nuclear structure gr58 ; ni58 . Furthermore, the nuclear electromagnetic moments add several coupling terms to the Dirac equation of the electron pa75 . Altogether, these effects should largely shift the values of the conversion coefficients of the 276 keV and 432 keV transitions since they are emitted by peculiar states having a very large dipole moment, as outlined later (see sect. IV.4).
As a result, the 1751 keV and 1787 keV states have a negative parity and we adopt the same conclusion for the 1744 keV, 1946 keV, and 2016 keV states since their decaying -rays share the same features as the 276 keV and 432 keV transitions, as above mentioned. The negative parity of these five states accounts for their unique decay to the yrast state having the same value222In case of positive parity, we would have to understand why these five states do not decay to the yrast states. For instance, the E2 decay of the 1787 keV state to the 4+ yrast state at 1132 keV would be enhanced because of its energy by a factor of 8 as compared to the one to the 6+ yrast state..
III.4 Lifetime measurements
As introduced previously, several -rays in 212Po exhibit Doppler shifts. A total of 18 transitions have been found to display this feature (they are marked with an asterisk in table 2), implying that 18 excited states do have shorter lifetimes than the stopping time of 212Po in the lead target.
Seven lines – namely the 276 keV, 432 keV, 612 keV, 633 keV, 661 keV, 780 keV and 814 keV transitions – de-exciting some of those states, could be analyzed to get the lifetime using the Doppler-shift attenuation method (DSAM), whereas in two cases (490 keV and 1049 keV transitions), only a limit of the value could be obtained. As for the 9 last cases, the statistics was too low to perform any analysis and the lifetimes for the corresponding levels are assumed to be smaller than 1.4 ps, the mean value of the stopping time of the 212Po recoils (reported below).
The kinematics of the quasi-elastic transfer reaction was taken into account and fine tuned using the line-shape of the 780 keV transition which displays predominantly a shifted part. The best results were obtained under the assumption that the 212Po nuclei recoil in the forward direction within a cone with an opening angle of . The electron stopping power for 212Po ions in Pb was interpolated using the semi-empirical tables of Northcliffe and Schilling Northcliffe_70 and corrected to take into account atomic structure effects Ziegler_74 ; Ziegler_85_1 . The nuclear stopping power, which is due to the interaction with the atoms of the medium as a whole, was taken into account according to the LSS theory LSS and the parameterization of the universal scattering function for a Thomas-Fermi potential given in Ref. Currie_69 . To correct for the effect of microchanneling in the stopping medium, the nuclear stopping power was reduced by a factor = 0.7 (cf. Refs. Ziegler_85_1 ; Keinonen_84 for more details). According to the calculation, the distribution of the stopping times of the 212Po recoils is characterized by a mean value of 1.35 ps and a variance of about 0.372 ps2.
The line-shapes of the transitions to be analyzed were obtained using the coincidence matrices by setting gates on fully stopped -ray peaks belonging to transitions depopulating levels lying below the level of interest. The response functions of the cluster detectors in our experiment was characterized by small asymmetry towards lower energies which was taken into account too. Further, for the line-shape analysis, the natural time-dependent functional form of the population of the investigated level was used, namely,
| (2) |
which represents a superposition of exponentials with coefficients determined by the decay constants of the levels participating in the cascade and by the branching ratios at every level. In the general case, a fitting procedure which aims to determine simultaneously many decay constants is hindered by the necessity to find a multiparameter solution, including some parameters describing the non-observed or side-feeding. In the present case, however, it was established for all levels depopulated by Doppler-shifted transitions that their observed discrete feeding is slow, and responsible only for part of the intensity of the unshifted fraction of the line-shape. The rest of the feeding is very fast, corresponding to (nearly) direct population of the levels of interest. This feature significantly simplifies the analysis, since the intensity balance at every level unambiguously fixes the areas of the “slow” and “fast” fractions of the lineshape. Then, the only remaining parameter to be determined is the decay constant of the level of interest or its lifetime ().
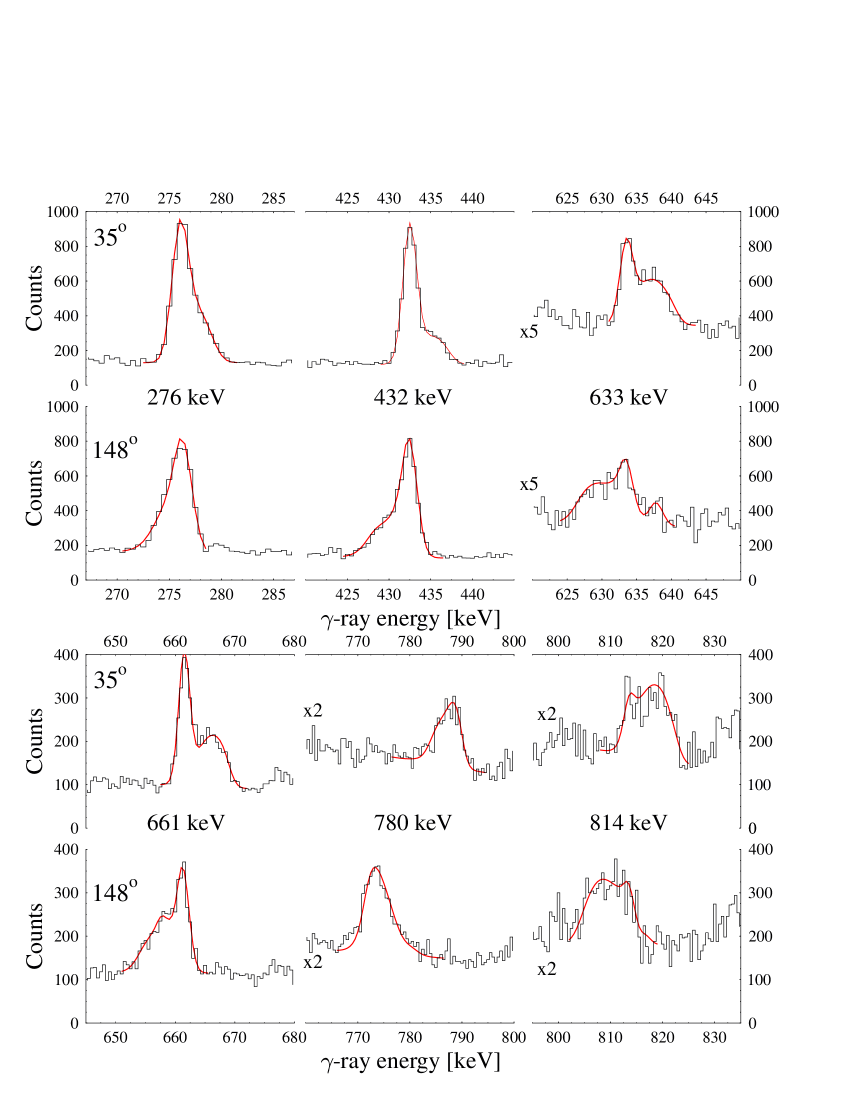
Examples of line-shape analysis at the forward angle of 35∘ and the backward angle of 148∘ are displayed in figure 8, and all the results are summarized in tables 6 and 7.
| State | Feeding(a) | Decay | (a) | |
|---|---|---|---|---|
| (keV) | Slow | Fast | Eγ(keV) | (ps) |
| 1744 | 33(7) | 67(7) | 612.3 | 0.48(15) |
| 1751 | 68(4) | 32(4) | 276.1 | 0.48(20) |
| 1787 | 68(3) | 32(2) | 432.3 | 0.45(8) |
| 1946 | 13(4) | 87(4) | 813.6 | 0.47(15) |
| 2016 | 44(3) | 56(3) | 661.3 | 0.49(16) |
| 2465 | 30(4) | 70(4) | 633.3 | 0.61(16) |
| 3155 | 0 | 100 | 780.4 | 0.12(6) |
(a) the number in parenthesis is the error in the last digit.
| State | Decay | (a) | State | Decay | (a) |
| (keV) | Eγ(keV) | (ps) | (keV) | Eγ(keV) | (ps) |
| 2667 | 563.8 | 1.4 | 2975 | 1620 | 1.4 |
| 2837 | 1005 | 1.4 | 3011 | 406.6 | 1.4 |
| 2860 | 757.2 | 1.4 | 3024 | 1669 | 1.4 |
| 2864 | 490.2 | 0.55 | 3203 | 1371 | 1.4 |
| 2867 | 397.7 | 1.4 | 3210 | 740.2 | 1.4 |
| 2881 | 1049 | 0.55 |
As discussed previously (see sect. III.2), most of these transitions have an E1 multipolarity. All the other transitions having an energy lower than 1 MeV are also assigned as E1, since their transition strengths, calculated for M1 or E2 multipolarities, would lead to unexpectedly large values.
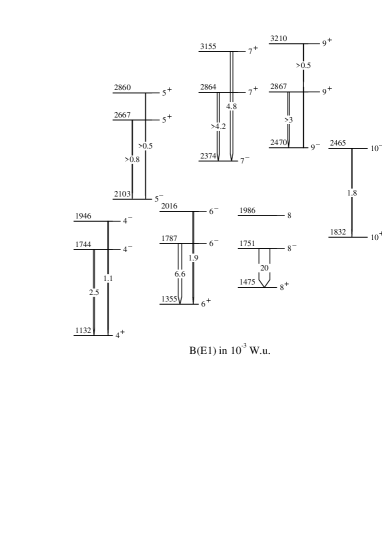
The values of the B(E1) reduced transition probabilities have been calculated, taking into account the experimental values of the coefficients (see table 5). The results, given in table 8, are displayed, as a function of their location in the level scheme, in fig. 9 and will be discussed in Sect. IV.4.
| Eγ(E1) | B(E1)(a) | B(E1)(a) |
|---|---|---|
| (keV) | () | (W.u.) |
| 276.1 | 4.6(23) 10-2 | 2.0(10) 10-2 |
| 398.0 | 7.0 10-3 | 3.0 10-3 |
| 406.6 | 6.5 10-3 | 2.8 10-3 |
| 432.3 | 1.5(3) 10-2 | 6.6(12) 10-3 |
| 490.2 | 9.6 10-3 | 4.2 10-3 |
| 563.8 | 1.7 10-3 | 7.6 10-4 |
| 612.3 | 5.7(18) 10-3 | 2.5(7) 10-3 |
| 633.3 | 4.1(11) 10-3 | 1.8(5) 10-3 |
| 661.3 | 4.4(14) 10-3 | 1.9(6) 10-3 |
| 740.2 | 1.1 10-3 | 4.8 10-4 |
| 757.2 | 1.0 10-3 | 4.5 10-4 |
| 780.4 | 1.1(6) 10-2 | 4.8(26) 10-3 |
| 813.6 | 2.5(8) 10-3 | 1.1(3) 10-3 |
(a) the number in parenthesis is the error in the last digit.
III.5 Peculiarity of the 212Po level scheme obtained in this work
A close examination of fig. 6 reveals that the same basic structure arises three times, which expands above the I+ yrast states with I = 4, 6, 8 (the fact that this was not observed above the 2 state in our experiment can be due to the trigger level used to record the events). This structure comprises:
-
two I- states (drawn in magenta) which only decay to the I+ yrast state via an enhanced E1 transition.
-
one (I + 1)- (drawn in blue) which decays to the I+ and (I + 2)+ yrast states, as well as to the two I- states (drawn in magenta). Moreover, in two cases, the decay to the low-lying (I + 2)- state is also observed.
-
two (I + 1)+ states (drawn in violet) which only decay to the (I + 1)- states (drawn in blue) via an enhanced E1 transition.
Such a feature gives confidence in the spin and parity assignments we have done using all the experimental results reported in the previous sections.
III.6 branching ratios
Several yrast states of 212Po were reported to partially decay via emission to the ground state of 208Pb, as the corresponding lines were clearly identified ba78 ; li78 ; le80 ; es84 . The branching ratios given in column 4 of table 9 are those quoted in the last evaluation of the nuclear spectroscopic information for the =212 nuclides NDS . It is noteworthy that the numbers for the 4+, 6+, and 8+ states are very large, they come from the analysis of the decay of the 9- isomeric state of 212Bi which populates excited states of 212Po (see ref. es84 ). The value, (), is well greater than the one previously determined using - coincidence li78 , ().
| State | Iπ | T1/2 | (%) | T | |
|---|---|---|---|---|---|
| (keV) | ns | from NDS | new value | ns | |
| 0 | 299(2) | 100 | 100 | 299(2) | |
| 727 | 0.033 | 0.033 | |||
| 1132 | |||||
| 1355 | 0.76(21) | 25(10) | |||
| 1475 | 14.7(3) | 490(150) | |||
Large values of branching ratios could easily be confirmed by intensity balances in our -spectra gated by at least one transition lying in the top of the level scheme. Indeed any emission would lead to a loss of the total intensity (i.e. including electron conversion) of the transitions located below the emitting state. From the analysis of such double-gated spectra, we did not confirm any large value of : the five yrast transitions (357 keV, 120 keV, 223 keV, 405 keV and 727 keV) exhibit total intensities which are constant within the error bars.
In order to go further, we have carefully examined the four papers published on this subject ba78 ; li78 ; le80 ; es84 .
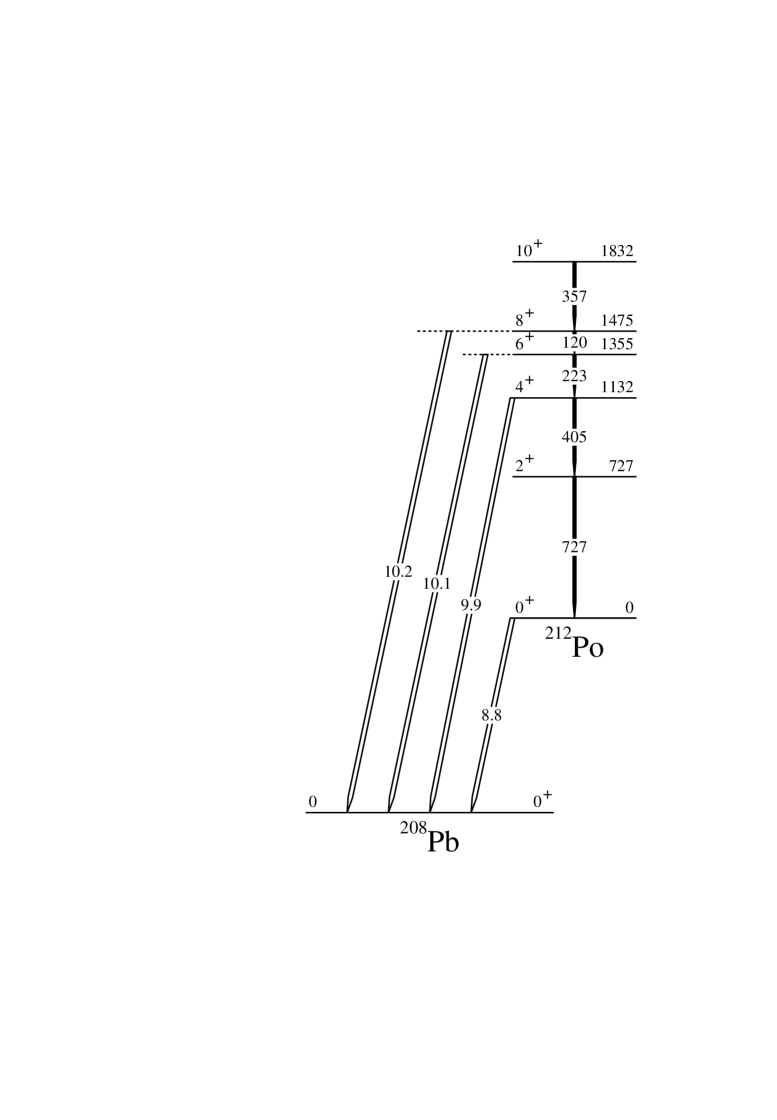
Baidsen et al. ba78 measured three -lines of energies 9.89 MeV, 10.10 MeV, and 10.22 MeV (see fig. 10), having relative intensities of 8%, 46%, and 46%, respectively. These lines were interpreted as the -decays of three excited states of 212Po, lying above 1 MeV excitation energy. Simultaneously, from results of coincidences and half-life measurements, Lieder et al. li78 established (i) a 10.18 MeV line deexciting a state with T1/2=14.2(24) ns in 212Po and (ii) several transitions correlated in time with the 8.78 MeV line emitted by the ground state of 212Po. This led to the identification of the , yrast states (from the cascade 223-405-727) and the 14.2 ns isomeric state was interpreted as the yrast state, at 1423 30 keV from the energy balance of the and lines. Moreover, the intensities of the and transitions deexciting this new state were found to be =0.06(1) and =0.94(1), respectively.
This has been confirmed two years later from coincidences le80 , particularly the 120 keV transition deexciting the yrast state was measured for the first time and the transition deexciting the yrast state was clearly resolved from the one deexciting the yrast state, both with similar intensity, whereas the line associated with the state was well weaker (in agreement with results of ref. ba78 , above-mentioned).
At this stage, we can conclude that the 10.18 MeV line of ref. li78 is the doublet (see fig. 10) of the two lines at 10.1 MeV and 10.2 MeV given in refs. ba78 ; le80 . Thus the value attributed at that time to the yrast state (6%) has to be divided by 2, the second part being ascribed to the decay of the yrast state. These results, which are quoted in column 5 of table 9, are now in quantitative agreement with our intensity balances.
The result of the decay of the 9- isomeric state of 212Bi made by Eskola et al. es84 , which was adopted in the last compilation NDS , indicates very strong components of emission from the yrast states of 212Po which were neither found in the previous experiment li78 nor in our data set. Moreover, the spectrum displayed in that paper does not corroborate such a result, as the intensity of the group of MeV is less than the one corresponding to the 212Po ground state decay, by more than one order of magnitude. So we can wonder whether there is a misprint in ref. es84 , the number of decay of the excited states being reversed with the one of the ground state.
The new values of the partial half-lives of the yrast states are given in the last column of table 9, they will be discussed in the next section in connection with the cluster structure of the states.
IV Discussion
It would be very straigthforward to predict the structure of 212Po, with four nucleons outside 208Pb, in terms of shell-model (SM) configurations, using the single-particle states in the mean field of the doubly-magic core. Nevertheless as the four nucleons are two protons and two neutrons, we have also to take into account the four-particle correlation leading to the formation of the -particle. In this section, we aim to isolate the effects of four-particle correlations on the properties of the excited states of 212Po (excitation energy, spin and parity, deexcitation modes). For that purpose, we use empirical arguments from the comparison with the neighbouring isotopes and isotones which are mainly described within SM configurations.
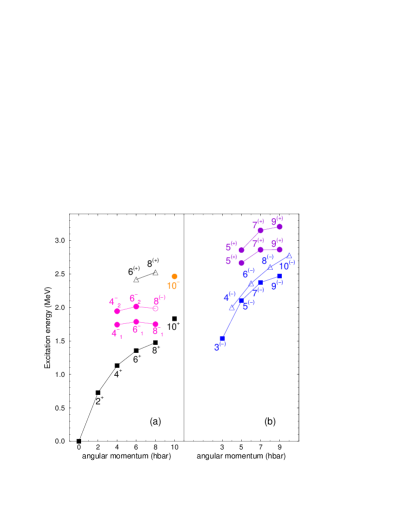
Figure 11 displays most of the 212Po states observed in the present work, grouped as a function of their underlying structures which are reviewed by turns:
-
the yrast positive-parity states (in black) are discussed in terms of two-particle excitation, as their excitation energy as a function of angular momentum follows the typical curve expected in case of pair breaking ri80 . Nevertheless several features point out the simultaneous effect of four-particle correlations (sects. IV.1 and IV.2)
-
the negative-parity states (in blue) involve the coupling of the low-lying 3- octupole vibration to the excitation of the valence neutrons (sect. IV.3)
-
the non-natural parity states (in magenta, orange, and violet) are the fingerprints of the ’ + 208Pb’ structure (sect. IV.4).
IV.1 Is the nucleon-pair breaking the unique excitation mode of 212Po at low energy?
The first excited states of 210Pb128 and Po are text-book examples of residual interaction in a two-particle configuration, namely and , respectively. While the energy interval of the whole multiplet extends over 1557 keV for the two-proton case, the one of the two-neutron configuration is more compressed (1278 keV) (see the top part of fig. 12). That is directly connected to the energies of the residual interactions, as discussed below.


The structure of the first levels of Po128 (see fig. 12) would be described as a superposition of the excitations known in its two even-even neighbours. The low energy of the 2 state (727 keV) indicates that the part of its wave function is likely stronger than the one. The fact that the neutron pair breaks more easily than the proton one beyond the doubly-magic nucleus 208Pb, is corroborated by the empirical values of the proton (neutron) pairing energies extracted from the measured binding energies of the ground states of the odd-Z (odd-N) nuclei surrounding 212Po. In order to avoid the effect of the extra binding energy of the doubly-magic nucleus 208Pb, we use the three-point formula sa98 , defining a local average of the masses of two odd-A nuclei which is compared with the observed mass of the even-even 212Po nucleus:
| (3) |
| (4) |
The neutron pairing energy, = 826(2) keV, is lower than the proton one, = 1150(3) keV, by 320 keV333The same difference is obtained when computing associated to 210Po and associated to 210Pb..
Noteworthy is the fact that a similar situation occurs in other nuclei located just above the doubly-magic core of 132Sn (see the bottom part of fig. 12). Firstly, the two-neutron configuration of 134Sn leads to a more compressed level scheme than the two-proton configuration of 134Te. Secondly, the low energy of the 2 state of 136Te occurs in concert with a low value of the neutron pairing energy. The three-point formula give 1320(60) keV and 730(82) keV. Thus the neutron pair breaks more easily than the proton one and the 2 wave function of 136Te should contain a large component of neutron excitation. Such a scenario is strengthened by the B(E2; 0+ 2) values, which have been recently measured by Coulomb excitation in inverse kinematics Radf05 . The value obtained in 134Te (4.7(6) W. u.) is stronger than the 134Sn one (1.4(2) W. u.), as expected from their different excitation processes (breaking of a proton pair versus a neutron pair). Moreover the result obtained in 136Te has confirmed that the wave function of its 2 state mainly comes from neutron excitation te02 ; co07 .
Unfortunately the leading role of neutron excitation in the wave function of the 2 state of 212Po cannot be validated by the value of the B(E2) reduced transition, as it is not known. Nevertheless the comparison of the B(E2) values within the seniority-2 states of the three neighbours is especially instructive in this respect (see fig. 13).
As expected, the values of 210Po are larger than those of 210Pb, owing to their different excitation processes (proton pair versus neutron pair). Similarly the values of the 6 state and 8 state of 212Po, calculated using the shell-model approach po87 (see the empty circles in fig. 13) are low since these states are predicted to come mainly from neutron excitation, as above-mentioned. On the other hand, the measured values (ref. NNDC and this work for the new values of the / branching ratios) are greater than the calculated ones by one order of magnitude, implying that these 6 and 8 states are complex. Even though their energies are rather well reproduced from the sole two-neutron excitation, other excitation modes have to be taken into account, such as the + 208Pb cluster states which lead to very large values of B(E2) as displayed in fig. 13.
Before closing this section, we want to recall what SM configurations were attributed to the high-spin yrast states po87 . The excitation of one neutron to the second orbit above the magic number gives the configuration, whereas the excitation of one nucleon to the first intruder orbit above the magic numbers gives either or . Thus, we expect three multiplets of states with spin values Iπ = 1+ to 10+, 2- to 13-, and 2- to 11- respectively. Since the two nucleons have the same character (particle-particle), the energies of the states having the extreme spin values (1+ and 10+, 2- and 13-, and 2- and 11- respectively) are the most lowered by the residual interactions. That provides reliable assignments for the yrast states located at 1832 keV (10+), 2769 keV (13-), and 2409 keV (11-). It is worth pointing out that in the framework of the SM approach, the levels with Iπ = 4- to 9- are expected above 2409 keV, the energy of the lowest negative-parity level. As for the higher spin values (I 10+), they are obtained from the simultaneous excitation of the two pairs of nucleons, (Imax = 16+) or (Imax = 18+).
IV.2 Are the -decays of 212Po enhanced ?
Besides its ground state which decays by emission, 212Po has several excited states which are also emitters, some of the partial half-lives are given in the last column of table 9 (sect. III.6). The present section is devoted to the comparison of the -emission probabilities of 212Po to those of the neighbouring isotopes and isotones in order to show empirically that the cluster structure, + 208Pb, plays an important role in the process.
The well-known Geiger-Nuttall plots show the correlation between the decay half-life and the energy of the emitted :
| (5) |
The parameters are usually obtained by fitting the data associated to the ground states of nuclei of each isotopic series. It is important to note that when an isotopic series crosses a neutron magic number, such as =126, the results separate into two groups, each one having its own parameters bu90 . In parallel, intensive works have been done in order to obtain a universal description of decays, as well as cluster radioactivity (see, for instance, the new law recently published in ref. qi09 ).
For our purpose, we have only used the data associated to nuclei with =130-136 of four isotopic series (84Po, 86Rn, 88Ra, 90Th), excluding the nuclei of interest, the =128 isotones. The values of the two coefficients of the Geiger-Nuttall relations (eq. 5) are given in table 10 and the fits are drawn in fig. 14.
| N | a | b | HF(N=128) | |
|---|---|---|---|---|
| 90Th | 130-136 | 139.41.4 | -51.980.50 | 1.4 |
| 88Ra | 130-136 | 136.10.9 | -51.500.35 | 1.8 |
| 86Rn | 130-136 | 131.91.5 | -50.840.58 | 2.2 |
| 84Po | 130-134 | 128.80.4 | -50.300.16 | 2.3 |
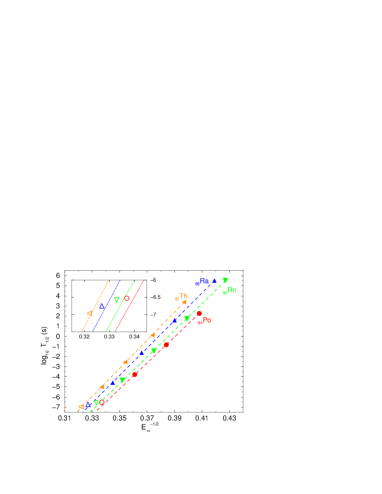
The half-life values extend over 10 orders of magnitude, thus we give a zoom on the behaviour of the four =128 isotones, in the inset of fig. 14. Their measured half-lives are greater than the values expected from the fits (each empty symbol lies above the corresponding line), allowing us to calculate the hindrance factors (HF), i.e. the ratio of the experimental half-life and the extrapolated value (given in the last column of table 10). Equation (5) mainly accounts for the tunnelling through the potential barrier, but does not take into account any variation of the probability of formation in the parent nuclei. Actually the quality of the fits shown in fig. 14 proves that this probability remains almost the same along an isotopic series as soon as at least two pairs of neutrons are available (i.e. N 130). On the other hand, the hindrance factors of the N = 128 isotones (HF 1) mean that it is more difficult to form an particle in the parent nuclei which have only two neutrons above a magic number. As seen in the last column of table 10, the HF values increase regularly as is decreasing from = 90 to 86, while the value for Po is almost the same as the Rn one. This means that the 212Po half-life is smaller than expected from the behaviour of its heavier isotones. Such a result is likely due to a greater value of the probability of formation in the 212Po ground state, a sign of its cluster structure, + 208Pb. It is worth recalling that the amount of clustering predicted by an hybrid model comprising both shell and cluster configurations va92 is high (30%).
Using the partial half-lives given the last column of table 9, the HF values of two excited states of 212Po can be computed as well, HF and HF. In those cases, because of the conservation of the total angular momentum, the alpha emission occurs at non-zero value of orbital angular momentum, giving rise to a centrifugal potential which increases the potential barrier and slows down the tunnelling process pr75 . It would have been interesting to make quantitative comparisons with transitions involving similar variations of angular momentum in neighbouring nuclei, in order to look for hint of cluster structure in these excited states. Unfortunately the number of cases available in the literature NNDC is too scarce.
IV.3 Excitations due to an octupole mode in 212Po
The octupole mode is well known in the heavy nuclei. It gives rise to the lowest excited state of 208Pb, with E = 2.614 MeV and Iπ = 3-, the E3 transition towards the ground state being collective, B(E3) = 33.8(6) . The structure of this octupole vibration comprises many coherent particle-hole excitations across the two magic gaps at and involving several single-particle orbits with . When the Fermi levels are located well above these two gaps, namely for 134 and 88, the octupole mode is enhanced because of strong octupole couplings between two pairs of orbits ( in the one hand, in the other hand).
In between, there are various mixings of the 3- excitation of the 208Pb core and the single-particle excitations from these pairs of orbits. For instance, in 210Pb, the 3- collective excitation of the core and the 3- state of the configuration, expected close in energy, are so strongly mixed that the measured octupole strength is split into two states 1 MeV apart (1869 keV and 2828 keV). They account for the full B(E3) intensity which has been observed in 208Pb and as they share this intensity in the ratio 2:1 el71 , the energy of the 3- collective excitation can be computed, E 2.2 MeV.
Moreover, one can expect that adding nucleon pairs to 208Pb would result in a greater softness of the collective 3- octupole mode, with a lowering of its energy well below 2.614 MeV. This was put forward in order to explain the behaviour of the E3 strength in the isotones, in the framework of particle-octupole vibration coupling dr89 . The evolution of the excitation energy of the 3- collective state is displayed in fig. 15, both as a function of and as a function of .
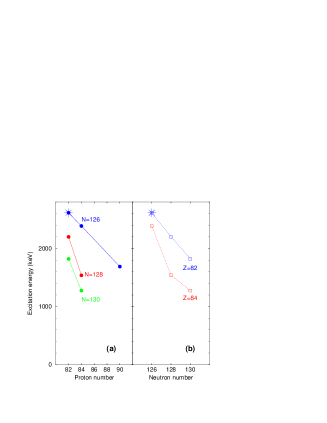
The decrease in energy is linear when adding proton pairs or neutron pairs to the doubly-magic core. The slope is 220 keV per proton pair (see the blue solid line in fig. 15a) and 400 keV per neutron pair (see the blue dotted line in fig. 15b). On the other hand, the decrease is stronger when adding both proton pairs and neutron pairs (see the slopes of the red or green lines).
The case of 212Po seems peculiar as shown by the break in the red dotted line (see fig. 15b). When assuming a linear behaviour as a function of neutron number for , the energy of its 3- state would be 300 keV higher than measured. This is more likely the result of some mixing. It could involve the configuration as in 210Pb, discussed above. Nevertheless the effect of the cluster structure, + 208Pb, should not be neglected. It is worth pointing out that the 10.302 MeV -ray, observed in ref. le80 , that defines an excited state at 1547(10) keV NNDC could be assigned to the 3- state at 1537 keV. The fact that the -emission can compete with the decay would be a sign of a cluster part in the wave function of the 3- state.
At higher excitation energy, we can expect negative-parity states from the coupling of the 3- collective state to the valence nucleon excitation. In principle, several multiplets of states should be grouped at excitation energies given by the 3- energy and the positive-parity yrast spectrum. Because of the residual interactions, the multiplets are no longer degenerated in energy and the highest-spin states of each multiplet would be the lowest ones. Such a behaviour is well known in the region of 146Gd, where the octupole excitation also plays an important role.
The yrast states of 148Gd with two valence neutrons outside the 146Gd core nucleus have been identified and discussed in terms of spherical shell model and couplings of two valence nucleons to one octupole phonon pi90 . The four lowest yrast states up to 6+ arise from the configuration (see the left part of fig. 16). The coupling of this configuration to the 146Gd 3- core phonon gives rise to a lot of negative parity levels. Some of them are mixed with the states from the excited configuration which gives a multiplet of eight states (3- Iπ 10-). As a result, the first states with negative-parity display a characteristic behaviour, one branch is formed by the first states having the odd values of angular momentum, while the first states having the even values are located slightly higher in energy (see the blue symbols in the left part of fig. 16). Lifetimes of excited states in 148Gd were measured po03b : all the B(E1) values of the transitions linking the negative-parity states with odd spin values to the positive-parity yrast states are around 10-5-10-6 W.u., i.e. within the ”normal” range.
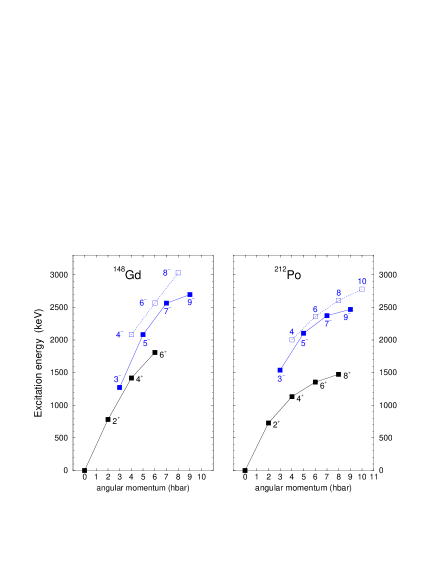
It is worth pointing out that the two neutron shells involved in 148Gd have their counterparts in 212Po, with one unit larger angular momenta and ( and ). This allows us to make reliable extrapolations to the case of 212Po. The comparison between the left and the right parts of fig. 16 indicates unambiguously that the branch comprising the 5-, 7-, and 9- states comes mainly from the couplings of two valence nucleons to one octupole phonon. Moreover, four states with even-spin values (at 2003, 2363, 2604, and 2780 keV), which decays the odd- states, probably form the second branch of negative-parity states in 212Po as observed in 148Gd (see the blue open squares in fig. 16).
IV.4 Cluster structure of the low-lying states of 212Po
Many theoretical works were devoted to the calculations of low-lying states of 212Po assuming an unmixed -208Pb cluster structure (see for instance refs. bu94 ; ho94 ; oh95 ; bu96 ), the potential being either phenomenological with different forms (such as square well, cosh potential, or a modified Woods-Saxon function), or obtained from a double folding procedure (i.e. the real part of the optical potential giving a good description of the + 208Pb scattering). In both cases, the numerical values of some free parameters were determined to reproduce the energies of the yrast states of 212Po, either exactly bu94 ; ho94 ; oh95 or at the best bu96 . It is worth pointing out that without these free parameters, all the predicted spectra of the yrast states are inverted (the highest-spin states lying below the lowest-spin ones, at variance with the experimental data). The main success of these calculations (as mentioned above, at the end of sect. IV.1 and fig. 13) is the better description of the B(E2) values inside the ground-state band, indicating that the wave-function of the yrast states having even-I and positive-parity values do possess some cluster content.
IV.4.1 Enhanced E1 transitions
A major result of the present work is the observation of many strongly enhanced E1 transitions connecting several excited states to the yrast ones, having the same spin values (see fig. 9). Moreover as outlined above (at the end of sect. IV.1), non-natural parity states, such as 4-, 6-, and 8-, are not expected below 2.4 MeV excitation energy in the SM approach.
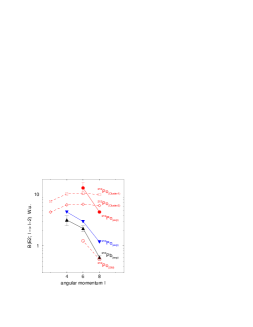
Enhanced B(E1) values are commonly found in nuclei exhibiting an electric dipole moment, such as light nuclei described in terms of a bimolecular system rotating about its center of mass, or heavy nuclei displaying octupole deformation ah93 ; buna96 . Some typical values are shown in fig. 17 using filled symbols (Sm isotopes with , 225Ra and 225Ac NNDC , cluster states of 18O ga91 ). They are one order of magnitude greater than those of transitions measured in octupole-vibrational nuclei, such as 148Gd, 225Ac, 231Th, 231Pa (shown with empty symbols) and three orders of magnitude greater than those of single-particle transitions in Bi isotopes.
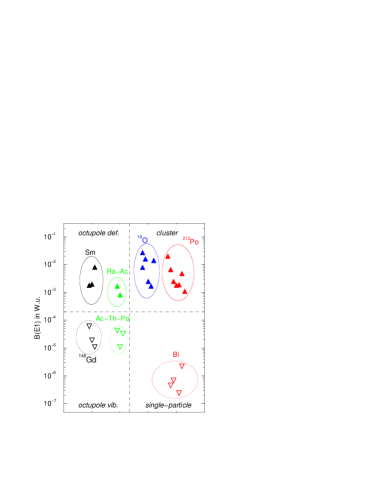
More generally, when a nucleus clusterizes into fragments with different charge to mass ratios, the center of mass does not coincide any more with the center of charge, and a sizeable static E1 moment may arise in the intrinsic frame ia85 . The dipole moment is
| (6) |
where the parameter is the distance between the centers of mass of the two fragments (see Eq. (1) of Ref. ia85 ). Assuming two spheres in contact, the dipole moment of the +14C system is 0.9 fm and very large values of E1 rates have been found in 18O ga91 (see the blue symbols in fig. 17). In the same way, the value of the +208Pb system is as large as 3.7 fm, which would lead to very enhanced E1 transitions. It is worth noting that the E1 rates measured in the present work (shown with the red filled symbols in fig. 17) are definitely located in the top part of the figure. This shows the ’+208Pb’ structure of the even-I negative-parity states, which can be considered as pure cluster states since they are too low in energy to be accounted for using the SM approach (see the end of sect. IV.1).
One way of characterizing the cluster content of states, which has been commonly done for the light nuclei, is measuring their -decay width. Because of their non-natural parity, the -decay of the 212Po cluster states to the 208Pb ground state is expected to be forbidden (parity violation), although the energy factor would be very favourable. On the other hand, the -decay of the 212Po cluster states to the 3 excited state of 208Pb is allowed. Nevertheless the available energy for such an emission is so low that the -decay cannot compete with the very enhanced -decays, measured in the present work.
IV.4.2 A possible model
Following the ansatz of Ref. va92 dealing with the ground state of 212Po and taking into account the conclusions of the previous sub-sections, we suppose that the wave function of every excited state of 212Po can be written as the sum of two parts:
| (7) |
where stands for the pure shell-model piece and takes account of the clustering. This is the same as in our previous work as10 with this difference that here we formulate the latter using a more microscopic point of view. It may be obtained from a GCM calculation in the following way,
| (8) |
where the indices indicate that the HFB wave function is projected on good particle number (neutrons and protons). The variable indicates the very asymmetric fission path of the particle on its way to disintegration. In the end of the process, will correspond to the relative distance of the c.o.m. coordinates of the Pb core and the particle. In fig. 18 we show a series of typical ”Pb + ” shapes which should contain as a function of q (we agree that such shapes would be difficult to create technically: It is like a very asymmetric fission calculation).
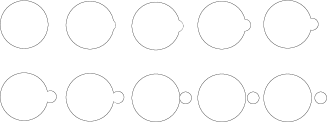
One should be aware of the fact that expressed in terms of excitations of the spherical 208Pb core + valence particles contains complicated many particle-many hole configurations (many quasi-particle configurations) such as, e.g. 5p-1h, 6p-2h,…9p-5h, etc., creating the cluster configuration. We put a prime on the integration sign to indicate that we took out of the sum the 4p-0h shell-model configurations, , which we wrote formally apart in eq. 7 in order to ease discussions below.
After minimisation of energy with respect to the amplitudes the corresponding GCM Schroedinger equation will supposedly contain a typical double-well potential for the particle sitting on the right or left hand side of the Pb core. We suppose that the individual potential wells are deep enough to accomodate two states, the ground state and an excited state (= 0 and 1). The excited state may be interpreted as a vibration of the particle against the 208Pb core. The finite barrier will allow for tunnelling and the left-right degeneracy will be lifted to give rise to four different states with alternating parities,
| (9) |
The next step is to project the four wave functions on good spin value. We surmise that the small -grain on top of 208Pb perturbs sphericity only slightly. It will produce double-well scenarios weakly depending on spin. This naturally will produce for each spin quadruplets of states with alternating parities, i.e. four components for eq. 7. Let us mention that spin projection also takes care of the mode where the particle vibrates against the Pb core.
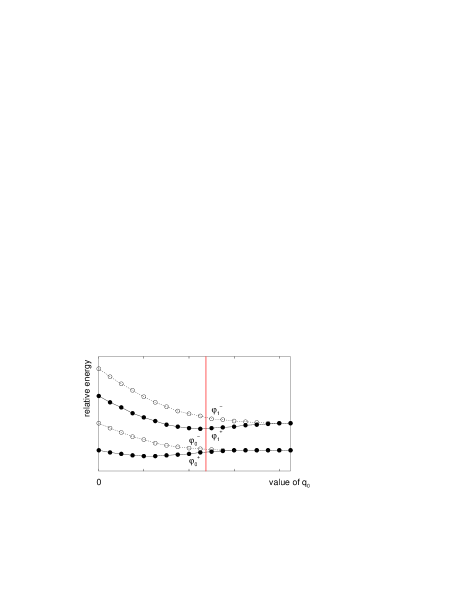
These four cluster states still have to be mixed and orthogonalized with the SM configurations as indicated in eq. 7. Among the low-lying quadruplet of states belonging to the yrast band, only the positive-parity states will be affected. Actually the mixing may be relatively strong (it is predicted that the ground state contains about 30% alpha-cluster configuration va92 ) pushing the other positive parity states up into energy regions where the highest member is yet to be detected. This also eventually explains why the natural order of +, -, +, - parities is changed to +, -, -, +. This picture qualitatively explains the experimental situation for the quadruplet of states of even spin comprising the ones of the yrast band (see fig. 11a). One easily imagines that the projection on odd-spin values creates states at higher energy, since already at sphericity the odd-spin, negative-parity states are above the ones with even spins. Therefore, the whole scenario shown in fig. 11 could find a natural explanation within the above lines of thought.
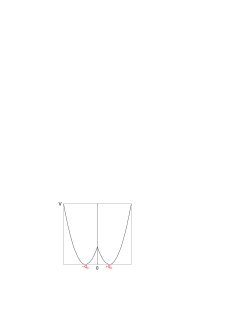
To be slightly more specific, let us discuss a completely phenomenological model imitating schematically the GCM calculation. The deformation Hamiltonian is then
| (10) |
where is an adjustable inertia, depending eventually on spin and is a double-well potential which for convenience may be taken as a double-oscillator potential, a typical textbook example me61 , which is sketched in the top part of fig. 19. The barrier penetration, which is a function of the value, leads to the energy splittings of the and eigenstates (cf. eq. 9): The relative energies of these four states are drawn in the bottom part of fig. 19.
The potential parameters also may depend on spin stemming from the spin projection. Using the dipole operator, as defined in eq. 6 and supposing that the cluster configuration of the even-parity yrast states is admixed with 30 percent, we get a right order of magnitude for the values. Making the oscillator length of the potential slightly spin dependent, we also can reproduce the falling tendency of B(E1) vs (see fig. 9) rather accurately.
The above scenario remains on a very schematic level. It should be verified by more microscopic studies which are planned for the future.
IV.4.3 Outlook
The oscillatory motion of the -core distance around the equilibrium position is proposed for the first time. This would be a novel manifestation of -clustering, never noticed in light systems. In those cases, the -core system can rotate collectively about its center of mass (for a review of the so-called nuclear molecules, see vo06 ) and it is probably difficult to isolate an oscillatory motion, if any.
In the chart of nuclides, there are two cases similar to 212Po: Te as ’+100Sn’ and Te as ’+132Sn’. These -core systems fulfill the two prerequisites:
-
The ground state of the composite nucleus is above or close to the -decay threshold (cf. the Ikeda diagram displayed in fig. 1 of ref. vo06 ).
-
The center of mass of the -core system is nearly merged with the center of the spherical core, so as the system cannot rotate collectively.
Having the same value of dipole moment as 212Po, 136Te should exhibit enhanced electric dipole transitions. On the other hand, the decay of the cluster states of 104Te should be different since the E1 transitions are hindered as there is no shift between the center of charge and the center of charge, the two clusters having . Thus the emission could compete for their decay.
One may speculate that adding more ’s to the 208Pb core, like, e.g. two ’s to give 216Rn, may exhibit similar physics. For example the two ’s may move coherently as a 8Be and then the present scenario may repeat itself partially, or the two ’s may move independently and, then, more complex structures can be expected.
V Summary and conclusions
In summary, we have used the transfer of an -particle induced by a heavy-ion beam at very low energy to populate excited states of 212Po. The level scheme has been extended up to MeV excitation energy. The angular distributions and angular correlations have been analyzed in order to assign spin and parity values to many observed states. Several lines with E 1 MeV have been found to be strongly shifted and broadened by the Doppler effect, allowing for the measurements of the corresponding lifetimes by the DSAM method. The values, found in the range [0.1-0.6] ps, lead to very enhanced E1 transitions.
The excited states of 212Po can be distributed among two groups:
-
The first one comprises all the states having natural parity. They bear strong resemblance with those identified in the neighbouring isotopes and isotones and can be explained in terms of single-particle excitations dealing with the neutron and proton orbits lying close to the Fermi levels, as well as their coupling to the 3- octupole vibration. Nevertheless more stringent analysis reveals that several properties (such as B(E2) transition probabilities or -emission probabilities) are not accounted for by such an interpretation.
-
The second one comprises many states having non-natural parity which are mainly grouped into 2 sets, a first one with even- values around 2 MeV excitation energy and a second one with odd- values around 3 MeV. These levels only decay to the yrast states having the same value, by very enhanced E1 transitions (B(E1) – W.u.). They are the fingerprints of the ’+208Pb’ structure.
Such an ’+core’ structure is observed for the first time. It could be also identified in two other systems, Te as ’+100Sn’ and Te as ’+132Sn’. While these two Te isotopes are located very far from the stability valley, they could be close at hand, thanks to the new worldwide facilities soon available.
Acknowledgement The Euroball project was a collaboration between France, the United Kingdom, Germany, Italy, Denmark and Sweden. A.A., P.P. and M.-G.P. are very indebted to their colleagues involved in the EB-02/17 experiment devoted to the fission fragments, in which the present data on 212Po were recorded. They thank the crews of the Vivitron, as well as M.-A. Saettle for preparing the Pb target, P. Bednarczyk, J. Devin, J.-M. Gallone, P. Médina and D. Vintache for their help during the experiment. We thank Dr. M. Mirea, Dr. W. Nazarewicz, Dr. W. von Oertzen, Dr. N. Rowley, and Dr. T. Yamada for fruitful discussions. This work was partially supported by the collaboration agreement between the Bulgarian Academy of Sciences and CNRS under contract No 16946, and by contract IDEI-119 of the Romanian Ministry of Education and Research.
References
- (1) E. Rutherford and A.B. Wood, Phil. Mag. 31, 379 (1916).
- (2) I. Perlman et al., Phys. Rev. 127, 917 (1962).
- (3) H. Bohn et al., Zeit. Phys. A302, 51 (1981).
- (4) A.R. Poletti et al., Nucl. Phys. A473, 595 (1987).
- (5) M. Sugawara et al., Nucl. Phys. A443, 461 (1985).
- (6) Zs. Podolyák et al., Nucl. Instr. Meth. Phys. Res. A 511, 354 (2003).
- (7) A.B. Garnsworthy et al., J. Phys. G 31, S1851 (2005).
- (8) K. Varga, R.G. Lovas and R.J. Liotta, Phys. Rev. Lett. 69, 37 (1992) and Nucl. Phys. A550, 421 (1992).
- (9) B. Buck, A.C. Merchant, and S.M. Perez, Phys. Rev. Lett. 72, 1326 (1994).
- (10) F. Hoyler, P. Mohr and G. Staudt, Phys. Rev. C50, 2631 (1994).
- (11) S. Ohkubo, Phys. Rev. Lett. 74, 2176 (1995).
- (12) B. Buck, J.C. Johnston, A.C. Merchant, and S.M. Perez, Phys. Rev. C53, 2841 (1996) and references therein.
- (13) A. Astier, P. Petkov, M.-G. Porquet, D.S. Delion, and P. Schuck, Phys. Rev. Lett. 104, 042701 (2010).
- (14) J. Simpson, Z. Phys. A358, 139 (1997).
- (15) J. Eberth et al., Nucl. Instr. Meth. A 369, 135 (1996).
- (16) G. Duchêne et al., Nucl. Instr. Meth. A 432, 90 (1999).
- (17) M.-G. Porquet, Int. J. Mod. Phys. E13, 29 (2004).
- (18) D.C. Radford, Nucl. Instr. Meth. Phys. Res. A 361, 297 and 306 (1995).
- (19) T. Yamazaki, Nucl. Data A3, 1 (1967).
- (20) A. Astier et al., Eur. Phys. J. A 30, 541 (2006) and references therein.
- (21) P.M. Jones et al., Nucl. Instr. Meth. Phys. Res. A 362, 556 (1995).
- (22) T.K. Alexander and J.S. Forster, Adv. Nucl. Phys. 10, 197 (1978).
- (23) G. Winter, ZfK Rossendorf Report ZfK-497, 1983.
- (24) G. Winter, Nucl. Instr. Meth. 214, 537 (1983).
- (25) P. Petkov et al., Nucl. Phys. A640, 293 (1998).
- (26) F. Videbæk et al., Phys. Rev C bf 15, 954 (1977).
- (27) T. Kibédi et al., Nucl. Instrum. Methods A589, 202 (2008), http://www.rsphysse.anu.edu.au/nuclear/bricc/.
- (28) ENSDF data base, http://www.nndc.bnl.gov/ensdf/.
- (29) E.L. Church and J. Weneser, Phys. Rev. 104, 1382 (1956).
- (30) T.A. Green and M.E. Rose, Phys. Rev. 110, 105 (1958).
- (31) S.V. Nilsson and J.O. Rasmussen, Nucl. Phys. 5, 617 (1958).
- (32) H.C. Pauli, K. Alder, and R.M. Steffen, in: The electromagnetic interaction in nuclear spectroscopy, ed. W.D. Hamilton, North-Holland, Amsterdam, 1975
- (33) L.C. Northcliffe and R.F. Schilling, Nucl. Data Tables A7 (1970) 233.
- (34) J.F. Ziegler and W.K. Chu, Atomic Data and Nucl. Data Tables 13 (1974) 463.
- (35) J.F. Ziegler and J.P. Biersack, in Treatise on Heavy-Ion Science, vol. 6, ed. D.A. Bromley, (Plenum Press, 1985), p.95.
- (36) J. Lindhard, M. Scharff and H.E. Schiøtt, Kgl. Dan. Vid. Selsk. Mat. Fys. Medd., 33, no. 14 (1963).
- (37) W.M Currie, Nucl. Instr. Meth. 73 (1969) 173.
- (38) J. Keinonen, in Capture Gamma-Ray Spectroscopy and Related Topics-1984, Proceedings of the Fifth International Symposium, Knoxville, Tennessee, AIP Conf. Proc. No. 125, ed. S. Raman, (AIP, New York, 1985), p. 557.
- (39) P.A. Baidsen et al., Phys. Rev. Lett. 41, 738 (1978).
- (40) R.M. Lieder et al., Phys. Rev. Lett. 41, 742 (1978).
- (41) P. Lemmertz et al., Zeit. Phys. A 298, 311 (1980).
- (42) K. Eskola et al., Phys. Rev. C 29, 2160 (1984).
- (43) E. Browne, Nuclear Data Sheets 104, 441 (2005).
- (44) P. Ring, P. Schuck, The Nuclear Many Body Problem, Springer-Verlag, 1980.
- (45) W. Satula, J. Dobaczewski and W. Nazarewicz, Phys. Rev. Lett. 81, 3599 (1998).
- (46) D. C. Radford et al., Nucl. Phys. A752, 264c (2005).
- (47) J. Terasaki, J. Engel, W. Nazarewicz, and M. Stoitsov, Phys. Rev C 66, 054313 (2002).
- (48) A. Covello, L. Coraggio, A. Gargano and N. Itaco, Prog. Part. Nucl. Phys. 59, 401 (2007).
- (49) B. Buck, A.C. Merchant and S.M. Perez, Phys. Rev Lett. 65, 2975 (1990).
- (50) C. Qi, F.R. Xu, R.J. Liotta and R. Wyss, Phys. Rev. Lett. 103, 072501 (2009) and references therein.
- (51) M.A. Preston and R.K. Bhaduri, Structure of the Nucleus, chapter 11 (Addison-Wesley, 1975).
- (52) C. Ellegard, P.D. Barnes, E.R. Flynn, and G.J. Igo, Nucl. Phys. A162, 1 (1971).
- (53) G.D. Dracoulis et al., Nucl. Phys. A493, 145 (1989).
- (54) M. Piiparinen et al., Zeit. Phys. A337, 387 (1990).
- (55) Zs. Podolyak et al., Eur. Phys. J. A17, 29 (2003).
- (56) I. Ahmad and P. Butler, Ann. Rev. Nucl. Part. Sci. 43, 71 (1993).
- (57) P. Butler and W. Nazarewicz, Rev. Mod. Phys. 68, 349 (1996).
- (58) M. Gai et al., Phys. Rev. C 43, 2127 (1991).
- (59) F. Iachello, Phys. Lett. 160B, 1 (1985).
- (60) E. Merzbacher, Quantum Mechanics, chapter 5 (John Wiley and Sons, 1961).
- (61) W. von Oertzen, M. Freer and Y. Kanada-En’yo, Phys. Rep. 432, 43 (2006).