DARK MATTER DISTRIBUTION IN GALAXY GROUPS FROM COMBINED STRONG LENSING AND DYNAMICS ANALYSIS
Abstract
Using a combined analysis of strong lensing and galaxy dynamics, we characterize the mass distributions and the mass-to-light (M/L) ratios of galaxy groups, virialized structures in the mass range of few , which form an important transition regime in the hierarchical assembly of mass in CDM cosmology. Our goals are to not only map the mass distributions, but to also test whether the underlying density distribution at this mass scale is dark matter dominated, NFW-like as hypothesized by the standard cosmogony, or isothermal as observed in baryon rich massive field galaxies. We present details of our lensing + galaxy dynamics formalism built around three representative density profiles, the dark matter dominant NFW and Hernquist distributions, compared with the Softened Isothermal Sphere which matches baryon rich galaxy scale objects. By testing the effects on the characteristics of these distributions due to variations in their parameters, we show that mass measurements in the core of the group (), determined jointly from a lens model and from differential velocity dispersion estimates, may effectively distinguish between these density distributions. We apply our method to MOS observations of two groups, SL2SJ143000+554648 and SL2SJ143139+553323, drawn from our catalog of galaxy group-scale lenses discovered in CFHTLS-Wide imaging. With the lensing and dynamical mass estimates from our observations along with a maximum likelihood estimator built around our model, we estimate the concentration index characterizing each density distribution and the corresponding virial mass of each group. Our likelihood estimation indicates that both groups are dark matter dominant, and rejects the isothermal distribution at level. For both groups, the estimated -band M/L ratios of , is similar to other published values for groups. The Gaussian distribution of the velocities of their member galaxies support a high degree of virialization. The differences in their virial masses, 2.8 and 1.6, and velocity dispersions, 720 and 560, may indicate however that each group is at a different stage of transition to a cluster. We aim to populate this important transition regime with additional results from ongoing observations of the remaining lensing groups in our catalog
Subject headings:
dark matter — galaxies: clusters: general — galaxies: groups: general— gravitational lensing: strong — large-scale structure of universe1. Introduction
In the hierarchical assembly of mass in the standard CDM cosmogony, galaxy groups with typical masses, M few, form an important transition stage in the build up of galaxy clusters (with M) from the basic building blocks, the field galaxy population with . In clusters, which lie at the upper end of this hierarchy of virialized objects, structure evolution is driven primarily by the gravitational physics governing dark matter interactions - in clusters, with observed mass-to-light (M/L) ratios of a several hundred, the baryon fraction is too small to play any significant role. Consequently, their observed mass distributions are well fit by NFW (Navarro et al. 1997) or similar profiles which describe dark matter distributions (Lopes et al. 2009, Broadhurst et al. 2008, Tu et al. 2008, Comerford & Natarajan 2007, Rines & Diaferio 2006, Smith et al. 2005). On the scale of galaxies, however, the observed M/L 10 indicates that baryons contribute a significant fraction of their mass. The rapid cooling of baryons and condensation to the galaxy cores leads to more isothermal density profiles (Gavazzi et al. 2008, Koopmans et al. 2006, Treu & Koopmans 2004, Freeman 2001). Whether galaxy groups, which lie intermediate in the mass scale between these two classes of structures, are dark matter dominated NFW-like systems, or if they retain the isothermal signatures of their dominant central galaxies is an important but unresolved question on which we focus our investigations.
In the Cluster Infall Regions in the Sloan Digital Sky (CIRS) survey of 72 low redshift clusters, Rines & Diaferio (2006) found that the mass distributions are well fit by spherically symmetric NFW (Navarro et al. 1997) or Hernquist profiles (Hernquist 1990), popular parametric representations of dark matter distribution. Recent results of mass estimates using galaxy dynamics from detailed spectroscopy of 48 low redshift () clusters, along with mass estimates from their X-ray luminosities also show that cluster masses are dark matter dominated (Cava et al. 2009). Lopes et al. (2009) extend these cluster mass estimates up to with their NoSOCS-SDSS sample of 7400 systems. With strong lensing analysis, Broadhurst et al. (2008), Tu et al. (2008), Comerford & Natarajan (2007) and Smith et al. (2005) independently show that the slope of the cluster density profiles match the CDM prediction. From these complementary observational results, it is clear that the structure of clusters is governed by the dominant dark matter content.
For galaxies, the observed M/L10, indicates that the visible baryonic matter, gas and stars, contributes a significant fraction of the mass; early type galaxies show a higher M/L () value (Freeman 2001), indicating a larger dark matter component than their spiral galaxy counterparts. Even so, results from a joint strong lensing and stellar dynamics analysis for 15 early type galaxies at z from the Strong Lensing in Advanced Camera for Surveys, SLACS, (Koopmans et al. 2006), show that their density drops off inversely with the square of the radius, , indicative of an isothermal instead of NFW-like distribution. Within the Einstein radius, the observed contribution of dark matter to the total mass in these SLACS sample is only , indicating that the inner core is baryon rich while the dark matter is dominant only at larger radii. These results are consistent with results for 5 early type field galaxies at higher redshift () in the Lenses Structure and Dynamics survey (Treu & Koopmans 2004). In addition, the lens model for the spectacular double Einstein ring, SDSS J0946+1006, where the deflector is an early type galaxy at z=0.22, gives similar values for the power law slope of the density profile as well as ellipticity (Gavazzi et al. 2008), indicating that the distributions of mass at the scale of galaxies are clearly different from the NFW-like distributions observed in clusters. The interaction of baryons leading to rapid cooling and condensation are the likely cause of these observed differences.
In the CDM picture of hierarchical mass assembly, galaxy groups are built from field galaxies, such as those studied in SLACS. The density profile of the resulting group may then be expected to match that of the dominant central galaxy or appear as a smoothed out version of the contributions of all the group members. An isothermal mass density profile is indeed shown in a recent detailed analysis of CLASS B2108+213, a galaxy group at z=0.365, using lensing and galaxy kinematics, though the non-Gaussian velocity distribution indicates that the group is not virialized (McKean et al. 2009). With strong lensing analysis of 5 groups discovered in SDSS imaging, Kubo et al. (2009) obtain singular isothermal velocity dispersions in the range, . Similarly, with joint strong and weak lensing analysis, Limousin et al. (2009) derive for 13 galaxy groups taken from the SL2S111Strong Lensing Legacy Survey, (Cabanac et al. 2007) catalog. With stacked weak lensing, Hoekstra et al. (2001) obtain for the best fit isothermal sphere to the less massive groups in the CNOC2222Canadian Network for Observational Cosmology Field Galaxy Redshift Survey survey.
On the other hand, CDM also predicts that the dark matter distribution should be self similar over a wide range of virialised masses (Navarro et al. 1997), with groups representing the lower mass end of clusters. Parker et al. (2005) do indeed find that the weak lensing mass profiles of 116 CNOC2 galaxy groups are fit equally well by NFW and isothermal spheres. If groups are scaled down versions of clusters with NFW-like mass profiles, observed scaling relations for galaxy groups, such as the X-ray luminosity-temperature ( - T) relation, should resemble those of clusters. For local clusters, the observed relation yields (Markevitch 1998). Interestingly, this value is much higher than the CDM prediction, , which does not take into account radiative cooling of the intracluster gas or heating by supernovae and AGN feedback. For groups, Helsdon & Ponman (2000) find a much steeper slope of for a sample 24 X-ray bright galaxy groups, though Mulchaey (2004) cautions that aperture effects may play a role in this observed difference. Results from the Group Evolution Multiwavelength Study (GEMS) (Osmond & Ponman 2004) and a compilation from several galaxy group surveys (Fassnacht et al. 2008) find a smaller difference in slope. In addition, large hydrodynamical simulations indicate that merger induced star formation has a strong effect on X-ray luminosities. The active merger of galaxies in group environments may therefore lead to the observed steeper slope than that observed in clusters, as in the case of the lensing group CLASS B2108+213 (McKean et al. 2009).
All these results underline the pressing need to understand how the mass distribution and M/L ratio of groups fit within the evolution from galaxy to cluster mass scales. These structures, where of all galaxies reside (Eke et al. 2004) have masses representative of the critical break between the dark matter dominated clusters and the baryon rich field galaxy population, seen in both observations (Fassnacht et al. 2008, Mulchaey 2004, Marinoni & Hudson 2002, Helsdon & Ponman 2000), and in detailed hydrodynamical simulations (Hartley et al. 2008). The M/L ratio of groups is also strongly influenced by ongoing episodes of star formation triggered by the active mergers in the group environment. In a model comparison of the properties of virialised objects of different halo masses in various cosmologies, Marinoni & Hudson (2002) find that, for CDM, the M/L ratio increases monotonically with X-ray luminosity as for the mass range running from poor groups, M=, to that of rich clusters, . Interestingly, their models also indicate a clear break in the power law relation between optical and X-ray luminosities at the mass scale of a poor group, (consisting of , Milky Way size galaxies). Whether this break is actually seen in observations will be interesting to determine and interpret.
These unresolved issues related to the mass distribution in galaxy groups have initiated several large observational surveys, e.g, GEMS (Osmond & Ponman 2004), X-ray Multi-Mirror Large Scale Structure Survey, XMM-LSS (Willis et al. 2005), XMM/IMACS (XI) Group Project (Rasmussen et al. 2006) as well as studies using galaxy group catalogs detected in public wide field surveys, such as the SDSS DR5 (Tago et al. 2008), the 2dF (Tago et al. 2006) and the SL2S catalogs of groups with strong lensing features (referred hence as ‘lensing groups’) detected in CFHTLS Wide imaging (Cabanac et al. 2007) and (Limousin et al. 2009). Using the SDSS DR4-MaxBCG cluster catalog (Koester et al. 2007), Sheldon et al. (2009) have applied the cross correlation weak lensing method to estimate the excess mass-to-light ratio, , in these virialized systems, measured relative to the background (field) value. The impressive sample size of structures available in this catalog spans the mass scale from poor groups of a few , to rich, clusters in the redshift interval 0.1 to 0.3 (Koester et al. 2007). The stacked sample in each richness bin provides adequate S/N to trace the trend in the M/L ratio with radius extending from a few in the core to a few tens of , spanning several times the size of a cluster virial radius. Of particular relevance to our work is their result that the excess M/L correlates with the virial mass as a power law with a slope of . By integrating the radial trend up to the virial radius, , Sheldon et al. (2009) also provide detailed tables of the M/L ratios of these structures binned by richness and by optical luminosity. These weak lensing results permit us to compare and benchmark the M/L values obtained by our combined strong lensing and galaxy dynamics approach, as discussed in Section 3.6.
Using the catalog of lensing groups333All the objects in our sample are referred as groups though their actual virial masses are yet to be determined from Thanjavur et al. (2009), our objective is to characterize the density distributions and the M/L ratios of structures at this mass scale. Toward this goal, we have developed a joint analysis that combines mass constraints estimated independently from a lens model and from measured galaxy dynamics. Since the lensed image separations are in these moderate redshift groups (median z), the lens model effectively constrains the mass distribution within the core (radius ) of the group. This is complemented well by the dynamical mass estimate from the velocity dispersion of the member galaxies, which is sensitive to the mass at the scale of the virial radius (). The power of this joint approach has been well illustrated by other applications such as the characterization of early type galaxies in SLACS (Koopmans et al. 2006, Treu & Koopmans 2004). and of the lensing group, CLASS B2108+213 (McKean et al. 2009),
In Section 2, we set forth details of our formalism which relates an assumed underlying density distribution to the projected mass and the line of sight velocity dispersion (LOSVD) measured within an aperture - these are our principal observables. The goal is to verify how well observations can distinguish one density distribution from another, using only galaxy dynamics (in §2.1), refined in §2.2 with the inclusion of the lensing mass. We test our approach on the two lensing groups from our catalog for which observations are complete. Section 3 describes the instrument configuration, data reduction details, and the observed LOSVD of the member galaxies; the lens model and resulting mass estimates are given in §3.4, while the maximum likelihood estimator used to extract the parameters of our model from our observations is described in §3.5. Section 3.6 discusses our results in comparison with those from other similar investigations. Section 4 summarizes our work along with plans for future refinements.
2. Model estimates of projected mass and LOSVD for specific density profiles
For this analysis, we have chosen two parametric profiles commonly used to describe dark matter distributions, namely the Navarro, Frenk and White, NFW (Navarro et al. 1997) and the Hernquist, HRQ (Hernquist 1990) profiles, which we benchmark against the Softened Isothermal Sphere444The Softened Isothermal Sphere has a non-zero core radius to prevent the singular behavior at r=0 of the Singular Isothermal Sphere. In our description, the abbreviation, SIS, consistently represents a Softened Isothermal Sphere only, SIS, a generic model used to describe virialized mass distribution (Binney & Tremaine 1987). Our choice of the NFW and HRQ profiles for this comparison is motivated by observational results such as those from the CIRS (Rines & Diaferio 2006) cited in Section 1. We benchmark these against the SIS, which describes galaxy scale mass distributions. We do not test alternate density parametrizations such as the Kravtsov model (Kravtsov et al. 1998), which differ from the NFW profile only in the inner slope at radii less than a few percent of the virial radius; this difference has little effect on the LOSVD measured up to the virial radius. Finally, in this comparison, we assume spherical symmetry for all three profiles and neglect any effects due to triaxiality; this analysis may have to be refined if our observations indicate non-isotropic velocity distributions.
The standard representation of the three density profiles involve different sets of parameters, namely the scale radius, , for NFW (Navarro et al. 1997), the scale radius, , for HRQ (Hernquist 1990), and the core radius, , of SIS (Binney & Tremaine 1987); in addition, a second parameter is used for the normalization. In order to ensure a uniform comparison of their properties, we first recast them into a non-dimensional form with a consistent set of two parameters. The parameters chosen are the concentration index, , of the profile and the mass enclosed within a prescribed radius. In §2.1, where we compare the characteristics of the three profiles against each other, we use the virial mass of a typical rich cluster, , for the normalization (with an assumed overdensity parameter, expressed in units of the present critical density of the unverse, ). This cluster scale mass was chosen only so that our formalism may be verified by comparing the NFW results against published values in Łokas & Mamon (2001) and Willick & Padmanabhan (2000) for a halo of the same virial mass; group scale masses, more pertinent to our work, are used in the second comparison, discussed in §2.2.
In terms of these two parameters, the non-dimensional density profiles may be expressed as
| (1) |
where the scaled radius, , with being the virial radius. The function, , which describes the shape of the profile, is represented for the NFW, HRQ and SIS by,
| (2) |
| (3) |
| (4) |
where, the concentration index, , represents for NFW, for HRQ and for the SIS profiles. The functional form of the concentration parameter, , which contains the normalization scale for each profile, is obtained by setting the expression for the enclosed mass within the virial radius, , equal to the virial mass,
| (5) |
Substituting the normalized density profiles, Equations 1 - 4 and carrying out the integral in Equation 5, yields analytical expressions for for the NFW, HRQ and SIS as,
| (6) |
| (7) |
| (8) |
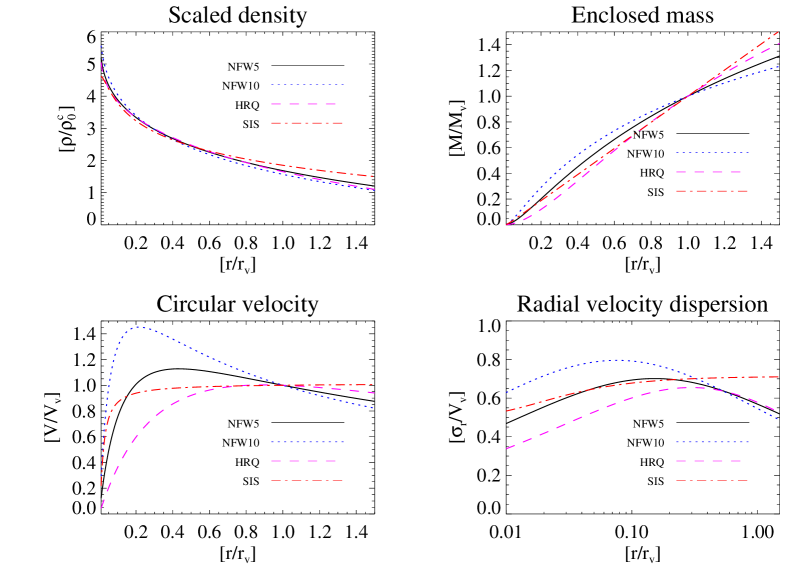
In the first part of the analysis, we have chosen the virial mass, , and the concentration index, to describe these two-parameter, spherically symmetric density distributions. In our comparison, we use two typical values for the concentration index of the NFW profile: , which corresponds to typical cluster mass scale, (), and , for cD galaxy scale halos, (Willick & Padmanabhan 2000). The former, hereafter referred as NFW5, corresponds to the typical lensing group or cluster in our sample while the latter (NFW10) includes the cases where the strong lensing is dominated by the central galaxy alone. This comparison of two concentration indices (at the same overall virial mass) is intended only to quantify the effect of the underlying scale radius on the LOSVD. Furthermore, Comerford & Natarajan (2007) have pointed out that the actual value of c in clusters may be times higher than the earlier estimates; in the current analysis, therefore, we avoid ambiguity and do not associate the NFW profiles with any names for the objects they may represent. Using the NFW5 profile as the benchmark, the concentration indices for the HRQ and SIS are adjusted to match the density profiles at the scale radius, ; this follows the approach adopted by Willick & Padmanabhan (2000) in their comparison of the NFW and Kravtsov profiles in weak lensing. The resulting density profiles, scaled by the critical density, are shown in Figure 1 (top, left panel).
With the enclosed mass distribution, Eq 5, quantities required to compute the LOSVD may be derived. Of these, the radial velocity dispersion, , is obtained as the solution of the Jeans equation for hydrostatic equilibrium (Binney 1980). Under our assumption of spherical symmetry, we neglect the effect of the anisotropy factor, . Our assumption is based on results from dark matter simulations (Cole & Lacey 1996) on cluster scales, which have borne out that , thus lending support to the assumption of isotropy in the radial velocity dispersion. Under this assumption, the scaled radial velocity dispersion may be expressed as,
| (9) |
The circular velocity at the virial radius, is the scaling factor. Using an IDL implementation of the numerical integration routines in QUADPACK (Piessens et al. 1983), we compute the double integral for . The scaled circular velocity, , and radial velocity dispersion, , for the three density profiles are compared in the bottom panels in Figure 1. Our results for the NFW profile are consistent with those of Łokas & Mamon (2001) for a similar halo, thus validating our method.
For our comparison of strong lensing and galaxy dynamics in different dark matter density distributions, we need the projected mass and the LOSVD within an observed aperture, referred explicitly as the aperture LOSVD in any context where there may be ambiguity. Expressions for the projected properties of the halo, namely the surface density, , the projected mass, and the LOSVD, , are derived first by integrating the radial profiles of the corresponding halo properties along the line of sight. At an observed 2-D aperture radius, R, the surface density is given by,
| (10) |
where, r is the 3-D intrinsic radial coordinate. For numerical stability, we carry out the integration with a change to an angular variable, (measured counter-clockwise from the axis along the line of sight), such that the scaled surface density may be expressed as,
| (11) |
where the variable, . The projected mass within the observed aperture, R, obtained by integrating the surface density within the aperture, is given in units of by,
| (12) |
with K being a variable of integration. The corresponding LOSVD, , at the 2-D radius, R, is obtained as the density weighted radial velocity dispersion. Using the results from Eq 5, 9 and 10, the scaled LOSVD may be expressed as,
| (13) |
where, as in Eqn 11, is the scaled radial coordinate. Finally, the aperture LOSVD, , is the surface density weighted value of within the observed aperture. Using Equations 10-13, the aperture LOSVD, in units of , is obtained from,
| (14) |
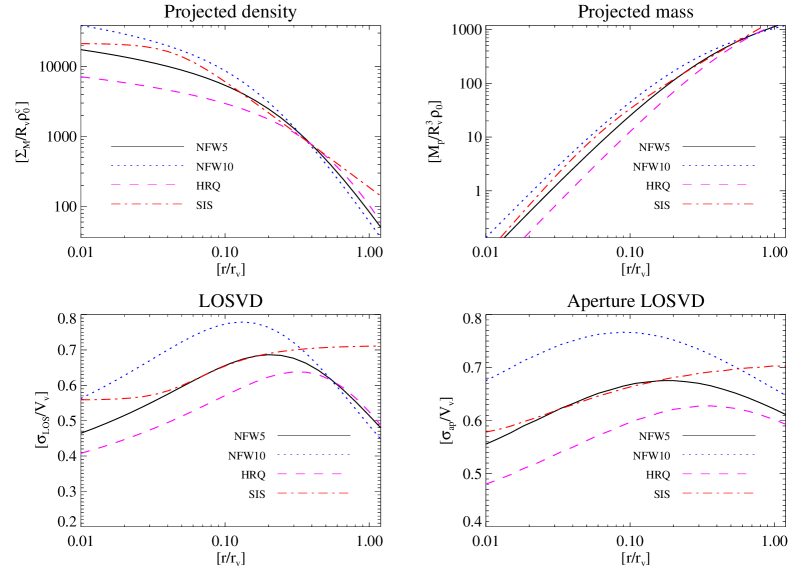
Comparative plots of these projected quantities for the different density profiles are shown in Figure 2 and discussed in the following subsection.
2.1. Results from LOSVD comparison - I
We first establish a baseline comparison of the intrinsic and projected characteristics of the three density profiles. Assuming a halo and using the NFW5 profile as reference, we adjust the concentration indices of the HRQ and SIS distributions such that their scaled densities match that of the NFW5 profile at the scale radius, (top left, Figure 1). The NFW10 profile provides a comparison for variations in the concentration index; the scale radius is this case is .
The intrinsic properties of the density distributions as functions of the scaled radius, are shown in Figure 1, and their projected counter parts as functions of the scaled aperture (= projected) radius, in Figure 2. Since the density distributions have been matched, the principal differences in the intrinsic properties arise mainly in the velocity profiles. The radial velocity dispersion of the centrally concentrated NFW10 shows a higher maximum () at a smaller radius, , compared to the NFW5 ( at ) and the Hernquist profiles ( at ); for the assumed virial mass, the circular velocity at the virial radius, . In comparison, the velocity dispersion of the SIS model remains uniform at within the core radius, then rises smoothly to plateau at at larger radii (). The differences between the radial velocity dispersions, however, are significant only within the core and the profiles, except the SIS, converge toward each other at larger radii (at ), Even though the radial velocity dispersion is not directly observed, these radial trends affect the projected LOSVD, which is the measured quantity.
The projected properties reflect the cumulative variations between these profiles and show significant differences both in the projected mass as well as in the LOSVD. The variations in these observed properties are particularly relevant for our work since lensing properties are governed by the projected mass, while the intrinsic galaxy dynamics are probed by the aperture LOSVD. As expected from the variations seen in the intrinsic properties, the principal differences lie within the core regions and become smaller at larger aperture radii; for instance, at , the observed LOSVD of NFW5 and HRQ are below that of NFW10, and lower than the SIS at this radius. Therefore, even in the case of matched densities, we expect to distinguish between the SIS and the two other density profiles with the observed LOSVD. The predicted differences between NFW5 and HRQ for this case however, are smaller than the expected errors in our observations, , making it difficult to distinguish between the two; this prediction is consistent with the observational results from the CIRS survey, (Rines & Diaferio 2006), discussed earlier in Section 1. It is for this reason that the additional constraints provided by strong lensing, which are sensitive to the projected mass distributions at smaller radii, , become particularly important, as discussed in the following subsection.
2.2. Results from Lensing + LOSVD comparison - II
The observed lens geometry, along with the measured redshifts of the deflector and source, are used to construct a lens model and thus estimate the underlying lensing mass distribution. In our lens model, we assume spherically symmetric mass distribution and that the observed lensed arcs form on the Einstein radius corresponding to the redshifts of the deflector and background source. Under these assumptions, the expression for the Einstein angle, (Schneider et al. 1992) may be inverted to obtain the projected mass within the Einstein radius. For the differential comparison of density profiles, the lensing mass estimate provides only the normalization in the central region, thus justifying the use of this simple lens model. However, in §2.3 we quantify possible effects an over- or under-estimate of the lensing mass will have on the LOSVD and thus on the inferred overall mass distribution in the galaxy group.
For the results given in this subsection, we use deflector and source redshifts of the lensing galaxy group, SL2SJ143000 (), described in Section 3. The comparisons are carried out for five different values of the virial mass, in equal increments, to cover the typical mass scale from galaxy groups to cluster values; it must be pointed out that constraining the projected mass within the Einstein radius makes the virial mass of the system a free parameter. Given this freedom, for each chosen virial mass, the concentration index, , of each profile has to be iteratively adjusted to match the projected mass, , within the Einstein radius, , to the mass value obtained from the lens model.
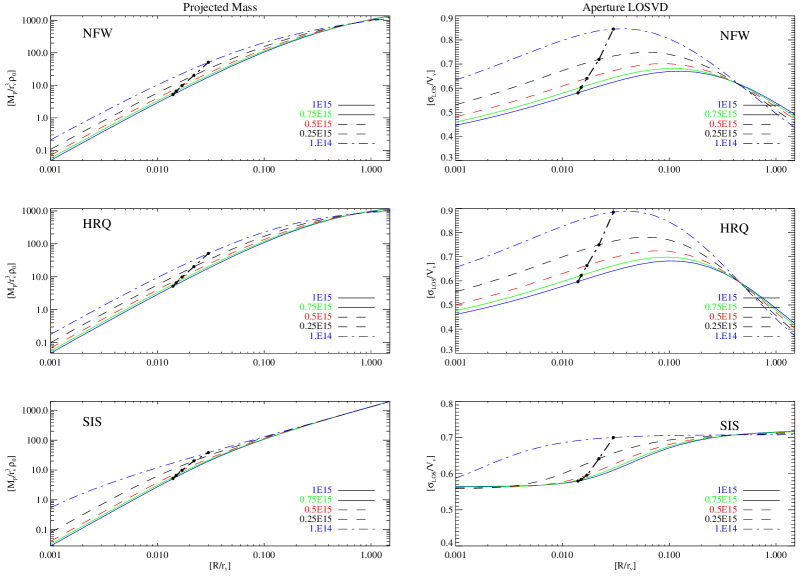
Figure 3 shows the resulting projected mass profiles (left panels) and the LOSVD (right) for the NFW, HRQ and SIS profiles as functions of the scaled aperture radius; the effects of increasing virial mass are shown in the five profiles plotted; Table 1 lists the pertinent numerical values.The projected mass and LOSVD, listed in columns 5 to 10, correspond to a rest frame radius of at which the observed LOSVD was measured for SL2SJ143000 (see Section 3.3).
The effect of decreasing virial mass for a fixed projected mass within the Einstein radius, seen in Figure 3, is to increase the fraction of projected mass within the inner radii, as expected; the underlying density distribution becomes more peaked toward the center. The scaled aperture LOSVD consequently reflects this central concentration of mass and shows a higher relative peak in each profile as well as an overall increase in the scaled LOSVD for decreasing virial mass; however, the increase in the scaled LOSVD is largely offset by the decrease in the circular velocity, (shown in column 3 in Table 1), which is used for scaling; therefore, the observed value of the LOSVD, in units of , is lower for a smaller virial mass.
The peaked trend in the aperture LOSVD for both the NFW and HRQ indicates a significant and measureable difference between the value in the core () and that at a larger radius, ; for example, for the NFW profile, the difference between these two LOSVD values is for a galaxy group scale object. The advantage of using such differential LOSVD measurements (measured within a series of apertures) is that they also provide additional measured constraints on the density profile, and thus mitigate any effect of the underestimate of the lensing mass. Given these benefits, differential LOSVD measurements in several apertures may be used to advantage for groups in which the MOS observations confirm a sufficient number of member galaxies needed for the radial binning.
2.3. Effect on LOSVD of lensing mass estimate
In our determination of the lensing mass using a simple lens model, we have made two assumptions that may lead to a corresponding under- or over-estimate of its value. Here, we discuss these assumptions and test what the corresponding effect of such an error would be on LOSVD from our models, and consequently on the concentration index of the density distribution, and virial mass of the group estimated from our observations. First, in our lens model, we assume the deflector mass to be spherically symmetric and the observed lensed images to fall on the Einstein radius corresponding to the lens and source redshifts. The small image separations in group lensing make it reasonable to assume that the source separation from the optic axis is small and therefore the lensed images trace the corresponding Einstein radii. Regarding spherical symmetry, Cole & Lacey (1996) have shown that, on the scale of clusters, the effects of triaxiality in the mass distribution are small, especially in the core of these structures; we assume this to apply to our groups as well. At the same time however, detailed mass models of simulated clusters by Meneghetti et al. (2007) indicate that the assumption of spherical symmetry leads to an underestimation of 10-35% in the inferred central slopes and consequently in the total projected mass from lensing; they find that active merging and the presence of substructure leads to the higher degree of underestimation. We therefore introduce underestimates up to 50% in the lensing mass and investigate the corresponding effect on the velocity dispersion obtained from our model.
Secondly, in the case of lensing groups, the baryonic contribution from the dominant central galaxies to the gravitating mass within the Einstein radius may be significant. In our analysis, we estimate the stellar mass in the central galaxies using the correlation with their luminosities and optical colors, with functional fits provided by Bell & de Jong (2001) and Bell et al. (2003). Systematic errors in this fit would directly give rise to corresponding differences in our estimate of the dark matter within the lensing aperture and thus on the computed velocity dispersion. In this subsection, we assess the effects and the relative importance of these competing effects of under- or over-estimated dark matter within the Einstein radius, , on the computed LOSVD at larger radii (up to the virial radius), and therefore on the estimated virial masses from our observations.
To test the effects of variations in the amount of dark matter, we have generated a set of LOSVD profiles using mass models in which the ‘true’ projected dark matter mass within ranges from to of the gravitating mass estimated from the lens model; as in the previous section, we use the lensing geometry and parameters of SL2SJ143000, described in §3, for this comparison.
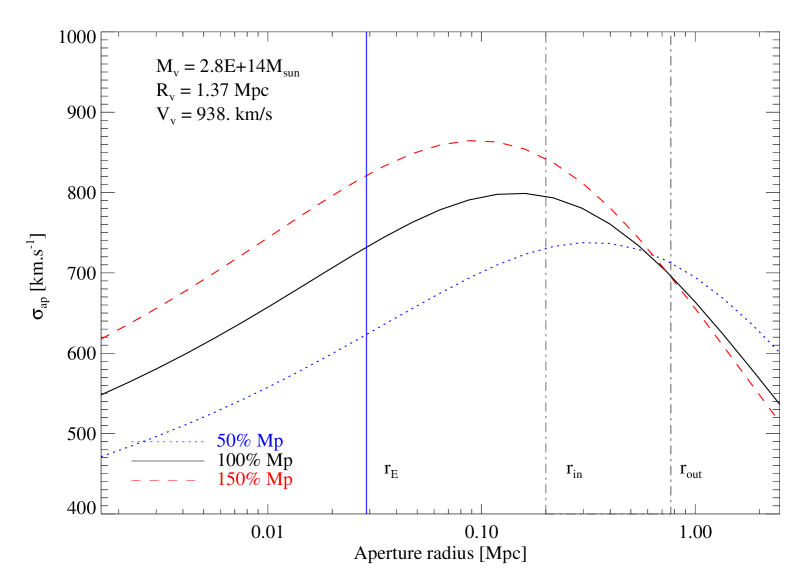
Figure 4 shows the LOSVD profiles corresponding to a under-estimate of the projected dark matter within , as well as a over-estimate, with both these profiles compared with that of a model in which the lensing mass is dark matter only (our reference). Only the LOSVD profiles corresponding to the NFW density distribution are shown since the effects on the other profiles are similar. For all models, the virial mass of the group is kept fixed at , as estimated for this group (see details in §3.5); consequently, the concentration index of the profile is varied to account for the the variations in the projected dark matter mass within the Einstein radius.
Qualitatively, an over-estimate in the projected dark matter mass within leads to a more centrally concentrated, ‘peaked’ profile with a higher concentration index; this peaked density profile translates directly into the LOSVD profile as well, with the maximum velocity being higher () and occuring at a smaller radius (); at the lower end of the scale, the under-estimate has the opposite effect on the LOSVD profile with a lower maximum occuring at a larger radius.
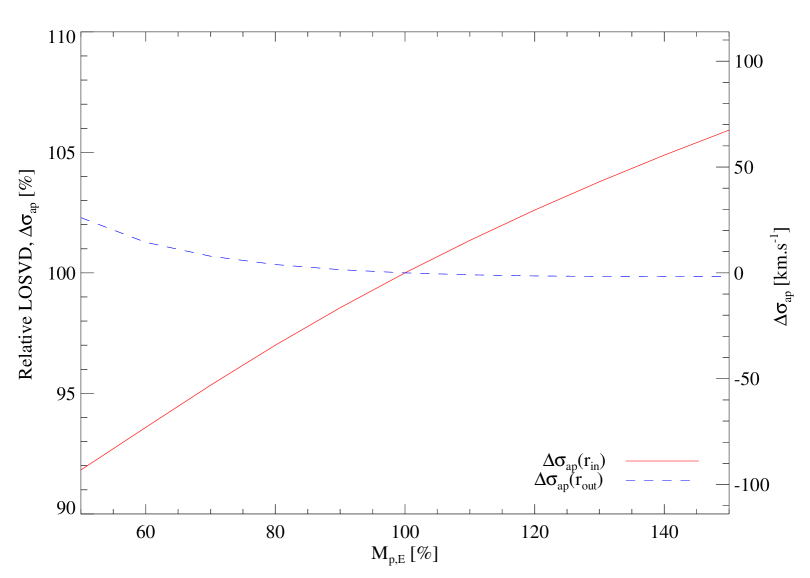
Figure 5 quantifies these variations in the LOSVD due to under- or over-estimates of the dark matter lensing mass; since the quantities of interest are the LOSVD values at the chosen (observed) aperture radii, the plots trace the variations in LOSVD at the two observed apertures in SL2SJ143000, our chosen example. The abscissa shows the percentage variation in the dark matter mass. The ordinate traces the corresponding percentage variations in the LOSVD values, normalized using the value for the dark matter model, our reference; also shown on the right axis is the relative change expressed in units of , which may be conveniently compared against the expected observational uncertainties.
The trends again show that variations in the dark matter within primarily affect the LOSVD toward the core of the group, and have only a minimal effect on the velocity dispersion measured at larger radii. Even in the core, the LOSVD variation is only for a change in the projected dark matter mass, with the corresponding measured velocity variations being , which is of the order of magnitude of the observational errors (see §3.3). Therefore, the assumption of spherical symmetry and any systematic errors in the estimation of the baryonic contribution on the LOSVD are minimal and do not affect the inferences drawn from our differential comparison of density profiles. However, these results provide a measure of the error in our inferences of the absolute values of the underlying mass distribution.
3. Observations
The results reported here are from our Gemini GMOS-MOS observations of two lensing groups, SL2SJ and SL2SJ, drawn from a sample of nine candidates available in our lens catalog prepared from 161 of CFHTLS-Wide555Canada-France-Hawaii Telescope, Legacy Survey, http://www.cfht.hawaii.edu/Science/CFHLS/ imaging. All of the lensing systems were discovered by visual inspection of RGB color images of candidate groups and clusters detected using an automated cluster detection algorithm, K2; Thanjavur et al. (2009) provide a description of the algorithm, completion and contamination statistics of the detector, as well as a description of the resulting catalogs.
From the MOS observations of the group members, we measure the LOSVD as a proxy for the dynamical masses of the groups. The candidate member galaxies for this MOS follow-up are identified using their optical colors and positions relative to the central galaxies. The identification of members is completed by K2 as part of the group and cluster detection process; see Thanjavur et al. (2009) for details. Results from our MOS observations are discussed in this section after a brief summary of the instrument configuration and data reduction.
3.1. Instrument configuration and target selection
The multi-object spectrograph, Gemini GMOS666http://www.gemini.edu/sciops/instruments/gmos/ with a FOV of , permits simultaneous observations of several galaxies ( or more) spanning a sky aperture of a few arc minutes. By choosing target galaxies brighter than mag and using on-chip spatial and spectral binning, with h integration times we achieve adequate S/N per spectral pixel in the region of the strong Balmer break at in these early type galaxies, which we use for redshift measurement. The MOS slitlets and the R400 grating combination provide a redshift sampling, . Each field is observed with two MOS masks in order to increase the number of candidate member galaxies observed, especially in the crowded central regions of these lensing groups; the integration time per mask is 7200s, with observations completed in August 2007 as part of the Gemini program, GN-2007A-Q-92 (PI. K. Thanjavur).
3.2. Data reduction and analysis
In processing the MOS observations using the standard Gemini-IRAF pipeline, we have improved the fringe correction and sky subtraction by incorporating B-spline based scripts, which have been shown to be advantageous (Kelson 2003). The extracted 1-D spectra are co-added to make the final spectrum for each observed object. To determine the redshift, the co-added spectra are continuum subtracted and then cross correlated against template galaxy spectra; for the cross correlation, performed in Fourier space, we use the IRAF777IRAF is distributed by the National Optical Astronomy Observatory, which is operated by the Association of Universities for Research in Astronomy (AURA) under cooperative agreement with the National Science Foundation. task FXcor. For cross correlation, we use representative template spectra for a galactic bulge, Elliptical and S0 galaxies from the Kinney catalog (Kinney et al. 1996, McQuade et al. 1995), with the best fit being determined by the highest R-value (Tonry & Davis 1979) of the correlation.
3.3. Observational results
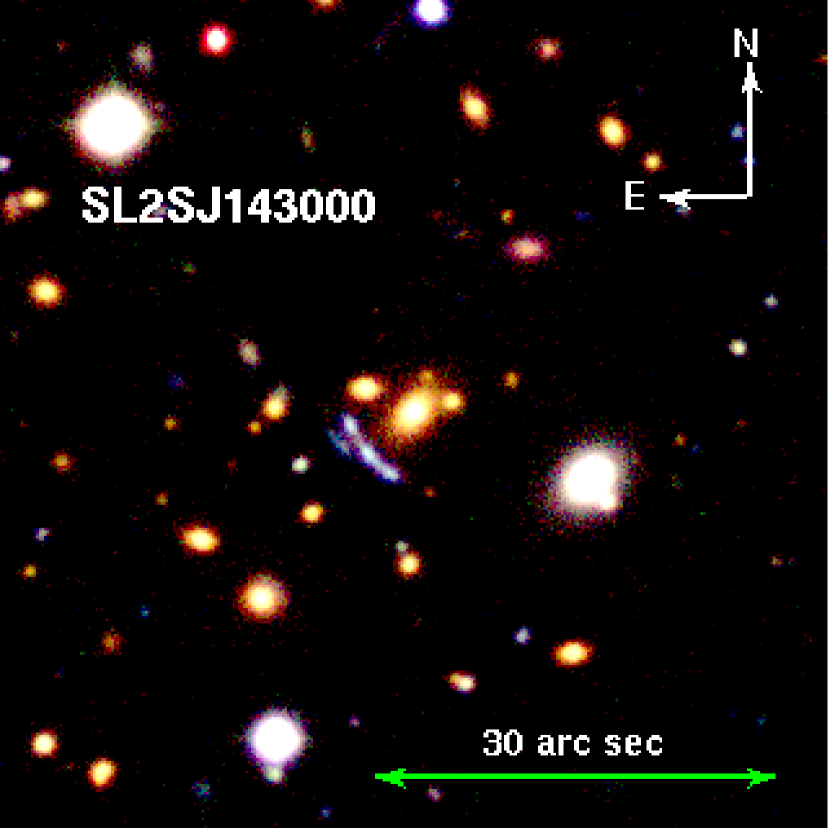
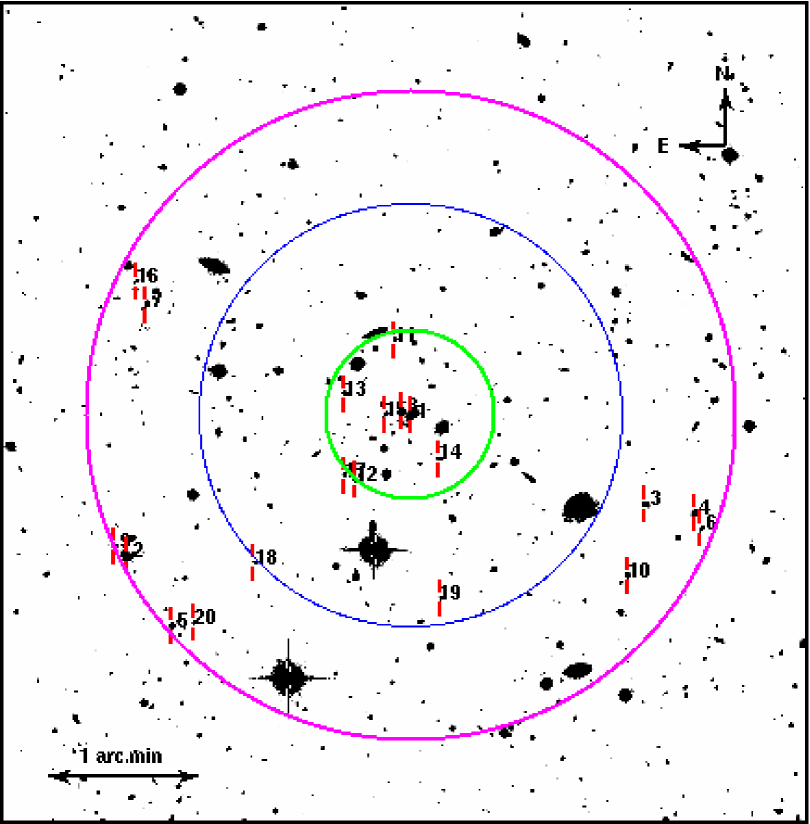
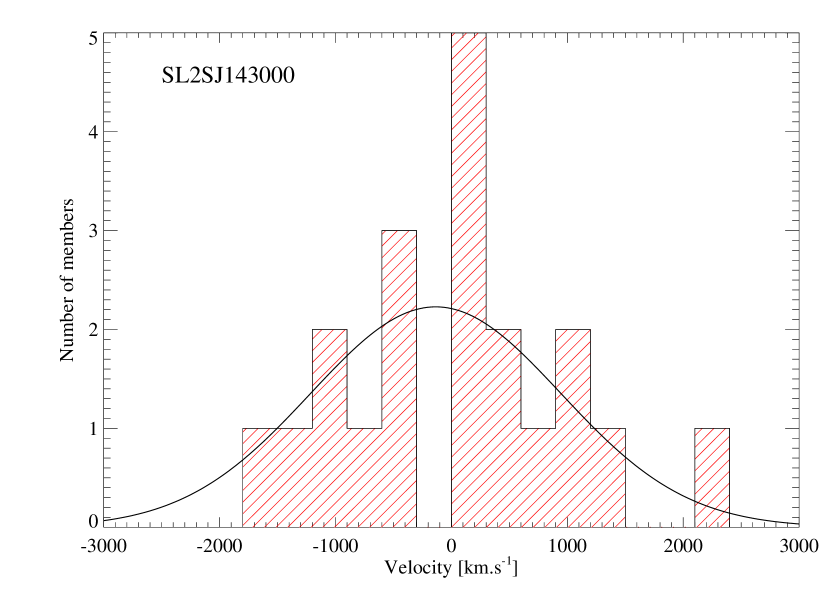
SL2SJ143000+554648 (RA 14:30:00.7, Dec 55:46:47.9): With a classic lensing geometry seen in the RGB color image, Figure 6 (left), a background galaxy at a redshift of is lensed by the mass in the central regions of a galaxy group at a redshift of . The redshift of the source was determined by longslit observations as part of an earlier Gemini program (GN-2007A-Q-114, PI. K. Thanjavur); the redshift of the group was measured from the GMOS observations described here. The color image shows that the light in the core region of this group is dominated by the BCG, which may be assumed to contribute the majority of the mass in the region and therefore is the principal deflector. Of the 39 objects selected for observation using two MOS masks, 38 matched the early type templates during cross correlation and yielded secure redshifts. Of these, 19 galaxies are consistent within of the redshift of the BCG at , and are taken to be members of this group. The bi-weight mean redshift of these member galaxies is taken to be the redshift of the group. The distribution of the galaxies on the sky indicates that 10 members lie within a projected aperture radius corresponding to rest frame 0.5 Mpc, shown by the middle circle in Figure 7; the small and large apertures are used for LOSVD comparisons and are described in Section 3.4. Table 2 lists the spectroscopic redshifts, measured photometry and the sky positions of the member galaxies relative to the BCG. Figure 8 (left panel) shows the velocity distribution of the member galaxies as well as the fit to the LOSVD, both of which are discussed further in Section 3.4.
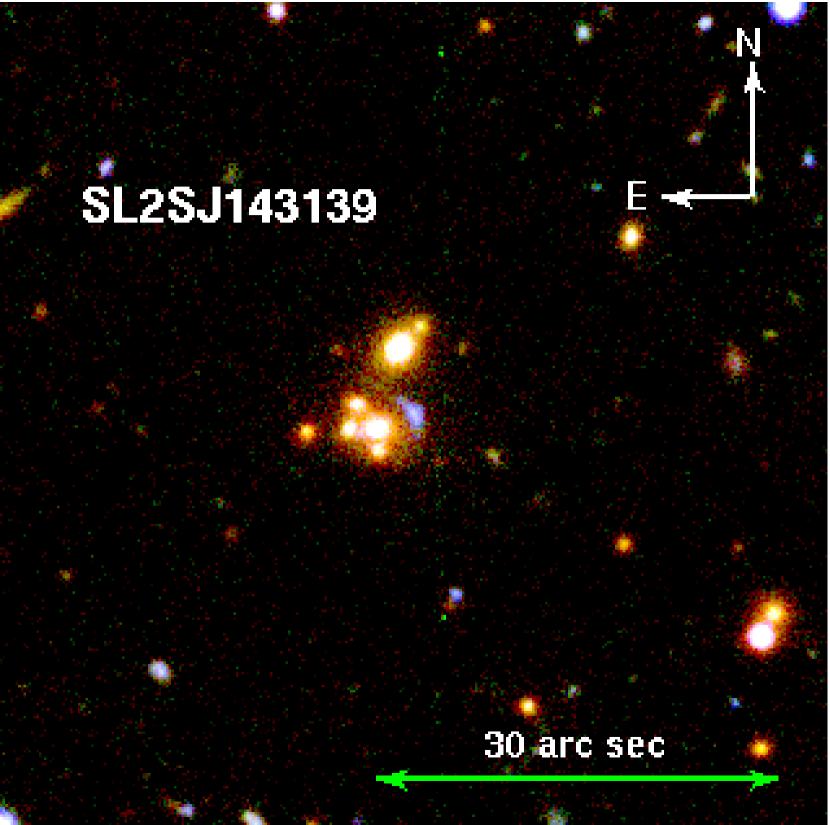
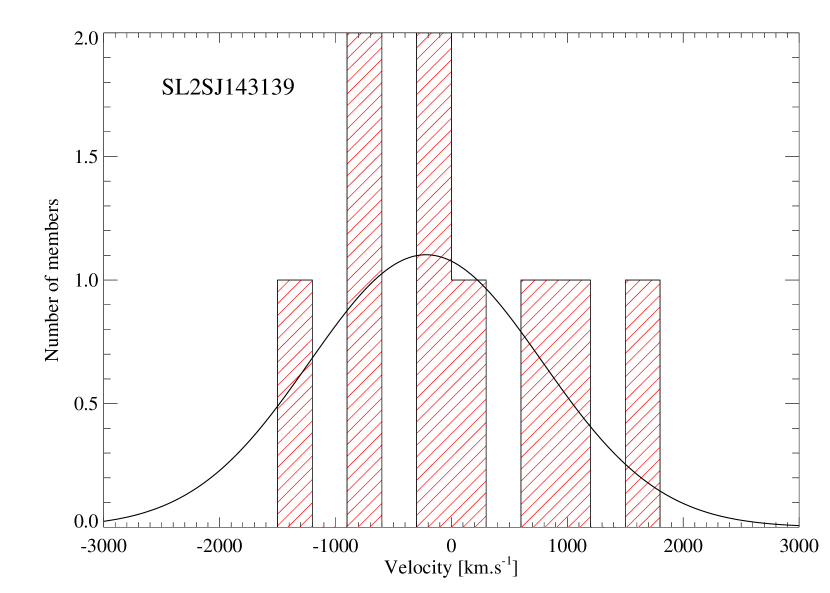
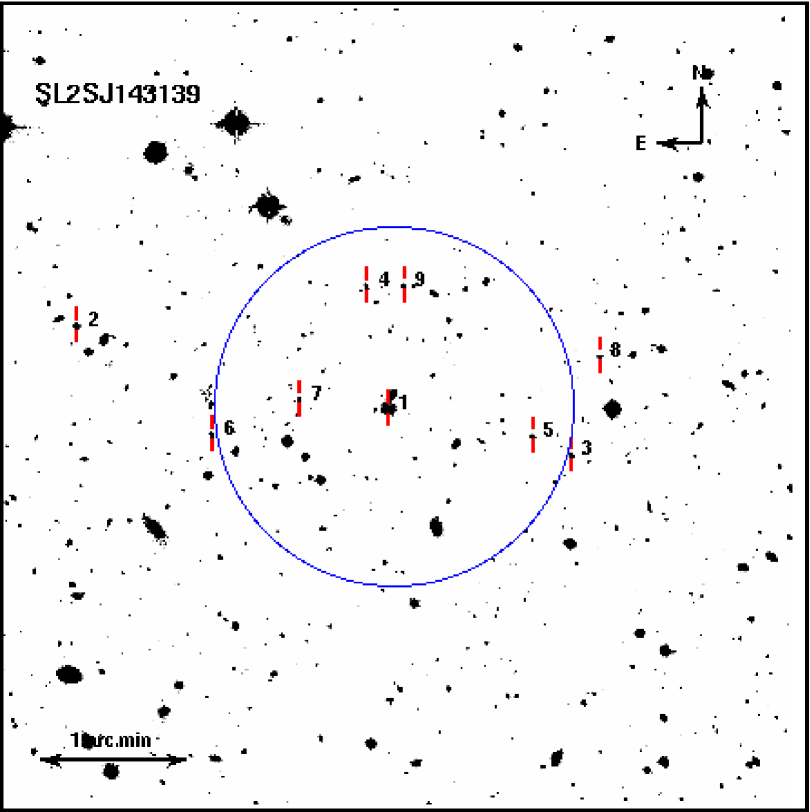
SL2SJ143139+553323 (RA 14:31:39.00, Dec 55:33:23.00): In this interesting lensing group, shown in the RGB color composite in Figure 6 (right), four galaxies with colors consistent with early type galaxies are clustered within a projected aperture of radius in the rest frame of this group at . The blue lensed image, lying to the NE of these central galaxies, appears distorted by the complex mass distribution. The chosen field orientation during observation permitted slitlet placement on 25 objects, which yielded secure redshifts for 22 early type galaxies, of which 9 are consistent with the median redshift of the group. The projected radial distribution, Figure 9 shows that 7 of these members lie within a projected distance of 0.5 Mpc of the center of the group, the barycenter being taken to coincide with the center of the light distribution of the four galaxies in the core. Measured values of spectroscopic redshifts, photometry and sky positions of the member galaxies are listed in Table 2; their velocity distribution and the LOSVD fit are shown in Figure 8 (right).
For the lensed arc, the recent release of Terapix T0006 (Nov 2009) photometric catalogs containing - and -bands magnitudes for this CFHTLS-W field, along with the photometry available earlier, permit us to determine the photometric redshift. The arc is clearly detected in all five filters. Using (Bolzonella et al. 2000) with this 5-filter data, we determine the photometric redshift of the arc as . The probability of the fit is for the best fitting Sbc galaxy template; other late-type galaxy templates yielded similar redshifts. In addition, during our GMOS-MOS observations, we devoted a slitlet to the lensed arc but were unable to determine the redshift due to the lack of any emission line; the absence of an emission line in the wavelength range (up to ) covered during our spectroscopy places the source at a redshift , consistent with the redshift estimate. HST WFPC-2 imaging of SL2SJ143139, observed as part of a Cycle 16 Snapshot program (PI. J-P. Kneib) awarded to our SL2S collaboration, shows the distinctive features of a bone fide lensed arc, thus ruling out the possibility of a foreground edge-on galaxy; based on the available data, modeling of this lens system by our SL2S collaborators is in progress.
3.4. Rest frame LOSVD estimates
For the computation of the LOSVD from the measured redshifts of the member galaxies, we adopt the bi-weight estimator in the public statistical package, ROSTAT (Beers et al. 1990). Using extensive simulations, Beers et al. (1990) have shown that the bi-weight is resistant to errors due to small number statistics (our samples typically contain only 10 to 20 galaxies with secure redshifts), and to be especially immune to outliers; galaxy groups are prone to outliers since individual member galaxies may be in the initial phases of infall or may be undergoing interactions among themselves; see discussions in Gebhardt & Beers (1991) and Beers et al. (1991).
The estimated LOSVD for the two galaxy groups, corrected to their rest frame values, along with their confidence intervals are listed in Table 3. The error in the redshift of each galaxy from the cross correlation is taken into account by ROSTAT during the estimation of the bi-weight. The confidence intervals on the spread, given in the table, are estimated in ROSTAT with a bootstrap technique with 1000 resamplings (see Beers et al. (1990) for details on the methodology).
Figure 8 (left) is a histogram of the measured velocity distribution of the 20 member galaxies of SL2SJ143000 about the mean redshift of the group, ; overplotted is a representative Gaussian distribution generated using the parameters estimated with ROSTAT. The corresponding rest frame LOSVD is within an aperture of radius at the redshift of the group (shown by the large aperture in Figure 7).
Figure 8 (right) shows the velocity distribution of the 9 observed cluster members of SL2SJ143139 about the group redshift, ; the estimated rest frame LOSVD is within an aperture of .
For SL2SJ143000, we measure a LOSVD of for a subset of 6 members within a rest frame aperture of (shown by the small aperture in Figure 7); this is the minimum number of galaxies needed for meaningful LOSVD measurement, according to results from ROSTAT simulations (Beers et al. 1990). This second measurement not only provides an additional constraint for the estimation of the virial mass, but also increases the sensitivity of our method to distinguish between the underlying density distributions. Due to the peaked profile of the aperture LOSVD as a function of aperture radius, seen in Figure 2, we expect observable differences in LOSVD values between the NFW and the Hernquist profiles at smaller radii ().
3.5. Estimation of the viral mass and M/L ratio
Using a maximum likelihood parameter estimator in conjunction with the formalism presented in §2, we determine the virial mass of each group and the corresponding concentration index for each of the NFW, HRQ and SIS density distributions applying constraints from the measured dynamical and lensing masses. With the summed -band luminosity within the virial radius, we then estimate the M/L ratio of these structures.
In our models, the LOSVD estimates determined in §3.4 are direct proxies for the dynamical masses enclosed within the corresponding apertures. For estimating the lensing mass, we use the lens model described in §2.2. The Einstein angle, , needed for the estimate is measured from available CFHTLS -band imaging. The source redshifts are known from the longslit or MOS spectroscopy carried out to confirm these systems are bone fide lenses; the redshift of the group, which is the deflector, is known from the MOS spectroscopy described here. For the lensed source in SL2SJ143139, we have used available 5-filter CFHTLS-W photometry to estimate the photometric redshift with a high degree of confidence; near infrared spectroscopy of this object is planned. In must be emphasized that increasing the redshift to even z=3, alters the computed lensing mass by , while the consequent uncertainty introduced in the virial mass is . Results for this system presented here will therefore see a revision of at most a few percent when we confirm the source redshift with our near-infrared spectroscopy.
From the estimated total lensing mass, we subtract the baryonic contribution of the central galaxies within the Einstein radius to obtain the projected dark matter mass; this is the observable we use in our models to trace the underlying density distribution. In estimating the baryonic mass, we assume it to be composed entirely of the stellar content of the galaxies and neglect any contribution from hot gas. Using the i-band luminosities and (r-i) colors of the central galaxies, taken from photometric catalogs888Available from the Canadian Astronomy Data Centre (CADC) for these CFHTLS-Wide fields, we compute their -band stellar M/L ratios and thus the stellar masses using the correlation proposed by Bell & de Jong (2001),
| (15) |
The correlation coefficients for the SDSS filters are taken from Bell et al. (2003), (Table 7 in their Appendix 2); the solar i-band absolute magnitude, is used to convert the M/L ratio to stellar mass in that filter. Table 4 lists the lensing details of each group, the estimated total lensing mass as well as the baryonic and dark matter contributions, along with the estimated uncertainties in all these estimates. The uncertainty in the total lensing mass is governed by the redshift errors while the error in the baryonic mass estimate depends primarily on the associated photometric errors, obtained from the Terapix catalogs.
The maximum likelihood estimator accepts the LOSVD and the corresponding aperture radii, and the lensing dark matter mass and the measured Einstein radius as constraints in fitting for the virial mass, and the concentration index, , using the Marquardt-Levenberg algorithm (Press et al. 1992). The of the goodness of fit is computed as,
| (16) | |||||
where the subscripts on the projected lensing mass, , and the LOSVD refer to the observed and the modeled values; the uncertainty in each quantity is indicated by with the appropriate subscript. The estimation of the LOSVD within multiple apertures, as in the case of SL2SJ143000, provides additional constraints with consequent improvements in the reduced value of the fit; the summation in Eqn 16 takes this case of multiple apertures, (, i=1..n), into account. For SL2SJ143000, n=2, while for SL2SJ143139, n=1. During the iterations for the virial mass and the concentration index, the corresponding model values of the projected mass and LOSVD are computed using Eqn 12 and Eqn 14 respectively. The estimator is applied for each of the assumed density profiles independently and the corresponding best fit parameter values and the associated uncertainties are listed in Table 5.
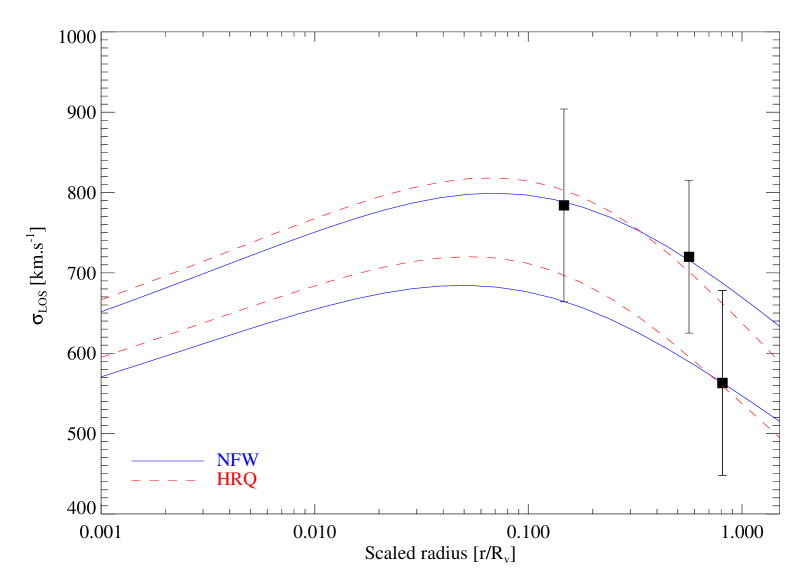
For the NFW and HRQ profiles the parameter estimator converged for acceptable values of the reduced ; for the SIS however, the convergence was very poor with the reduced exceeding ten for both groups. A comparison of the measured LOSVD and lensing mass for each group, used as the input values for parameter estimation, and the corresponding computed values using the best fit virial mass and concentration index for each density profile is shown by the values listed in Table 6. The complementary Figure 10 shows a comparison of the computed LOSVD profiles, using the best fit parameters for the NFW and HRQ density distributions, against the observed values for the two groups; given the poor convergence obtained for the SIS distribution, the corresponding LOSVD is not shown. The plots indicate that the modeled LOSVD estimates for either density distribution are consistent with the observations, well within the associated uncertainties. This compatibility with either density distribution was reported by Rines & Diaferio (2006) for their sample of 72 low redshift clusters. Our ongoing observations of the remaining candidates in our lens catalog will determine if this applies to group scale structures as well.
To compute the -band M/L ratio, we sum up the total -band luminosity of the candidate member galaxies within the virial radius, , corresponding to the estimated virial mass. Member galaxies are identified using a color cut of mag relative to the () and () colors of the central galaxies. Based on the associated photometric errors, only galaxies brighter than are used; this magnitude limit is fainter than a typical galaxy at z=0.5. The width of the color cut is based on the color errors of the spectroscopically identified cluster members; tests carried out on our cluster and group detection algorithm, , (Thanjavur et al. 2009) have shown this multi-color based approach of identifying member galaxies to be effective. Table 7 lists the number of members identified for each group and their total luminosities and stellar masses. Using these values, the total M/L ratio for each group for an underlying NFW and HRQ density distribution and the associated uncertainty are computed and listed in Table 7; given the poor fit for the virial mass obtained for the SIS density distribution, we do not compute the corresponding M/L ratio.
3.6. Comparison with previous estimates
Here we compare our results with those of previous investigations regarding the assembly of mass at the scale of galaxy groups. Pertinently, the joint strong and weak lensing analysis on the SL2S sample by Limousin et al. (2009) included one of our groups, SL2SJ143000, and thus provides an independent verification of our methods and results.
For SL2SJ143000, we measure an Einstein radius of on the -band image, which closely matches the value of which Limousin et al. (2009) derive for this system using their lens model. This close match lends support to our assumption that in these lensing groups with image separations of a few arc seconds, the position of the lensed image coincides closely with that of the Einstein radius corresponding to the deflector and source redshifts, The weak lensing analysis of Limousin et al. (2009) yields an upper bound for the LOSVD of compared to we determine from our MOS spectroscopy, compatible well within the uncertainties of these two estimates. Our estimate of the virial masses corresponding to the NFW and HRQ density profiles are lower than their weak lensing upper bound estimate of . It should be noted that they assume an SIS profile which our models discount. Even with this caveat, our -band M/L ratio estimates for the NFW and HRQ profiles match their value of also in the -band for the sample of 13 groups. We are extending our analysis to other groups in our catalog and will report in a subsequent publication further comparisons between these two approaches.
McKean et al. (2009) combine strong lensing and galaxy kinematics, similar to our approach, for their recent analysis of the gravitational lens, CLASS B2108+213 at . The observed velocity dispersion is for the 51 confirmed galaxy members, though the authors interpret the observed bimodality in the distribution of the velocities as being due to two merging groups. A detailed lens model, based on HST and Keck UBVRI imaging, along with the measured dynamics indicates a density profile which is isothermal within the Einstein radius. Even though the estimated virial mass of the group is not reported, the authors conclude that the observed velocity dispersion, which is higher than the range expected in low redshift groups, indicates that two groups may be in the process of merging to form a poor cluster. The condensation of baryons to the core of the merging structure may be the cause of the higher slope of the density distribution deduced by their lens model.
Using stacked weak lensing analysis of 116 groups from the CNOC2 survey, Parker et al. (2005) report a mean -band M/L of for the complete sample; in addition, they split their sample into ‘poor’ and ‘rich’ categories, and determine M/L for the rich category - a value which indicates that both our lensing groups fall in this class of groups. However, the singular isothermal velocity dispersion, for their ‘rich’ groups is of the values we measure for both groups from our observation. Limousin et al. (2009) point out that the M/L values plateau off for structures with virial masses, while the velocity dispersions continue to increase from for group scale structures to observed in clusters (Bardeau et al. 2007).
Sheldon et al. (2009) present the M/L values of their SDSS DR4-MaxBCG cluster sample binning them by richness, , as well as by their -band optical luminosity, , thus permitting us to compare our M/L results in each category separately. Assuming that the number of member galaxies in each of our groups listed in Table 7 is equal to their tabulated value ( Sheldon et al. (2009), Table 1), the corresponding -band M/L for the MaxBCG sample is higher than the values we obtain from our analysis; eg. the MaxBCG M/L = 319 for a SL2SJ143000-like group with , compared to the M/L value of 265 we estimate for this group. The MaxBCG members are identified using color cuts with reference to the Red Sequence, similar to the method used by our cluster detector, , as described in §3.5. However, the values used for comparison must be corrected for differences in the magnitude limits used for cluster member selection as well as the median redshifts of the two cluster catalogs. Using the MaxBCG selection criteria from Koester et al. (2007), and the limits for cluster members given in §3.5, we compute the correction. For this we use the SDSS -band Schechter parameters at z = 0.1 from Blanton et al. (2003) and compute the number density for each case; we assume that there is negligible evolution in the Schechter parameters up to z=0.5, the nominal redshift of our galaxy groups. Applying this correction reduces the equivalent MaxBCG value for a SL2SJ143000-like group to 12 with a corresponding M/L , thus making our estimates consistent. Similar consistency is also obtained in the corrected M/L values of both samples determined using their values.
These comparisons indicate that the estimated M/L ratios of our candidates are consistent with other published results, and represent rich group scale objects. Their virial masses and observed LOSVD, similar to that of B2108+213, would place them at the high mass end of group scale structures, of which the CNOC2 groups reported by (Parker et al. 2005) are a representative sample. The velocity distributions of the observed member galaxies in our MOS spectroscopy do not show any bimodal signature; our findings have to be modulated by the limited number of confirmed member galaxies, especially in the case of SL2SJ143139, as well as by the errors associated with our redshift measurements using medium resolution spectroscopy. With this caveat, our observations indicate that both our groups are fully virialized, unlike the ongoing merger McKean et al. (2009) propose for B2108+213. This high degree of virialization in our groups lends further support to our finding that the density distribution in both these structures resemble the dark matter dominated NFW or Hernquist profiles; our likelihood estimator rejects at well over the level an isothermal distribution, which McKean et al. (2009) find best fits the mass distribution in B2108+213. Given the active merging associated with the assembly of mass in a group environment, the observed density distribution in these structures may be a sensitive function of the degree of virialization. Results from our observations of the remaining lensing galaxy groups in our catalog will therefore not only add to the sample size but also permit us to test this important hypothesis.
4. Summary
Our overall objective is to understand the assembly of structure at the mass scale of galaxy groups within the CDM cosmology. Taking an observational approach, our immediate goal is to characterize groups using their virial masses and M/L ratios, and compare these values against corresponding properties observed in clusters and field galaxies. In addition, we also test if the underlying density distribution in groups is indeed NFW-like as predicted by CDM, or more isothermal as observed in massive field galaxies.
The approach we have adopted uses joint constraints on the mass derived from strong lensing, and from the dynamics of member galaxies. We obtain these combined constraints by selectively observing galaxy groups with strong lens features discovered in our catalogs of groups and clusters from of CFHTLS-Wide imaging (Thanjavur et al. 2009). The lensing mass is estimated from a lens model using the measured geometry of the lensed images in the available CFHTLS imaging, and from our measurement of the spectroscopic redshifts of the source and deflector. Using the observed colors and luminosities of the central galaxies (enclosed within the arc of the lensed image), we account for their baryonic masses using the correlations provided by Bell & de Jong (2001) with the correlation coefficients taken from Bell et al. (2003). The dynamical mass of each group is estimated from the LOSVD of the member galaxies measured through MOS spectroscopy.
In this paper, we have provided a detailed description of the formalism we have developed to convert these observables into the parameters we use to characterize the mass distribution in galaxy groups, namely, the virial mass, , and the concentration index, , of the underlying density distribution. The formalism is built around three popular, parametric density profiles, namely, the NFW and the Hernquist models used for dark matter dominated systems, and the Softened Isothermal Sphere observed in baryon rich galaxies. As part of this work, we have reformulated their common definitions, which involve various parameters specific to each profile, into a consistent set of non-dimensional expressions in terms of and . This reformulation thus permits us to explore the effects on the observed characteristics of each density distribution due to variations in these two parameters; more importantly, these tests assess how well the observations permit us to distinguish between the density distributions. Our results indicate that estimates of the mass in the core of the galaxy group, () are essential; since strong lensing is sensitive to the mass distribution in this region, this result offers key support to our observational approach of using groups with lensed arcs as ideal probes.
The results presented here are based on our pilot Gemini GMOS-MOS observations of two lensing groups, drawn from a present sample of nine candidates in our CFHTLS-Wide lens catalog. The observed LOSVD of SL2SJ143000+554648 (deflector redshift, z=0.501, source z=1.435) is 720 determined from 20 confirmed members within a rest frame aperture of . The significant number of confirmed members permits us to estimate a LOSVD = 784 within a rest frame aperture of using 6 members; this provides an additional constraint for estimating the virial mass. SL2SJ143139+553323 (deflector z=0.669, source photometric z = 2.083) has an observed LOSVD = 563 measured from 9 confirmed members within a rest frame aperture of .
The lens model of SL2SJ143000 indicates a total gravitating mass within the Einstein radius of , of which is the baryonic contribution from the central galaxies. The corresponding values for SL2SJ143139 are and , both given in units of . Using our formalism, we have assessed that an under- or over-estimate up to 50% in the lensing mass within the Einstein radius has only a marginal influence () on the virial mass determined by our model.
These observed lensing and dynamical mass estimates for each group are converted into corresponding and for each density distribution using a maximum likelihood estimator in conjunction with our models. The estimated virial masses, in units of are for SL2SJ143000, and for SL2SJ143139, for both the NFW and the Hernquist profiles. However, the isothermal sphere was rejected at well over the level by the fitting procedure for both these groups.
The total -band luminosity of the member galaxies summed over an aperture equal to the virial radius, , corresponding to the virial mass is used to estimate the M/L ratios of these groups. Member galaxies were selected using a color selection of mag relative to the color of the central galaxies; only galaxies brighter than mag were included to avoid large uncertainties due to increased photometric redshifts at fainter magnitudes. The -band M/L ratio of both groups is , with only small variations, much less than the associated uncertainties, seen between the NFW and the Hernquist profiles.
The estimated M/L ratios indicate that both these objects are group scale objects though their virial masses and LOSVD put them at the high mass end of structures in this category. Their density distributions are best fit by dark matter dominated NFW or Hernquist profiles similar to the clusters observed by Rines & Diaferio (2006). Their degree of virialization is also indicated by the unimodal, Gaussian distribution of the observed velocities of their member galaxies, unlike the merging group with an isothermal mass profile and bimodal velocity distribution reported by McKean et al. (2009). Results from our ongoing observations of the remaining lensing galaxy groups in our catalog, will not only provide the characteristics of a greater sample of objects in this important transition range, but will also investigate the effect of virialization on the underlying density distribution of galaxy groups.
Facilities: Gemini, Terapix, CADC, CFHT.
References
- Bardeau et al. (2007) S. Bardeau, G. Soucail, J. Kneib, O. Czoske, H. Ebeling, P. Hudelot, I. Smail, & G. P. Smith. 2007, A&A, 470, 449.
- Beers et al. (1990) T. C. Beers, K. Flynn, & K. Gebhardt. 1990, AJ, 100, 849.
- Beers et al. (1991) T. C. Beers, K. Gebhardt, W. Forman, J. P. Huchra, & C. Jones. 1991, AJ, 102, 1581.
- Bell & de Jong (2001) E. F. Bell & R. S. de Jong. 2001, ApJ, 550, 212.
- Bell et al. (2003) E. F. Bell, D. H. McIntosh, N. Katz, & M. D. Weinberg. 2003, ApJS, 149, 289.
- Binney (1980) J. Binney. 1980, MNRAS, 190, 873.
- Binney & Tremaine (1987) J. Binney & S. Tremaine. 1987, Galactic dynamics, (Princeton, NJ, Princeton University Press).
- Blanton et al. (2003) M. R. Blanton, et al. 2003, ApJ, 592, 819.
- Bolzonella et al. (2000) M. Bolzonella, J.-M. Miralles, & R. Pelló. 2000, A&A, 363, 476.
- Broadhurst et al. (2008) T. Broadhurst, K. Umetsu, E. Medezinski, M. Oguri, & Y. Rephaeli. 2008, ApJ, 685, 9.
- Cabanac et al. (2007) R. A. Cabanac, et al. 2007, A&A, 461, 813.
- Cava et al. (2009) A. Cava, et al. 2009, A&A, 495, 707.
- Cole & Lacey (1996) S. Cole & C. Lacey. 1996, MNRAS, 281, 716.
- Comerford & Natarajan (2007) J. M. Comerford & P. Natarajan. 2007, MNRAS, 379, 190.
- Eke et al. (2004) V. R. Eke, et al. 2004, MNRAS, 348, 866.
- Fassnacht et al. (2008) C. D. Fassnacht, D. D. Kocevski, M. W. Auger, L. M. Lubin, J. L. Neureuther, T. E. Jeltema, J. S. Mulchaey, & J. P. McKean. 2008, ApJ, 681, 1017.
- Freeman (2001) K. C. Freeman. 2001, in ASP Conf. Ser. 240, Gas and Galaxy Evolution, ed. J. E. Hibbard, M. Rupen, & J. H. van Gorkom, (San Francisco, CA:ASP), 240.
- Gavazzi et al. (2008) R. Gavazzi, T. Treu, L. V. E. Koopmans, A. S. Bolton, L. A. Moustakas, S. Burles, & P. J. Marshall. 2008, ApJ, 677, 1046.
- Gebhardt & Beers (1991) K. Gebhardt & T. C. Beers. 1991, ApJ, 383, 72.
- Hartley et al. (2008) W. G. Hartley, L. Gazzola, F. R. Pearce, S. T. Kay, & P. A. Thomas. 2008, MNRAS, 386, 2015.
- Helsdon & Ponman (2000) S. F. Helsdon & T. J. Ponman. 2000, MNRAS, 315, 356.
- Hernquist (1990) L. Hernquist. 1990, ApJ, 356, 359.
- Hoekstra et al. (2001) H. Hoekstra, et al. 2001, ApJ, 548, 5.
- Kelson (2003) D. D. Kelson. 2003, PASP, 115, 688.
- Kinney et al. (1996) A. L. Kinney, D. Calzetti, R. C. Bohlin, K. McQuade, T. Storchi-Bergmann, & H. R. Schmitt. 1996, ApJ, 467, 38.
- Koester et al. (2007) B. P. Koester, et al. 2007,ApJ, 660, 239.
- Koopmans et al. (2006) L. V. E. Koopmans, T. Treu, A. S. Bolton, S. Burles, & L. A. Moustakas. 2006, ApJ, 649, 599.
- Kravtsov et al. (1998) A. V. Kravtsov, A. A. Klypin, J. S. Bullock, & J. R. Primack. 1998, ApJ, 502, 48.
- Kubo et al. (2009) J. M. Kubo, S. S. Allam, J. Annis, E. J. Buckley-Geer, H. T. Diehl, D. Kubik, H. Lin, & D. Tucker. 2009, ApJ, 696, 61.
- Limousin et al. (2009) M. Limousin, et al. 2009, A&A, 502, 445.
- Łokas & Mamon (2001) E. L. Łokas & G. A. Mamon. 2001, MNRAS, 321, 155.
- Lopes et al. (2009) P. A. A. Lopes, R. R. de Carvalho, J. L. Kohl-Moreira, & C. Jones. 2009, MNRAS, 392, 135.
- Marinoni & Hudson (2002) C. Marinoni & M. J. Hudson. 2002, ApJ, 569, 101.
- Markevitch (1998) M. Markevitch. 1998, ApJ, 504, 27.
- McKean et al. (2009) J. P. McKean, et al. 2009, ArXiv 0910.1133.
- McQuade et al. (1995) K. McQuade, D. Calzetti, & A. L. Kinney. 1995, ApJS, 97, 331.
- Meneghetti et al. (2007) M. Meneghetti, M. Bartelmann, A. Jenkins, & C. Frenk. 2007, MNRAS, 381, 171.
- Mulchaey (2004) J. S. Mulchaey. 2004, in Clusters of Galaxies: Probes of Cosmological Structure and Galaxy Evolution, ed. J. S. Mulchaey, A. Dressler, & A. Oemler, (Cambridge Univ. Press).
- Navarro et al. (1997) J. F. Navarro, C. S. Frenk, & S. D. M. White. 1997, ApJ, 490, 493.
- Osmond & Ponman (2004) J. P. F. Osmond & T. J. Ponman. 2004, MNRAS, 350, 1511.
- Parker et al. (2005) L. C. Parker, M. J. Hudson, R. G. Carlberg, & H. Hoekstra. 2005, ApJ, 634, 806.
- Piessens et al. (1983) R. Piessens, E. de Doncker-Kapenga, & C. W. Ueberhuber. 1983, Quadpack. A subroutine package for automatic integration, (Springer Series in Computational Mathematics, Berlin: Springer).
- Press et al. (1992) W. H. Press, S. A. Teukolsky, W. T. Vetterling, & B. P. Flannery. 1992, Numerical recipes in C. The art of scientific computing, (Cambridge: University Press).
- Rasmussen et al. (2006) J. Rasmussen, T. J. Ponman, J. S. Mulchaey, T. A. Miles, & S. Raychaudhury. 2006,MNRAS, 373, 653.
- Rines & Diaferio (2006) K. Rines & A. Diaferio. 2006, AJ, 132, 1275.
- Schneider et al. (1992) P. Schneider, J. Ehlers, and E. E. Falco. Gravitational Lenses. Springer-Verlag New York.
- Sheldon et al. (2009) E. S. Sheldon, D. E. Johnston, M. Masjedi, T. A. McKay, M. R. Blanton, R. Scranton, R. H. Wechsler, B. P. Koester, S. M. Hansen, J. A. Frieman, and J. Annis. 2009, ApJ, 703, 2232.
- Smith et al. (2005) G. P. Smith, J.-P. Kneib, I. Smail, P. Mazzotta, H. Ebeling, & O. Czoske. 2005, MNRAS, 359, 417
- Tago et al. (2006) E. Tago, et al. 2006, AN, 327, 365.
- Tago et al. (2008) E. Tago, J. Einasto, E. Saar, E. Tempel, M. Einasto, J. Vennik, & V. Müller. 2008, A&A, 479, 927.
- Thanjavur et al. (2009) K. Thanjavur, J. Willis, & D. Crampton. 2009, ApJ, 706, 571.
- Tonry & Davis (1979) J. Tonry & M. Davis. 1979, AJ, 84, 1511.
- Treu & Koopmans (2004) T. Treu & L. V. E. Koopmans. 2004, ApJ, 611, 739.
- Tu et al. (2008) H. Tu, M. Limousin, B. Fort, C. G. Shu, J. F. Sygnet, E. Jullo, J. P. Kneib, & J. Richard. 2008, MNRAS, 386, 1169.
- Willick & Padmanabhan (2000) J. A. Willick & N. Padmanabhan. 2000, ArXiv:astro-ph/0012253.
- Willis et al. (2005) J. P. Willis, et al. 2005, MNRAS, 363, 675.
| ] | |||||||||
|---|---|---|---|---|---|---|---|---|---|
| [] | [] | [] | [-] | NFW | HRQ | SIS | NFW | HRQ | SIS |
| 10. | 2.09 | 1434. | 0.014 | 5.67 | 5.84 | 5.65 | 907. | 889. | 1011. |
| 7.5 | 1.90 | 1303. | 0.015 | 4.76 | 4.90 | 4.71 | 815. | 794. | 921. |
| 5.0 | 1.66 | 1138. | 0.017 | 3.64 | 3.74 | 3.63 | 696. | 673. | 806. |
| 2.5 | 1.32 | 904. | 0.022 | 2.21 | 2.23 | 2.31 | 526. | 498. | 640. |
| 1.0 | 0.97 | 666. | 0.030 | 1.04 | 1.01 | 1.25 | 353. | 324. | 472. |
Modeled values of projected mass and aperture LOSVD as functions of virial mass, , for the NFW, HRQ and SIS density distributions (column 1). The corresponding halo properties tabulated are virial radius, , circular velocity, , scaled Einstein radius, , the projected mass, and observed LOSVD, , for NFW, HRQ and SIS respectively; the listed projected mass and LOSVD are interpolated values corresponding to the Einstein radius (=29Kpc) and observed aperture radius (=0.77 Mpc) of the galaxy group SL2SJ143000 (see Section 2.2 for details)
| ID | RA | Dec | i | (g-r) | (r-i) | z | RA offset | Dec offset | |
| - | deg. | deg. | mag | mag | mag | - | arc sec | arc sec | |
| SL2SJ143000 | |||||||||
| BCG | 217.502833 | 55.779878 | 19.049 | 1.638 | 0.880 | 0.4972 | 112.4 | 0.0 | 0.0 |
| #1 | 217.559250 | 55.764219 | 19.43 | 1.43 | 0.70 | 0.5038 | 72.8 | 203.1 | -56.4 |
| #2 | 217.456500 | 55.769869 | 20.09 | 1.55 | 0.81 | 0.4959 | 131.0 | -166.8 | -36.0 |
| #3 | 217.446750 | 55.768939 | 20.10 | 1.65 | 0.92 | 0.4992 | 140.3 | -201.9 | -39.4 |
| #4 | 217.550250 | 55.756489 | 20.32 | 1.71 | 0.87 | 0.5052 | 99.2 | 170.7 | -84.2 |
| #5 | 217.445417 | 55.767169 | 20.36 | 1.59 | 0.79 | 0.4988 | 128.6 | -206.7 | -45.8 |
| #6 | 217.504583 | 55.780339 | 20.48 | 1.64 | 0.89 | 0.5009 | 170.3 | 6.3 | 1.7 |
| #7 | 217.555208 | 55.792289 | 20.69 | 1.58 | 0.84 | 0.5024 | 109.4 | 188.6 | 44.7 |
| #8 | 217.497292 | 55.775089 | 20.77 | 1.74 | 0.90 | 0.5019 | 82.4 | -20.0 | -17.2 |
| #9 | 217.506000 | 55.788300 | 20.80 | 1.61 | 0.84 | 0.4969 | 126.8 | 11.4 | 30.3 |
| #10 | 217.561667 | 55.765411 | 20.80 | 1.42 | 0.65 | 0.5081 | 117.8 | 211.8 | -52.1 |
| #11 | 217.515917 | 55.782339 | 20.80 | 1.69 | 0.87 | 0.4952 | 120.5 | 47.1 | 8.9 |
| #12 | 217.459958 | 55.761981 | 20.81 | 1.44 | 0.69 | 0.4987 | 120.5 | -154.4 | -64.4 |
| #13 | 217.513917 | 55.772692 | 21.04 | 1.66 | 0.90 | 0.5018 | 128.3 | 39.9 | -25.9 |
| #14 | 217.516000 | 55.773239 | 21.17 | 1.42 | 0.67 | 0.5018 | 115.1 | 47.4 | -23.9 |
| #15 | 217.507792 | 55.780000 | 21.20 | 1.42 | 0.70 | 0.5041 | 79.4 | 17.8 | 0.4 |
| #16 | 217.557292 | 55.794850 | 21.23 | 1.54 | 0.68 | 0.5017 | 140.0 | 196.0 | 53.9 |
| #17 | 217.533917 | 55.763511 | 21.25 | 1.47 | 0.72 | 0.4990 | 174.5 | 111.9 | -58.9 |
| #18 | 217.545917 | 55.756819 | 21.31 | 1.44 | 0.69 | 0.5047 | 114.5 | 155.1 | -83.0 |
| #19 | 217.497167 | 55.759511 | 21.34 | 1.41 | 0.65 | 0.5017 | 142.1 | -20.4 | -73.3 |
| SL2SJ143139 | |||||||||
| BCG | 217.915500 | 55.556389 | 18.917 | 1.512 | 0.960 | 0.6671 | 84.2 | 0.0 | 0.0 |
| #1 | 217.878583 | 55.551211 | 20.48 | 1.48 | 1.01 | 0.6690 | 203.3 | -132.9 | -18.6 |
| #2 | 217.978333 | 55.565781 | 20.55 | 1.28 | 0.77 | 0.6722 | 95.6 | 226.2 | 33.8 |
| #3 | 217.920000 | 55.570400 | 20.70 | 1.55 | 0.98 | 0.6747 | 150.5 | 16.2 | 50.4 |
| #4 | 217.872750 | 55.562561 | 21.06 | 1.49 | 1.14 | 0.6694 | 70.2 | -153.9 | 22.2 |
| #5 | 217.886250 | 55.553411 | 21.07 | 1.43 | 0.93 | 0.6667 | 152.6 | -105.3 | -10.7 |
| #6 | 217.933333 | 55.557511 | 21.07 | 1.37 | 1.15 | 0.6667 | 164.0 | 64.2 | 4.0 |
| #7 | 217.950917 | 55.553389 | 21.14 | 1.41 | 0.88 | 0.6702 | 92.3 | 127.5 | -10.8 |
| #8 | 217.912333 | 55.570531 | 21.32 | 1.71 | 1.10 | 0.6731 | 149.9 | -11.4 | 50.9 |
Details of the spectroscopically confirmed cluster members of lensing group SL2SJ143000 and SL2SJ143139. The columns tabulated are member ID, sky position (J2000 ), i magnitude, (g-r) and (r-i) colors, spectroscopic redshift, redshift error, positional offsets in RA and Dec measured relative to the position of the BCG; the numbers annotated on the corresponding panels in Figure 7 follow the order in this table, beginning with 1 for the BCG.
| SL2S | Bi-weight | BCG | Rest frame LOSVD [] | Aperture radius [] | ||
| ID | mean z | z | Inner | Outer | Inner | Outer |
| SL2SJ143000 | 0.2 | 0.77 \bigstrut | ||||
| SL2SJ143139 | - | - | 0.912 \bigstrut | |||
Median redshift and LOSVD of confirmed members of the two lensing groups observed by our Gemini GMOS-MOS campaign; the statistical values tabulated are the bi-weight central location and spread computed by ROSTAT using the spectroscopic redshifts and errors. The reported confidence intervals on the group redshift and the rest frame LOSVD are bootstrap values from ROSTAT, converted to rest frame values using the redshift of the group
| SL2S ID | ||||||
|---|---|---|---|---|---|---|
| SL2SJ143000 | \bigstrut | |||||
| SL2SJ143139 | \bigstrut |
Estimated lensing masses, [] and associated uncertainties in the two groups from our lens model, using the measured Einstein radius, , and the redshifts of the deflector, and source, . The baryonic contribution, from Eqn 15 and the net dark matter lensing mass, and corresponding uncertainties, in units of are listed in the last two columns.
For the lensing group, SL2SJ143139+553323, the photometric redshift and uncertainty are shown italicized.
| SL2S ID | Virial mass, [] | Concentration Index, [ - ] | ||||
|---|---|---|---|---|---|---|
| NFW | HRQ | SIS | NFW | HRQ | SIS | |
| SLS2J143000 | \bigstrut | |||||
| SLS2J143139 | \bigstrut | |||||
Maximum likelihood estimates and corresponding uncertainties of the virial mass of each observed galaxy group and the concentration index for each of the assumed underlying density distributions
| SL2S ID | Estimated | Estimated LOSVD | ||||||
| Obs. | NFW | HRQ | SIS | Obs. | NFW | HRQ | SIS | |
| SLS2J143000 | 5.616 | 5.615 | 5.609 | 0.627 | 784. | 788.51 | 803.34 | 831.77 \bigstrut[t] |
| 720. | 715.81 | 702.14 | 875.29 \bigstrut[b] | |||||
| SL2SJ143139 | 6.031 | 6.031 | 6.031 | 2.22 | 563. | 563.1 | 564.3 | 694.3 \bigstrut |
Comparison of the observed values of the lensing masses, and the LOSVD of the two groups, and the estimates from our model corresponding to the best fit parameter values for the three density profiles, given in Table 5. The projected masses are in units of , and the LOSVD are given in .
| SL2S ID | N | \bigstrut[t] | |||
| [] | [] | \bigstrut[b] | |||
| SL2SJ143000 | 37 | \bigstrut | |||
| SL2SJ143139 | 15 | \bigstrut |
For each lensing group, the columns listed are the number of member galaxies, N, the total luminosity, L, and baryonic mass, M, of the members and the M/L ratio of the group for the NFW and the HRQ density distribution along with corresponding uncertainties