Temperature-Dependent Anomalies in the Structure of the (001) Surface of
Abstract
Surface corrugation functions, derived from elastic helium atom scattering (HAS) diffraction patterns at different temperatures, reveal that the Cu2+ rows in the (001) surface of undergo an outward displacement of about 0.15 Å as the surface was cooled down to 140 K. This is probably the first time that isolated one-dimensional magnetic ion arrays were realized, which qualifies the surface as a candidate to study one-dimensional magnetism. The rising Cu2+ rows induce a surface incommensurate structural transition along the -direction. Surface equilibrium analysis showed that the surface Cu2+ ions at bulk-like positions experience a net outward force along the surface normal which is relieved by the displacement. Temperature-dependent changes of the surface phonon dispersions obtained with the aid of inelastic HAS measurements combined with surface lattice dynamical calculations are also reported.
pacs:
68.35.B-, 68.35.Ja, 68.35.Rh, 68.49.BcOver the past decade has attracted considerable attention because it incorporates double-chain ladders of Cu2+O, which makes it a prototypical quasi-one-dimensional quantum spin-1/2 magnetic system with competing magnetic interactions Zvyagin ; Choi ; Masuda1 ; Gippius . It still remains an exciting system since the recent discovery of ferroelectricity induced by an ordered helimagnetic phase, making the second cuprate to join the list of multiferroics Park ; Xiang ; Seki ; Huang ; Naito being the first.
It was reported that exhibits a spin-singlet (or a gapped spin-liquid) ground state for temperatures K Zvyagin . Two successive magnetic phase transitions bring the system into an incommensurate long-range ordered state with a helicoidal spin structure in which the arms of the double-chain are antiferromagnetically ordered Masuda1 ; Huang ; Seki ; Rusydi ; Yasui ; Kobayashi . The picture that emerges reveals the presence of a collinear sinusoidal spin-ordered phase, with spin polarization along the -axis, below the transition temperature K. An initial modulation wave vector r.l.u. was reported, and was found to increase with decreasing temperature. At the second transition temperature K, the spin polarization acquires small components along the and axes, giving rise to the helicoidal spin-ordered structure. This structure is characterized by an ellipse with the helical axis tilted by from the -axis within the plane, and with the incommensurate modulation still along the -axis Rusydi ; Kobayashi . continues to increase and seems to saturate at K with . The onset of the helicoidal phase induces ferroelectricity with polarization along the -axis. Moreover, recent studies by resonant soft x-ray magnetic scattering Huang have demonstrated that the long-range ordered magnetic states are actually 2D-like ground states, where the 2D character was attributed to a small but effective spin coupling along the -axis, which, in turn, suppresses quantum fluctuations. These measurements also revealed the presence of short-range spin correlations above , which eventually disappear at about K leaving a spin liquid ground state at higher temperatures Huang .
The onset of ferroelectricity below in was first reported by Park et al. Park . Several models were proposed to explain the origin of electrical polarization in helicoidal magnetic systems. Two microscopic models were introduced to explain the mechanism responsible for multiferroicity in such systems, the first is based on the relation between the magnetoelectric effect and microscopic spin currents Katsura and the second invoked the idea of inverse Dzyaloshinskii-Moriya Sergienko . In the former, the polarization is given by
where and are the local spins at site and site respectively, and is the unit vector connecting the and sites Katsura . Subsequently, a phenomenological model based on electric polarization related symmetry-invariant Landau-Ginzburg terms of the form
was proposed Mostovoy . In the case of all these models consistently support a spiral spin with components in the -plane, which agrees with the findings of Ref. Seki ; Rusydi ; Huang ; Yasui ; Kobayashi .
Despite the extensive studies of bulk structural and magnetic properties of crystals cited above, to our knowledge, the only investigation of its surface properties was reported by the current authors Yao , and involved helium atom scattering (HAS) studies of the structure and dynamics of the (001) surface of at room temperature. In that work, it was shown that the surface termination is exclusively a plane. In this letter we report a surprising discovery of temperature-dependent anomalies observed on this surface. For temperatures below 200 K, the rows were found to rise above the surface plane; this, in turn, induces an incommensurate surface structure. As far as we know, this is probably the first time that an isolated one-dimensional row of magnetic ions was realized.
has a layered charge-ordered orthorhombic crystal structure belonging to the Pnma space group. The primitive cell has lattice constants =5.73, =2.86, and =12.47 . Single crystals of with Li content of , which can be considered as stoichiometric , were grown by the floating-zone process Hsu . The experimental setup and procedures of the HAS measurements are described in details in Ref. Yao ; Farzaneh .
In this work, we present surface diffraction patterns of the termination, obtained by the elastic HAS at temperatures below 210 K. Analysis of diffraction intensities yielded surface corrugations, which can be considered as direct pictures of the geometrical arrangement of the surface atoms Rieder . As we previously reported Yao , diffraction patterns recorded between room temperature and roughly 230 K showed none of the anomalies discussed below.
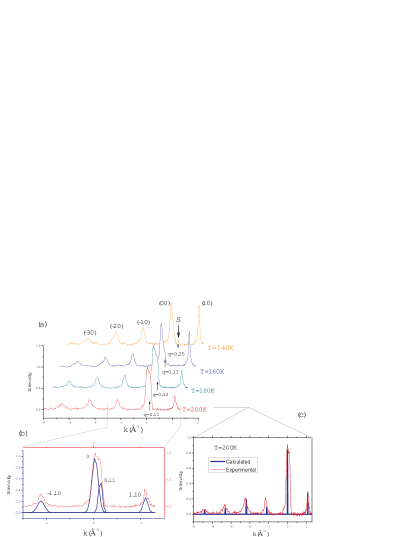
samples were cleaved in situ, under ultra-high-vacuum conditions at K. Subsequently, the samples were cooled down in steps to K. Fig. 1(a) shows four diffraction patterns along the -direction (-direction) recorded at 200, 180, 160 and 140 K, respectively. It is clear that the intensity of the (10) first-order peak increases with decreasing temperature. Moreover, a shoulder is observed on the right side of the (00) specular peak at 200 K and progressively separates from it with decreasing temperature. A Gaussian fit to the 200 K diffraction peaks (DPs), Fig. 1(b), shows that the shoulder is actually a satellite peak at . Similar fits to the DPs at lower temperatures show that increases monotonically with decreasing temperature to at 140 K. Henceforth, we denote this satellite peak by . Further cooling to temperatures below 140 K showed no change in the diffraction pattern.
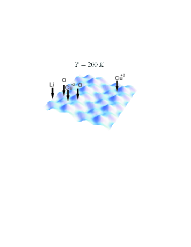
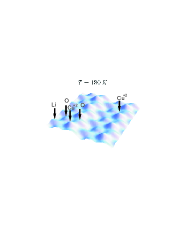
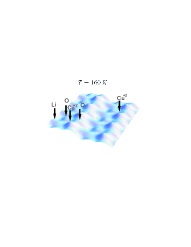
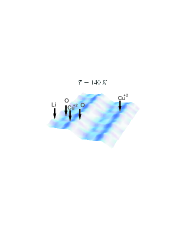
We used the hard corrugated wall model within the eikonal approximation to calculate the elastic scattering intensities and followed an iterative computational method to fit the calculated intensities to experimental measurements. Details of this iterative computational method can be found in Ref. Yao and references therein. Fig. 1(c) shows a very good match between the experimental diffraction pattern at 200 K (red curve) and the calculated intensities of the DPs (blue rods). An important product of this best fit is the topology of the primitive cell manifest in the two-dimensional surface corrugation function (SCF). The SCFs at , , and K are shown in Fig. 2, where the surface ion positions are indicated by arrows. It is clear from the SCFs that the Cu2+ ions rise monotonically with decreasing temperature. By calculating the difference between the maxima and minima of the SCFs, the largest displacement of the Cu2+ ions is estimated to be 0.14-0.15 Å above their bulk-like surface positions.
The presence of the satellite peak, S, is a manifestation of a surface incommensurate structure (SIS) along the -direction. There can be two possible causes for the onset of the SIS: First, the appearance of surface electric dipoles associated with the elevation of the Cu2+ rows renders the surface unstable. Second, the tendency to maintain CuO2- bond length close to its original value induces a lateral displacement of neighboring rows of O2- ions toward the Cu2+ rows along the -direction.
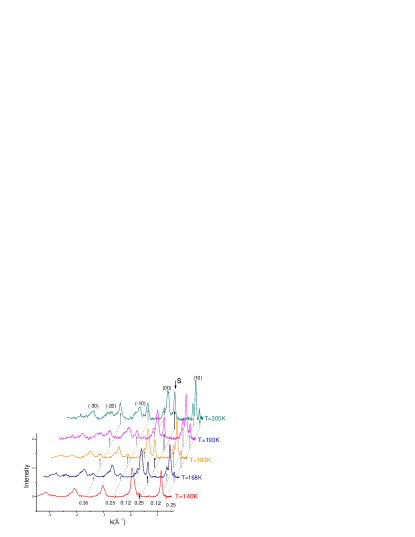
Fig. 3 shows five diffraction patterns along the -direction sampled as the temperature was raised after cooling to 140 K. A sequence of satellite peaks emerges, signaling the development of the SIS phases. The locations of these satellites are marked by arrows. The corresponding wave vectors, determined by Gaussian fits, are recorded next to each arrow. It should be noticed that the satellite intensities increase with increase in temperature, but their wave vectors remain constant. The emerging SIS is characterized by satellite wave vectors: , and . An incommensurability close to was obtained by comparison with the commensurate first order wave vector of , in Fig. 1(b). All features associated with the incommensurate phase and the rise of the Cu2+ rows in the diffraction pattern completely disappear above 220 K.
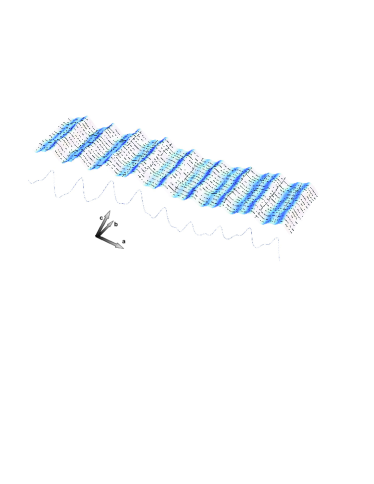
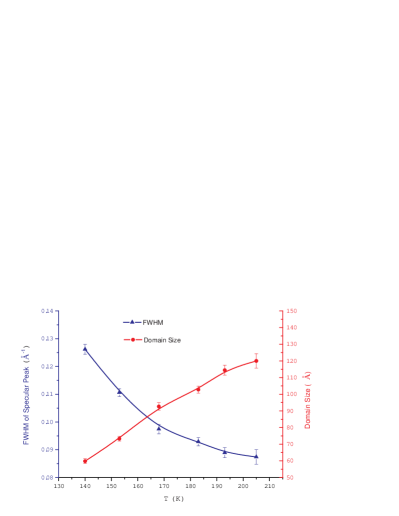
Employing the approximate periodicity of , we carried out a peak intensity fitting procedure similar to that described above. The resulting SCF is shown in Fig. 4. Moreover, we extracted the full-width-half-maximum (FWHM) of the specular peak from the diffraction patterns of Fig. 3; they are plotted in Fig. 5, together with the corresponding average domain size, as a function of temperature. The latter was obtained by deconvoluting the specular peak with an instrument transfer width Park2 of Å-1. It is clear from Fig. 3 and 5 that the incommensurate domains grow with rise in temperature.

In Fig. 6 we plot the intensity of the -satellite peak at different temperatures, recorded during the cooling and heating segments of the experimental measurements. It is clear from Fig. 6 that the temperature dependence of the -peak intensity displays a hysteresis loop with respect to the two segments of cooling and heating. The overall behavior points to a first-order commensurate-incommensurate phase transition.
In order to understand the experimental observations outlined above, we investigated the origin of the anomalous outward displacement of the Cu2+ rows with the aid of detailed surface equilibrium analysis Boyer . This study showed that at bulk-like positions the surface Cu2+ ions experience a net outward force; and that this force can be relieved by displacing the Cu2+ rows outward from their bulk positions, along the surface normal Yao .
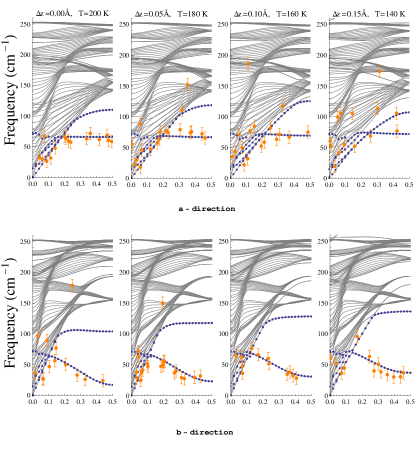
Finally, we studied the changes in the surface phonon dispersion as a function of decreasing temperature. In these studies we employed inelastic HAS, together with lattice dynamical calculations based on a slab model with variable surface Cu2+ positions. The procedural details of these studies can be found in Ref. Yao ; Farzaneh . Fig. 7 shows the results along high-symmetry directions - the experimental inelastic events are indicated by orange dots with error bars. The measurements were carried out at , , and K, and the surface phonon dispersion curves were calculated at different surface Cu2+ displacements from bulk-like positions, indicated by , which were obtained from corresponding SCFs. As was reported in Ref. Yao , the lowest two surface phonon dispersion branches (blue dots in Fig. 7) involve the motion of Cu2+ and Li1+ ions normal to the surface. We notice the following trends with decrease in temperature: the lower branch along the -direction displays a gradual increase in frequency close to the surface Brillouin zone (SBZ) boundary, while the slope of the upper branch and its SBZ frequency gradually decrease along the -direction.
In summary, we presented experimental evidence that the Cu2+
rows in the (001) surface of undergo an outward
displacement of about 0.15 Å as the surface is cooled down to
140 K; and that this displacement induces an incommensurate
structure along the -direction. The growth of the incommensurate
domains was found to be thermally activated. The rise of the
Cu2+ rows was supported by surface equilibrium analysis, which
showed that the bulk-like positions experienced outward forces that
were relieved by the displacement. Low-lying surface phonon
branches, associated with the motion of Cu2+ and Li1+ ions
normal to the surface, exhibit stiffening along the -direction
and softening along the -direction as the temperature is
lowered.
M. El-Batanouny acknowledges support from the U.S. Department of Energy under Grant No. DE-FG02-85ER45222. F. C. Chou acknowledges support from National Science Council of Taiwan under project No. NSC-95-2112-M-002. ME would like to thank C. Chamon and W. Klein for valuable discussions.
References
- (1) S. Zvyagin et al., Phys. Rev. B 66, 064424 (2002).
- (2) K.-Y. Choi et al., Phys. Rev. B 69, 104421 (2004).
- (3) T. Masuda et al., Phys. Rev. Lett. 92, 177201 (2004).
- (4) A. A. Gippius et al., Phys. Rev. B 70, 020406 (2004).
- (5) S. Park et al., Phys. Rev. Lett. 98, 057601 (2007).
- (6) H. J. Xiang and M.-H. Whangbo, Phys. Rev. Lett. 99, 257203 (2007).
- (7) S. Seki et al., Phys. Rev. Lett. 100, 127201 (2008).
- (8) S. W. Huang et al., Phys. Rev. Lett. 101, 077205 (2008).
- (9) Y. Naito et al., J. Phys. Soc. Jpn. 76, 023708 (2007).
- (10) A. Rusydi et al., Appl. Phys. Lett. 92, 262506 (2008).
- (11) Y. Yasui et al., J. Phys. Soc. Jpn. 78, 084720 (2009).
- (12) Y. Kobayashi et al., J. Phys. Soc. Jpn. 78, 084721 (2009).
- (13) H. Katsura, N. Nagaosa, and A. V. Balatsky, Phys. Rev. Lett. 95, 057205 (2005).
- (14) I. A. Sergienko and E. Dagotto, Phys. Rev. B 73, 094434 (2006).
- (15) M. Mostovoy, Phys. Rev. Lett. 96, 067601 (2006).
- (16) Y. Yao et al., Surf. Sci. 604, 692 (2010).
- (17) H. C. Hsu, H. L. Liu, and F. C. Chou, Phys. Rev. B 78, 212401 (2008).
- (18) M. Farzaneh et al., Phys. Rev. B 72, 085409 (2005).
- (19) D. Farias and K.-H. Rieder, Rep. Prog. Phys. 61, 1575 (1998).
- (20) R. L. Park, J. E. Houston and D. G. Schreiner, Rev. Sci. Instr. 42, 60 (1971).
- (21) L. L. Boyer and J. R. Hardy, Phys. Rev. B 7, 2886 (1973).