Local influence of boundary conditions on a confined supercooled colloidal liquid
Abstract
We study confined colloidal suspensions as a model system which approximates the behavior of confined small molecule glass-formers. Dense colloidal suspensions become glassier when confined between parallel glass plates. We use confocal microscopy to study the motion of confined colloidal particles. In particular, we examine the influence particles stuck to the glass plates have on nearby free particles. Confinement appears to be the primary influence slowing free particle motion, and proximity to stuck particles causes a secondary reduction in the mobility of free particles. Overall, particle mobility is fairly constant across the width of the sample chamber, but a strong asymmetry in boundary conditions results in a slight gradient of particle mobility.
1 Introduction
Glasses can form by rapidly cooling some liquids, or putting them under large pressures angell00 . While this process of glass formation has been studied for years, questions still remain angell00q . One method of study has been to examine the properties of glass forming materials when they are confined. This confinement can be in thin films, nanocapillary tubes, or nanoporous materials mckenna05 ; roth05 . In some cases confined materials become more glassy, while in other cases they become less glassy. A key factor seems to be the boundary conditions mckenna05 ; kob02 ; lowen99 ; ngai02 . “Sticky” boundary conditions, where the sample forms strong chemical bonds to a wall, tend to result in glassier behavior. “Free” boundary conditions, such as a free-standing polymer thin film, tend to result in more liquid-like behavior.
Colloidal suspensions are composed of small particles in a liquid, with particles of diameter a few microns or smaller. These are a good model system to study the glass transition pusey86 ; weeks00 ; brambilla09 ; snook91 ; vanmegen98 ; courtland03 ; lynch08 . The transition has one main control parameter, the volume fraction of the solid particles. When , the sample appears glassy. Macroscopically, such samples do not flow, and microscopically, particles no longer diffuse through the sample brambilla09 ; snook91 ; vanmegen98 ; courtland03 ; lynch08 ; cheng02 . Previous experiments showed that confinement results in slower colloidal dynamics, far more than would be due to hydrodynamic drag near a wall nugent07prl ; sarangapani08 . These experiments used either smooth glass walls, or walls with a few colloidal particles stuck to them. It was unclear if the boundary conditions made a strong difference, as in all cases the confined particles diffused more slowly, and the studies did not look for differences based on boundary conditions.
In this work, we reexamine the data of Ref. nugent07prl , studying how local variations in the boundary conditions influence particle motion. We find that mobile particles which are close to immobile particles (ones stuck to the confining sample chamber walls) have slower motion. This also influences how particles rearrange; rearrangements are easier farther away from stuck particles. Our results show that variability in the boundary conditions exerts a localized influence on particle motion, enhancing the glassiness of the confined sample.
2 Experimental Methods
We use colloidal poly-methyl-methacrylate (PMMA) particles for our samples. These particles are sterically stabilized with a short polymer layer of poly-12-hydroxystearic acid (PHSA), which protects them from aggregating antl86 . In certain solvents these particles behave as good approximations to hard spheres, with interactions only when they are close enough for the PHSA polymers to overlap pusey86 ; brambilla09 ; snook91 ; vanmegen98 . Our solvent mixture is composed of cyclohexylbromide and decalin, chosen to match the index of refraction and the density of the PMMA particles dinsmore01 . In this mixture, the particles acquire a slight charge dinsmore01 . (This charge is most noticeably manifested as a shifting of the first peak of the pair correlation function to positions slightly larger than the particle diameter, which would be the position for hard spheres.) To frustrate crystallization in our samples, we use a mixture of two particle sizes with mean radii m and m, and with individual volume fractions , , and (sample A in Ref. nugent07prl ). The mean particle radii have an uncertainty of m and a polydispersity of 5% (samples of each individual species eventually can form colloidal crystals, indicating that they are not too polydisperse).
The particles are observed using confocal microscopy prasad07 . Our microscope (“VT-Eye,” Visitech) can scan two-dimensional (2D) images at a frame rate of 92 images/s, and we scan a three-dimensional (3D) image stack composed of 100 2D images once every 2.0 s, for the data presented in this work. In our solvent mixture with viscosity mPas, the time for a small particle to diffuse its own radius in a dilute suspension is roughly 3 s. In our concentrated samples, diffusion is much slower, and so our 2.0 s interval between image stacks is sufficiently rapid to follow the motion of all of the particles in 3D using standard particle tracking techniques dinsmore01 ; crocker96 . Our image stacks are of dimensions m3, and particle positions are resolved to within 50 nm in and and 100 nm in . To aid in image analysis, only the small particles are dyed, and thus we cannot observe the behavior of the large particles using confocal microscopy. We have used differential interference contrast microscopy (DIC) to verify that the large particles are behaving similarly to the small particles, and other experiments lynch08 and simulations desmond09 give us confidence that the two particle species should not behave too differently in either their positions or their dynamics.
We place these samples in wedge-shaped sample chambers, with a wedge angle of less than a degree. This allows us to study the same sample at a variety of thicknesses , down to m. We have never seen an influence of the gradient in in any of our data nugent07prl ; edmond10 . Further details of our sample chambers are discussed in Ref. edmond10 .
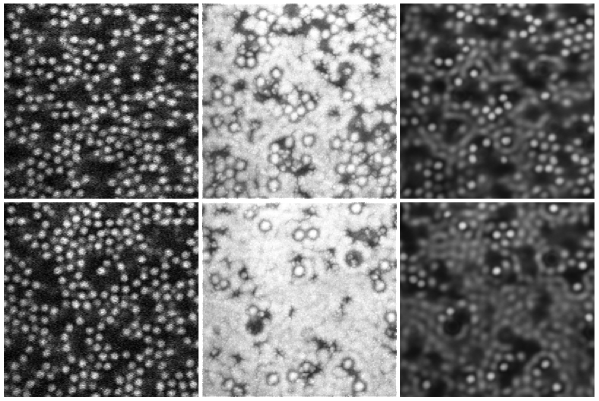
Our sample chamber walls are flat, untreated glass (a glass coverslip on one side, a glass microscope slide on the other). Due to the slight charges on the particles and the glass walls, the particles are repelled from the walls. However, we observe over long periods of time that some particles become stuck to the glass, and it is the influence of these stuck particles that we investigate in this article. These particles are visible in Fig. 1. The top row shows images corresponding to the top of the slide, and the bottom row shows images from the bottom of the slide in the same and location. The left images are 2D raw images taken from the confocal movie. The middle panels are the maximum intensity observed at each pixel over the duration of the movie. In these images, stuck small particles show up as distinct white circles, and stuck large particles show up as black regions. The remaining space is filled in fairly uniformly by the visible small particles exploring the available free space. The right panels of Fig. 1 show the time-averaged intensity of each pixel. Here the brightest white circles are the stuck particles, and the less bright spots are where mobile particles spent longer periods of time. The darker regions correspond to locations where no visible particles wandered during our observation period, and thus are likely to have invisible particles stuck in those locations.
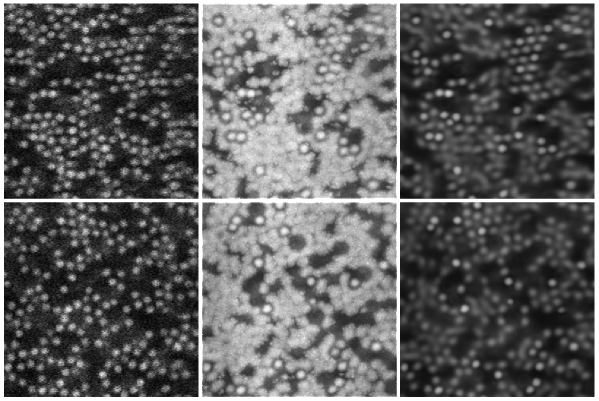
The images of Fig. 1 show that the stuck particles are easy to distinguish in the data, as they do not move. We also note that their positions are closer to the wall than the other particles, both giving us evidence for the repulsion of the mobile particles from the walls, and also allowing us to accurately determine the local thickness based on the stuck particle positions edmond10 . The area fraction of the stuck particles ranges from 10% to 20% (total for both species). From DIC microscopy as well as images such as those shown in Fig. 1, we find that the large particles appear to be stuck in comparable area densities to the small particles. It is interesting to also note that there are large patches next to the walls which do not have any stuck particles. This can be see in the connected regions that are uniformly bright in the middle images of Fig. 1. While the avoided regions make it clear where the stuck particles are located, the regions fully explored by the mobile particles given a sense of where the particles see only the flat glass wall.
From the positions of the stuck particles, we can determine the sample thickness . This is the maximum range that the particle centers can cover, whereas the actual wall spacing is . As we can determine more precisely than we know , we report our results in terms of . The uncertainty in measurements of is m and m nugent07prl . Our uncertainty of is low, much smaller than our resolution (0.1 m in ), because we average over all of the particles stuck on each surface to find the surface’s location in . While individual particles’ -positions vary because of noise, the average is well defined in all cases.
3 Results
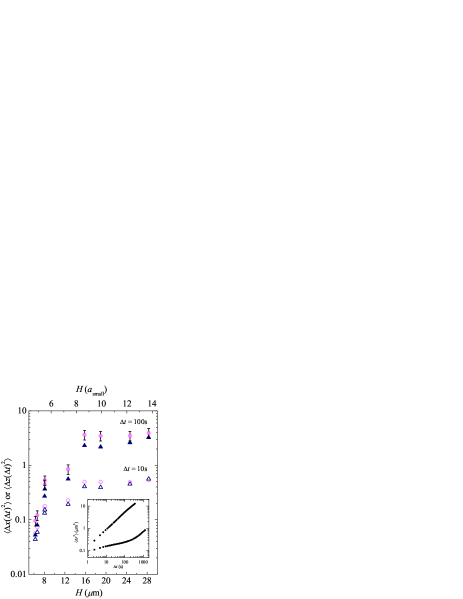
As noted in the introduction, our prior work showed that confinement results in slower particle motion. This is illustrated in Fig. 2, which shows the mean distance particles move (circles) and (triangles) within a given time , as a function of the thickness . For m, there is no dependence on , suggesting that m is the onset length scale for the confinement effects for this sample. For smaller , the motion slows down dramatically. This suggests that confinement induces the colloidal glass transition to occur “earlier,” that is, at a lower volume fraction than would be seen in the bulk. The results do not vary qualitatively with the time scale ; in the results below, we use s as a representative time scale. In our earlier work, we found that the onset length scale grows with increasing volume fraction as nugent07prl . In this article we focus on a single sample with , as discussed above. (This sample is a liquid when unconfined, and while it slows down upon confinement, the sample never enters the glassy state for any confinement we have studied.)
Simulations found both faster and slower dynamics within confined samples, depending on the texture of the confining boundary. For cases with smooth walls, particle motion is faster, and for cases with rough walls, particle motion is slower kob02 ; lowen99 . To simulate rough walls, typically one simulates a bulk liquid, and then locks the positions of some of the particles into place to become the walls, as shown in Fig. 3(a). Near the walls, this roughness sterically frustrates particle motion parallel to the walls, and thus intuitively it is sensible that these boundary conditions result in glassier dynamics. It has also been noted that for smooth walls, particles tend to form layers near the walls lowen99 ; desmond09 ; aim67 . Particles which move within layers then could potentially move more easily lowen99 . In one set of simulations, an extra spatially varying potential was added to either enhance or prevent particle layering goel08 . They found that particles are indeed more mobile when organized into layers. An implication then is that in addition to the steric frustration of motion, rough layers such as shown in Fig. 3(a) prevent particles from layering on the walls, and this will additionally slow the dynamics.
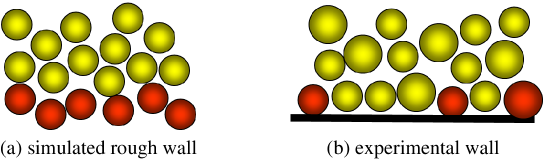
Our boundary conditions, schematically shown in Fig. 3(b), present two conflicting possibilities. Mobile particles are hindered in their motion when they encounter stuck particles. This should lead to glassier behavior when the samples are confined (implying that more particles are close to the wall, where they feel the influence of the stuck particles). On the other hand, the flat patches allow particles to form layers against the wall. Furthermore, the stuck particles are the same size as these layers, and so also help formation of additional layers farther from the wall. Indeed, we do see layering of the visible (small) particles, as discussed in Ref. nugent07prl ; edmond10 (cf. dotted lines in Fig. 6). Simulations suggest that the larger invisible particles also form layers against the walls, although because of the binary mixture, the layers of both particle sizes quickly wash out away from the walls desmond09 . Our prior work found that particles prefer to move within these layers edmond10 , suggesting the possibility of enhanced mobility, based on comparison with the simulations. The one mitigating factor is that particles within the layers next to the walls are a mixture of the two particle sizes, and so the layers are more “entangled” than they would be if all of the particles were identical in size lowen99 ; desmond09 . It is worth noting that in our prior work, we also studied cases with completely smooth walls and no stuck particles. In those experiments, confinement still resulted in slower motion nugent07prl . This demonstrates that the stuck particles are not solely responsible for confinement induced slowing in our samples, although perhaps they slow motion even further.
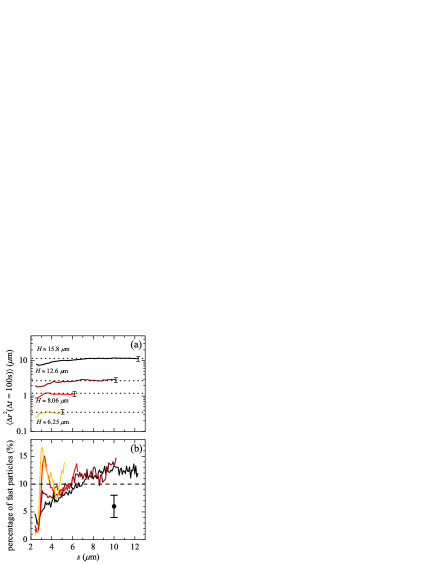
To clarify the role of the stuck particles, we examine how the motion of the mobile particles depends on their distance to the nearest stuck particle. It is important to note that we only know the distance to the nearest visible stuck particle, so some particles will appear far from any stuck particle and yet be neighboring an invisible stuck particle. With this caveat in mind, we plot the mean squared displacement as a function of distance from the nearest visible stuck particle in Fig. 4(a) (using s). ( is defined based on the initial position of the mobile particle at , rather than the final position at .) Near a stuck particle, decreases by about 10 - 20 percent. The size of the decrease appears about the same for all samples. However, thicker samples show a longer-ranged influence of the stuck particles; we are not sure why. For the m data, the stuck particle influence is seen even out to m, nearly three small particle diameters. Slight upturns are seen at the smallest values of that we plot, around m . These are due to tracking errors (particles which appear incorrectly closer to a stuck particle than their diameter), which causes a larger subsequent displacement when the tracking error is corrected. For all curves in Fig. 4(a), the data at large values of typically correspond to particles near the edge of our imaging volume, where no visible stuck particles happen to be nearby within the imaging volume. Because of the high likelihood of being adjacent to stuck particles outside the imaging volume (given the fairly uniform coverage of the stuck particles on long length scales), we crop the data for where we think the data are potentially misleading. In all cases, the cropped data are essentially flat, that is, independent of and continuing the trend shown in Fig. 4(a).
We note that the magnitude of the effect seen is not large, on the scale of the dramatic slowing down shown in Fig. 2. That is, the slowing due to varying the sample thickness appears to be the primary effect, and the influence of the texture is a secondary effect. For example, changing from 12.6 m to m in Fig. 4(a) changes the overall dynamics by a factor of more than 2, as indicated by the horizontal dotted lines, while the proximity to stuck particles results in a decrease by a factor of only 1.2 for each . The variation between the amount of stuck particles on walls ranges from 10% to 20% of the area, which our current results suggest is not enough of a variation to change the overall character of the slowed dynamics as a function of (in other words, the data shown in Fig. 2).
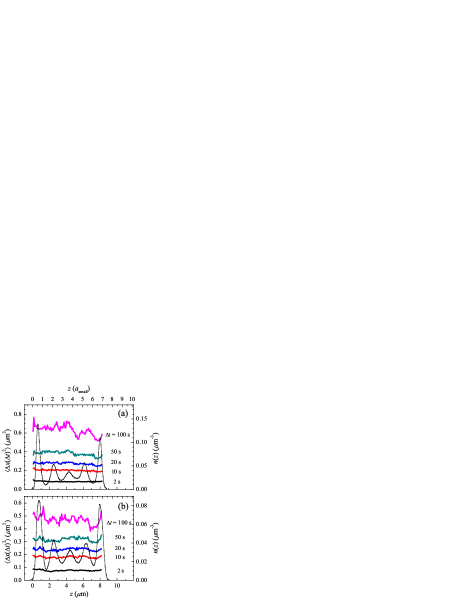
Despite the weakness of the effect, these results suggest that different boundary conditions will slightly influence the overall dynamics. For example, if there were more stuck particles on one side of the sample chamber than on the other, we might expect a gradient in mobility. Such asymmetric boundary conditions are present in a few of our experiments, such as the example shown in Fig. 5. Here, the top of the sample chamber has more stuck particles than the bottom. This is most clearly seen by contrasting the top-middle image (from the top of the sample chamber) with the bottom-middle image. To examine the impact on the mobility of particles, we plot the average mean square motion as a function of in Fig. 6(a). Here, the dotted black line indicates the number density as a function of , showing the layers of particles, and the thicker shaded curves show the mobility for different lag times as indicated. Especially for the longest lag time s, particles are more mobile closer to , where there are fewer stuck particles at the glass wall. Figure 6(b) shows the more common case that we observe, corresponding to the more symmetric boundary conditions of Fig. 1, and where there is little variation in mobility across the sample.
One last question is how the stuck particles influence the spatial dynamical heterogeneity. Prior work has shown that in glassy materials, motion occurs intermittently in time and in spatially localized regions at any given moment kob97 ; donati98 ; sillescu99 ; ediger00 . For example, microscopy studies of dense colloidal suspensions found cooperative motion, where groups of particles would all rearrange simultaneously weeks00 ; courtland03 ; lynch08 ; marcus99 ; kegel00 ; konig05 . Our results above show that proximity to stuck particles at the boundary decreases the average mobility of particles; this suggests that the most mobile particles undergoing cooperative rearrangements are less likely to be near the stuck particles.
To check this, we define a highly mobile particle as one with a displacement in the top 10 percentile of the displacement distribution edmond10 . If the sample behaves homogeneously, we expect that in any given region, roughly 10% of the particles we observe there over time should be highly mobile. We first define displacements using the methods of Refs. weeks00 ; donati98 : , with ; by allowing the time interval to fluctuate, this removes some of the “noise” of the Brownian motion and highlights the truly large motions. We determine the threshold such that 10% of the displacements are larger than this threshold. We then examine, as a function of , what fraction of particles at that distance have displacements larger than the threshold. The results are plotted in Fig. 4(b), which would be a flat line at 10% if there was no influence of the stuck particles (indicated by the horizontal dashed line). Instead, we see that the highly mobile particles are less likely to be adjacent to stuck particles. Clearly, the stuck particles have a strong influence on the spatially heterogeneous dynamics. While the two thinnest data sets ( m and m, darkest curves) show a spike around m, it is most likely noise due to lack of statistics, whereas the dip close to contact ( m) is systematic for all data. We estimate the uncertainties due to noise in Fig. 4(b) are %, judging from the large data. The deviations for m appear significant, especially the dip close to contact.
4 Conclusions
We have studied the influence of confinement on a dense colloidal suspension, which is a good model system for a small-molecule glass-former. Confinement between two rigid glass walls results in slower particle motion nugent07prl . In this article, we examined how particles stuck on the walls influence the dynamics of nearby particles. Not surprisingly, proximity to a stuck particle results in reduced mobility. In cases where one wall has more stuck particles than the opposite wall, a slight gradient in mobility is seen, with the slowest motion next to the roughest wall. These results are in qualitative agreement with simulations, although the roughness in simulations is of a different character than our experiment kob02 ; lowen99 .
One caveat is that in our experiments, only the small particles are fluorescently dyed and so we do not see the large particles. There are both mobile large particles whose motion is unknown, and also large particles stuck against the wall whose influence is unseen. Presumably these latter particles diminish particle mobility nearby. Currently, we see a reduction in average particle motion of about 20% near stuck visible particles. Likely if we could measure the distance to the nearest particle of either size, the observed reduction in average particle motion near immobile particles would become more pronounced. However, it is possible that due to the layering, proximity to immobile large particles would not slow down the mobile small particles. Prior experimental studies of binary particle mixtures do not see a strong overall difference in mobility of the small and large particle species lynch08 , and our qualitative observations of confined samples using DIC microscopy likewise did not see large differences.
Our work shows that local variations in wall texture influence the motion of nearby particles, and this in turn suggests that it is possible to locally tune particle mobility by tuning wall texture. While this observation is unsurprising, this has implications for microfluidic flow of colloidal suspensions. First, the effective viscosity of a colloidal suspension is likely higher in a small capillary tube, given our observed glassiness in the particle motion. (However, the viscosity and diffusivity may depend differently on the confinement length scale mckenna05 .) Second, if particles stick to the capillary tube walls, then over time the mobility will decrease especially strongly near the stuck particles.
We are currently conducting experiments to study more complex and controlled wall textures to see their influence on the glassiness of confined of colloidal suspensions, and we hope to report on this work in the future.
This work was supported by a grant from the National Science Foundation (DMR-0804174). We thank A. Schofield and W. C. K. Poon for providing our colloidal particles.
References
- (1) C.A. Angell, K.L. Ngai, G.B. McKenna, P.F. McMillan, S.W. Martin, J. App. Phys. 88(6), 3113 (2000)
- (2) C.A. Angell, J. Phys.: Cond. Matt. 12(29), 6463 (2000)
- (3) M. Alcoutlabi, G.B. McKenna, J. Phys.: Cond. Matt. 17(15), R461 (2005)
- (4) C.B. Roth, J.R. Dutcher, J. Electroanalytical Chem. 584(1), 13 (2005)
- (5) P. Scheidler, W. Kob, K. Binder, Europhysics Letters 59(5), 701 (2002)
- (6) Z.T. Németh, H. Löwen, Phys. Rev. E 59(6), 6824 (1999)
- (7) K.L. Ngai, Phil. Mag. B 82, 291 (2002)
- (8) P.N. Pusey, W. van Megen, Nature 320(6060), 340 (1986)
- (9) E.R. Weeks, J.C. Crocker, A.C. Levitt, A. Schofield, D.A. Weitz, Science 287(5453), 627 (2000)
- (10) G. Brambilla, D.E.M. El Masri, M. Pierno, L. Berthier, L. Cipelletti, G. Petekidis, A.B. Schofield, Phys. Rev. Lett. 102(8), 085703 (2009)
- (11) I. Snook, W. van Megen, P. Pusey, Phys. Rev. A 43(12), 6900 (1991)
- (12) W. van Megen, T.C. Mortensen, S.R. Williams, J. Müller, Phys. Rev. E 58(5), 6073 (1998)
- (13) R.E. Courtland, E.R. Weeks, J. Phys.: Cond. Matt. 15(1), S359 (2003)
- (14) J.M. Lynch, G.C. Cianci, E.R. Weeks, Phys. Rev. E 78(3), 031410 (2008)
- (15) Z. Cheng, J. Zhu, P.M. Chaikin, S.E. Phan, W.B. Russel, Phys. Rev. E 65(4), 041405 (2002)
- (16) C.R. Nugent, K.V. Edmond, H.N. Patel, E.R. Weeks, Phys. Rev. Lett. 99(2), 025702 (2007)
- (17) P.S. Sarangapani, Y. Zhu, Phys. Rev. E 77(1), 010501 (2008)
- (18) L. Antl, J.W. Goodwin, R.D. Hill, R.H. Ottewill, S.M. Owens, S. Papworth, J.A. Waters, Colloids and Surfaces 17(1), 67 (1986)
- (19) A.D. Dinsmore, E.R. Weeks, V. Prasad, A.C. Levitt, D.A. Weitz, App. Optics 40(24), 4152 (2001)
- (20) V. Prasad, D. Semwogerere, E.R. Weeks, J. Phys.: Cond. Matt. 19(11), 113102 (2007)
- (21) J.C. Crocker, D.G. Grier, J. Colloid Interf. Sci. 179(1), 298 (1996)
- (22) K.W. Desmond, E.R. Weeks, Phys. Rev. E 80(5), 051305 (2009)
- (23) K.V. Edmond, C.R. Nugent, E.R. Weeks, arXiv:1003.0856 (2010)
- (24) B.R. Aïm, L.P. Goff, Powder Technology 1(5), 281 (1967)
- (25) G. Goel, W.P. Krekelberg, J.R. Errington, T.M. Truskett, Phys. Rev. Lett. 100(10) (2008)
- (26) W. Kob, C. Donati, S.J. Plimpton, P.H. Poole, S.C. Glotzer, Phys. Rev. Lett. 79(15), 2827 (1997)
- (27) C. Donati, J.F. Douglas, W. Kob, S.J. Plimpton, P.H. Poole, S.C. Glotzer, Phys. Rev. Lett. 80(11), 2338 (1998)
- (28) H. Sillescu, J. Non-Cryst. Solids 243(2-3), 81 (1999)
- (29) M.D. Ediger, Annu. Rev. Phys. Chem. 51(1), 99 (2000)
- (30) A.H. Marcus, J. Schofield, S.A. Rice, Phys. Rev. E 60(5), 5725 (1999)
- (31) W.K. Kegel, A. van Blaaderen, Science 287(5451), 290 (2000)
- (32) H. König, R. Hund, K. Zahn, G. Maret, Euro. Phys. J. E 18(3), 287 (2005)