Spin-Correlation Coefficients and Phase-Shift Analysis for p+3He Elastic Scattering
Abstract
Angular distributions for the target spin-dependent observables A0y, Axx, and Ayy have been measured using polarized proton beams at several energies between 2 and 6 MeV and a spin-exchange optical pumping polarized 3He target. These measurements have been included in a global phase-shift analysis following that of George and Knutson, who reported two best-fit phase-shift solutions to the previous global p+3He elastic scattering database below 12 MeV. These new measurements, along with measurements of cross-section and beam-analyzing power made over a similar energy range by Fisher et al., allowed a single, unique solution to be obtained. The new measurements and phase-shifts are compared with theoretical calculations using realistic nucleon-nucleon potential models.
pacs:
21.45.-v, 21.30.-x, 24.70.+s, 25.40.CmI Introduction
Beginning from the picture that atomic nuclei are composed of interacting nucleons, ab initio calculations of light nuclear systems are based on realistic nucleon-nucleon potential models, which have been adjusted to reproduce two-nucleon (NN) scattering and bound-state data accurately Car98 . This effort has included calculations of low-energy scattering observables for the three-nucleon (3N) and four-nucleon (4N) systems. The latter calculations are especially significant because the 4N system is the lightest to exhibit thresholds and resonances Til92 , so that its correct description is an important milestone for this approach.
The comparison of ab initio calculations with nucleon-deuteron scattering measurements reveals general agreement for the cross-section and tensor analyzing powers, but significant underprediction of the beam and target analyzing powers Glo96 . A similar “Ay Puzzle” has been reported for p+3He elastic scattering Fis06 . All NN models and theoretical methods yield this disagreement, which is not resolved by including the 3N force necessary to reproduce the 3N and 4N binding energies Kie10 .
The study of this discrepancy may benefit from the more thorough comparison between theory and experiment made possible by a set of experimental phase-shifts and mixing parameters. For example, Ay is known to be particularly sensitive to the splitting between triplet P-wave phase-shifts Fis06 . A wealth of experimental data exists for p+3He elastic scattering below 12 MeV proton energy, with the most recent phase-shift analysis by George and Knutson Geo03 performed on a database of over 1000 data points. That analysis, however, was unable to constrain a unique set of parameters, and instead obtained two solutions which fit the data equally well. The difference between the two solutions was largest for spin-correlation coefficients below 4 MeV, where no such data exist. With the aim of resolving the phase-shift ambiguity, we have used a polarized 3He target Kat05 to measure angular distributions of the spin-correlation coefficients Axx and Ayy at proton energies between 2 and 6 MeV and included those new data, along with those of Fisher et al. Fis06 , in a new global phase-shift analysis following that of George and Knutson.
II Experiment
II.1 Polarized Target
Polarized and unpolarized beams from the Triangle Universities Nuclear Laboratory (TUNL) tandem accelerator were directed by an analyzing magnet to a 62 cm diameter scattering chamber. The polarized 3He target was specifically designed for low-energy charged-particle scattering experiments and has been described previously in detail Kat05 . In contrast to previous targets used for the same purpose Roh68 -All93a which operated by metastability-exchange optical pumping (MEOP), the present target used spin-exchange optical pumping (SEOP). This method has previously been used in polarized 3He targets for electron Ant96 and gamma-ray Kra07 scattering experiments.
The primary advantage of SEOP over MEOP is greater target thickness, since it polarizes 3He at a pressure of about 8 bar instead of several mbar. The need to minimize energy loss for the incident and scattered particles for the low-energy application, however, required the use of thin windows to contain the gas. Since such windows cannot withstand the full 8 bar 3He pressure, we optically pumped 3He in a system separate from the scattering target cell. The target cell was then batch-filled with polarized gas to a pressure of approximately 1 bar.
The target cell was a 5.1 cm Pyrex sphere with openings along the equator for the incident and scattered particles. These were covered with 7.6 m Kapton foil affixed with Torr Seal epoxy Var . The cell was housed in a compact sine-theta coil to provide a uniform 0.7 mT magnetic holding field. An NMR coil pressed against the rear of the cell was used to measure the target polarization, as discussed below.
The 3He polarization was produced by SEOP using Rb as the intermediate alkali metal. A 60W fiber-coupled diode laser system tuned to the 795nm Rb D1 absorption line provided, with appropriate optics, the circularly polarized light for the optical pumping. Two modifications to our original polarizer Kat05 were attempted. In agreement with results reported by others Bab03 , the use of “mixed metal” optical pumping cells containing both Rb and K was found to decrease the “spin-up” time Cou06 . In this work, the typical time required to reach saturation polarization was about 12 h with mixed-metal cells, compared to about 24 h using only Rb.
The other modification was the use of frequency-narrowed laser light for optical pumping. Following the work of Cha03 , an external Littrow cavity was constructed and used to reduce the output width of 50 W Quintessence Qui diode bar array from 2 nm to 0.3 nm Arn06a . The narrowed output power was about 30 W. Unfortunately, the 3He polarization produced with this laser system was not consistently higher than that produced with the 60-80 W broadband system, perhaps because more light was absorbed from the latter. The majority of the present data was therefore taken with the broadband laser.
II.2 Scattering Measurements
The experimental arrangement is illustrated in Fig. 1. Beam current on the target cell was limited to 50 nA to minimize damage to the Kapton foils. Failure of the epoxy, especially that sealing the beam-exit foil, caused cells to leak after a few days. Each such failure required a cell change and recalibration of the NMR signal (see below).

Measurements were made at five proton energies below 6 MeV which overlap the energies of both Fisher et al. Fis06 and Alley and Knutson All93a . Analyzing magnet settings which determined the beam energy were selected according to the calibration of Ref. Fis03 . Beam energies were adjusted to offset energy loss in the foils and gas, as modeled with TRIM Sri08 . Bombarding energies for data taken with different thickness entrance foils were slightly different, and the error-weighted average value was adopted. The uncertainty in TRIM stopping powers for materials used was estimated by comparison with experimental stopping powers Sri08 , and ranged from 3-10%. An uncertainty of 10% was assigned to cases where no data were present in the relevant energy range.
The beam and target polarizations were reversed frequently during data-taking. The beam polarization was reversed at either 1 or 10 Hz in the sequence “udduduud”, where “u” means “spin-up” and “d” means “spin-down”. The target polarization was reversed less frequently, since a few seconds were required to reverse the target’s magnetic field. Polarized target data were collected for intervals of 2.5 m in each spin orientation, with NMR measurements of the magnitude of the polarization made immediately before and after the orientation was reversed. The target polarization decayed with a 2-3 h time constant, so this process was stopped when the gas was judged to be too depolarized, generally after about 1 h. At that time the gas was exhausted from the target cell, which was then flushed with research-grade N2 and refilled with a new batch of polarized gas. The recovered depolarized 3He gas was circulated through a LN2-cooled trap to remove impurities before repolarization.
Scattered particles emerging from the target were detected by four pairs of Si detectors which could be rotated to the desired angle. Available angles were restricted by the windows in the sine-theta coil’s mu-metal shield to 20∘ increments between 30 and 150∘. The shield could be moved axially so that “intermediate” angles offset by 10∘ were also available. The detectors were each placed in an Al holder behind two brass collimators spaced 5.08 cm apart in an Al “snout”, which restricted the range of scattering angles visible to the detector to 1.5∘. Detectors were as close as possible to the target without the 30∘ snout’s touching the sine-theta coil, so that the distance from the center of the target cell to the front collimators was about 10.2 cm. Beam current on target was measured by a electrostatically suppressed Faraday cup located about 0.5 m behind the target cell. Charge went to ground through a current integrator to measure the relative number of beam particles in each spin state.
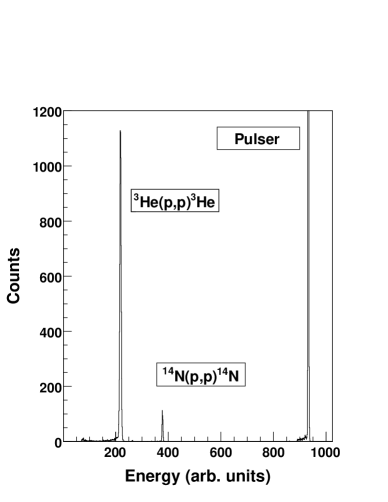
An example detector spectrum is shown in Fig. 2. The peaks corresponding to protons elastically scattered from 3He and small amounts of N2 were well separated. The latter was required by the optical pumping process Kat05 . Occasionally 4He was added to the cell to measure the beam polarization, and in some cases that peak overlapped the 3He peak. In such cases the peaks were fit with skewed Gaussians. A pulser was added to each spectrum to measure electronic dead time, which was typically less than 1%.
The observables were extracted from peak yields in left (L) and right (R) detectors using an extension of the geometrical mean method Ohl73 for analyzing powers to include polarized beam and target. With the spins aligned vertically along the y-axis, the following cross-ratios were formed:
where the arrows indicate the beam and target spin state, for example refers to the number of particles scattered into the left detector while the beam was spin “up” and the target was spin “down”. The detector yields were normalized to the current integration and target pressure, which was known to about 2%, for each spin state. The polarization of the beam and target are given by and , respectively. The observables are therefore
| (1) | ||||
| (2) | ||||
| (3) |
Similarly, when the beam and target spins are aligned horizontally along the x-axis,
| (4) |
If either the beam or target is unpolarized, only one analyzing power will be non-zero, and its expression reduces to the usual cross-ratio for analyzing powers,
| (5) |
The same is true for the scattering of spin-1/2 protons from spin-0 -particles used for beam polarimetry.
II.3 Beam Polarimetry
Proton beam leaving an atomic beam polarized ion source Cle95 passed through a calibrated Wien filter at the ion source to orient the spin quantization axis of the beam in the desired direction at the scattering chambers. The magnitude of the beam polarization was measured periodically using p+4He elastic scattering in either the target cell or in a separate cell in a polarimeter chamber installed upstream of the target chamber. Detectors in the latter could be mounted at 110∘ in the horizontal or vertical scattering planes, so that either polarization component could be measured. The cell in the polarimeter chamber could be moved to insert it periodically into the beam for polarization measurements.
The p+4He asymmetries were divided by the analyzing power Ay to obtain the beam polarization. Published phase shifts Sch71 were used in a spin-on-spin-0 phase-shift code to calculate the analyzing powers for the energies at the center of the cell as determined from TRIM. The uncertainty in the resulting analyzing power was typically 2%.
For more than half of the spin-correlation data, however, the beam polarization was unstable, so that periodic monitoring did not necessarily determine the average polarization. Therefore, the beam polarization for all Ayy measurements was determined by normalizing our relative Ay0 measurements to published values Fis03 ; All93a . Each point in a relative Ay0 angle set was divided by a value linearly interpolated from those previous measurements at the same energy, and the polarization was taken to be the average of these ratios. An uncertainty of 0.02 was assigned to the polarization and added in quadrature with statistical uncertainties. No published data were available at 2.7 MeV, so smooth curves were fit through existing distributions at each angle vs. energy and evaluated at 2.7 MeV. The normalization then proceeded as above.
The procedure was extended to about one-third of the Axx measurements by “tipping” the spin 20∘ out of the plane with the Wien filter and applying the above analysis to the y-component. The x-component of the beam polarization was obtained by multiplying the y-component by the ratio of the two components. An 8% normalization uncertainty was applied to those angular distributions to account for the estimated 1.5∘ uncertainty in the relative azimuthal orientation of the scattering plane and the polarized beam s quantization axis. The remaining Axx measurements with stable beam polarization relied on polarimeter measurements as described above.
II.4 Target Polarimetry
As discussed in detail by Katabuchi et al. Kat05 , the target polarization was monitored using pulsed NMR. Briefly, an RF pulse at the Larmour frequency set by the sine-theta coil magnetic field was sent through a small coil pressed against the rear of the target cell. The resulting collective precession of 3He spins about that magnetic field induced a signal proportional both to the 3He polarization and pressure. This voltage was then divided by the cell pressure to give a relative measure of polarization.
These relative NMR data for each target cell were calibrated against separate 4He + 3He Ay measurements at an energy and angle where Ay= -1. The resulting scattering asymmetries for an incident 4He beam, given by Eq. 5, were therefore direct measurements of the 3He target polarization. This calibration method was motivated by the prediction of Plattner and Bacher Pla71 of an Ay = -1 extremum near 15.33 MeV 3He lab energy and 47∘ 3He lab scattering angle. Their prediction for its location was only approximate. Thus, relative measurements of Ay in 4He+3He elastic scattering as a function of angle and energy near the predicted extremum were made to define the local minimum. We determined min to be 46.64 0.22∘, and the measurements of Ay vs energy agree with the prediction of Ref. Har70 of a very broad minimum.
The simultaneous NMR-scattering calibrations for various target cells were made at 45∘, and Eα between 15.44 and 15.82 MeV. Since this was not exactly the minimum point for Ay, a target polarization value was assigned from the relative measurements with an uncertainty of 3%, normalized so that the minimum Ay was equal to -1.
II.5 Steering Effect
The target magnetic field, though small, steered the incoming and scattered protons slightly through the Lorentz force, as sketched in Fig. 3. When the B-field was reversed to reverse the target spin, the particles were steered oppositely, and the relationship between detector yields reversed.
First, the incoming beam deflection moved the scattering center closer to one detector and further from the other, thus changing their relative solid angles. Second, the scattered protons were deflected to emerge from the target cell at slightly different angles than those at which they were actually scattered. Thus, for a given orientation of the magnetic field, the actual scattering angle of particles reaching one detector of a left/right pair was more forward than the detector angle, while that of those reaching the other detector was more backward. This difference in scattering angle produced an instrumental asymmetry through the angular dependence of the differential cross section. These two steering effects, unlike other systematic effects Ohl72 , produced systematic instrumental asymmetries which were not cancelled by reversing the target spin.
These effects were largest at our lowest bombarding energies. Fig. 4 shows observables extracted from data taken while the target was unpolarized, when the asymmetries corresponding to the target analyzing power and spin-correlation coefficients should be zero. While this was true for A0y measured with the sine-theta coil’s magnetic field turned off, non-zero asymmetries were obtained with the field on. The asymmetries for Ayy and Axx, on the other hand, were consistent with zero even with the field on.

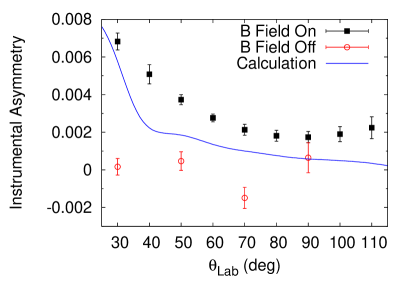
The result of a simple calculation of these two effects at 2.25 MeV is also shown in Fig. 4. Though the largest deflection angle calculated was 0.1∘, the resulting asymmetries are large enough to interfere with polarized target measurements. The calculation neglects the finite size of the beam and target, and simply determines the energy loss, modeled in TRIM, and magnetic steering of incoming and scattered protons in small steps as they proceed through the magnetic field. The calculation reproduces the general size and forward-angle trend of the effect, but with insufficient detail to be used to correct the data.
Instead, actual measurements of these instrumental asymmetries, obtained both from direct measurements with unpolarized 3He and by extrapolating polarized target asymmetries to zero polarization, were subtracted from polarized target A0y data. The corrections obtained in this way were often large, being several times the size of the observable at forward angles at the lowest proton energies.
II.6 Results for Observables
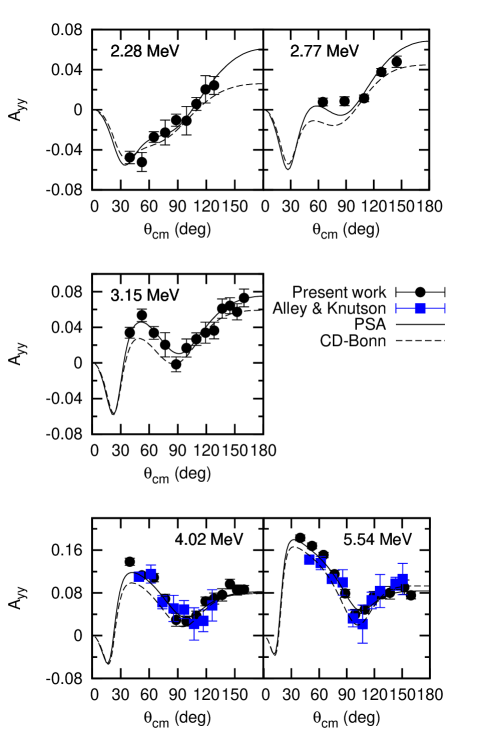
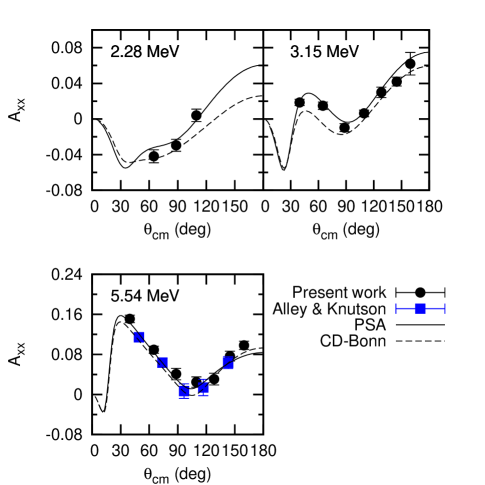
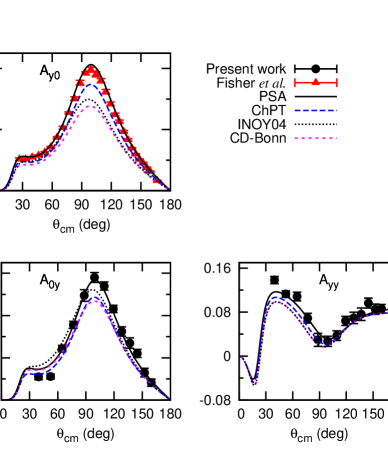
The present measurements of A0y, Ayy, and Axx are shown in Figs. 5-7. Each plot also includes a curve calculated from the new best-fit effective range parameters of the global phase-shift analysis (PSA) discussed below, as well as previous measurements where available. The overall agreement with the previous measurements is good, with the most forward-angle Ayy points of Alley and Knutson All93a at 5.54 MeV being the only exception, and the present results have smaller error-bars. The new measurements are well-fit by the phase-shift analysis, except for the two most forward-angle A0y points at 3.15 and 4.02 MeV. The forward-angle points required the largest correction for magnetic steering, so the disagreement with the PSA may indicate that the correction applied to those points was not sufficiently accurate.

III Phase-Shift Analysis
A phase-shift analysis of the global p+3He elastic scattering database below Ep= 12 MeV was performed following the earlier work of George and Knutson Geo03 , with the addition of about 300 new data points, including the and Ay0 measurements of Fisher et al. Fis06 and the present A0y, Ayy, and Axx measurements. These additional data all fell between 1.0 and 5.54 MeV. The search routine was the same as that used in the previous analysis and was provided by George Geo06 .
The program calculated scattering observables as functions of scattering matrix elements, which were in turn parameterized using phase-shifts and mixing parameters according to the Blatt-Biedenharn convention Bla52 . The phase-shifts and mixing parameters used were 1S0, 3S1, 1P0, 3P2, 3P1, 3P0, 1D2, , , and , as well as consolidated 3Dj and 3Fj triplet phase-shifts. The energy dependence of the phase-shifts and mixing parameters was described by the first three terms in a modified effective-range expansion. These 36 effective range parameters were adjusted to minimize with respect to the experimental database using the MINUIT package Jam94 . As described in Ref. Geo03 , the database was broken into groups of measurements thought to have common normalizations. These 21 normalization factors were analytically adjusted at each step of the parameter search to further minimize .
Initial parameter searches resulted in multiple solutions which were discontinuous in one or more of the 1D2, 3Dj, and 3Fj phase-shifts. The discontinuity, discussed also by Alley All92 , occurred when the phase-shift crossed zero and was deemed unphysical. The number of such solutions was reduced by fixing the small 3Fj phase-shift at the values obtained using the database of Alley and Knutson All93a . The best-fit when this parameter was not searched increased by only 0.2%. All but one of the remaining solutions, which spanned a range of about 10% in , were rejected by demanding that the phase-shifts be continuous in the energy range covered by the database. The remaining solution, which has the lowest and is adopted as the present global result, yields a small positive scattering length for 3Dj, indicating that a discontinuity must occur in that phase at an energy below the lower end of the database (100 keV). The best-fit effective range parameters and associated statistical uncertainties are given in Table 1.
| Phase | a0 | a1 | a2 | |||
|---|---|---|---|---|---|---|
| 1S0 | -9.0 | 0.4 | 7.9 | 0.6 | 1.0 | 0.2 |
| 3S1 | -11.06 | 0.17 | 7.5 | 0.3 | -0.09 | 0.08 |
| 1P1 | 5.44 | 0.15 | -1.7 | 0.3 | 4.05 | 0.13 |
| 3P2 | 2.128 | 0.012 | 1.591 | 0.018 | 0.356 | 0.009 |
| 3P1 | 1.63 | 0.02 | 2.06 | 0.04 | 0.592 | 0.018 |
| 3P0 | 8.8 | 0.3 | -1.5 | 0.3 | 2.40 | 0.09 |
| 1D2 | -14 | 4 | 15 | 4 | -8.3 | 1.3 |
| 3Dj | -0.06 | 0.19 | -3.4 | 0.9 | 7.2 | 0.4 |
| 3Fj | 4.19 | 38.3 | -6.29 | |||
| -5 | 5 | 34 | 6 | -10.7 | 1.7 | |
| -420 | 11 | 230 | 10 | -41 | 2 | |
| 17 | 7 | 8 | 6 | -5.9 | 1.4 | |
The global solution had a -per-datum of about 2 for the data added in this analysis. This could be improved to between 1.3 and 1.5 if points whose individual contributions exceeded 10 were rejected. About half of these 13 out of about 300 new points seemed simply to be random outliers, while the others seemed to be associated with systematic problems. These included some forward angle A0y points which had been corrected for magnetic steering. Another apparent systematic problem was found for Ay0 data at 1.60 MeV for which the four-most-forward angle points disagreed with the phase-shift analysis. The effect of their removal on the phase-shifts was generally negligible, and in all cases within the range of systematic error indicated by the single-energy analyses described below.
In order to gauge the effects of systematic errors, single-energy analyses were performed at energies where new spin-correlation and new or existing cross-section measurements were available, i.e. at nominal proton energies of 2.25, 3.13, 4.00, and 5.54 MeV. All measurements within 100 keV of the nominal energies were included. The same method was used for these single-energy fits as for the energy-dependent work, except that the phase-shifts were searched directly, instead of through the effective range parameters.
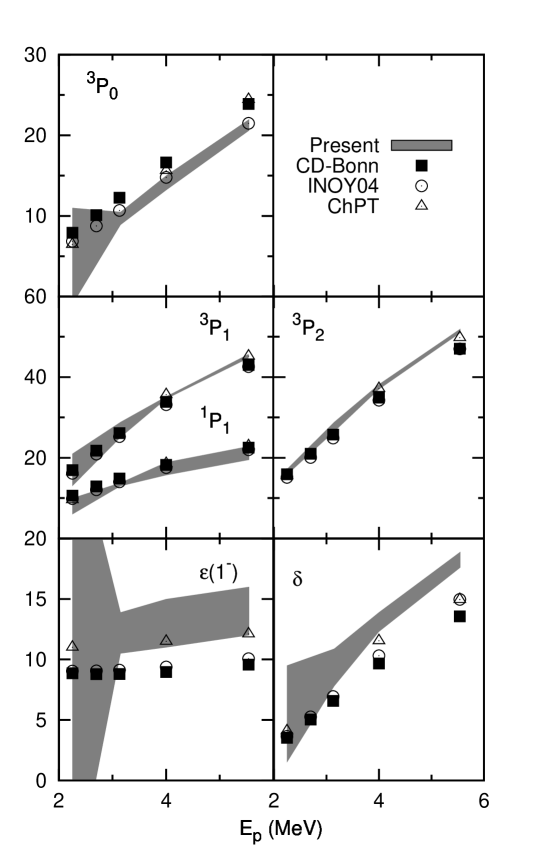
The present phase-shift results, both single-energy and global, are shown in Fig. 8, along with those of Refs. All93b and Geo03 . The addition of the new data removes the S-wave ambiguity in the latter results without qualitatively modifying the behavior of the other parameters, such as the resonant P-wave behavior associated with excited states of 4Li. The new, low energy data also seem to introduce some tension with previous, higher energy data, as indicated by differences between the present global results and those of Ref. All93b for 1S0 and 3P0.

Results for selected phase-shifts, in degrees, are tabulated in Tables 2-3 at the nominal energies of the single-energy analyses. The quoted uncertainties include statistical uncertainties and systematic sources including differences between the single-energy and global analyses and variation of the parameters when outliers are excluded. Theoretical calculations, described below, using the CD-Bonn realistic NN potential are also shown for comparison.
| 2.25 MeV | 3.15 MeV | |||||
| Phase | Present | CD-Bonn | Present | CD-Bonn | ||
| 1S0 | -39.1 | 1.7 | -39.6 | -48.7 | 0.9 | -49.3 |
| 3S1 | -34.5 | 0.7 | -34.8 | -42.90 | 0.09 | -42.9 |
| 1P1 | 8 | 2 | 10.6 | 13.4 | 0.4 | 14.9 |
| 3P0 | 5 | 6 | 7.9 | 9.7 | 0.8 | 12.3 |
| 3P1 | 17 | 4 | 16.9 | 27.0 | 1.9 | 26.1 |
| 3P2 | 16.5 | 0.7 | 16.0 | 27.7 | 1.2 | 25.8 |
| -10 | 20 | -8.9 | -12.2 | 1.7 | -8.3 | |
| 4.00 MeV | 5.55 MeV | |||||
| Phase | Present | CD-Bonn | Present | CD-Bonn | ||
| 1S0 | -56.3 | 0.6 | -56.8 | -67.8 | 0.9 | -67.1 |
| 3S1 | -49.3 | 0.5 | -49.7 | -58.6 | 0.3 | -59.2 |
| 1P1 | 17.3 | 1.6 | 18.2 | 21.2 | 1.7 | 22.5 |
| 3P0 | 14.1 | 0.9 | 16.6 | 21.3 | 0.7 | 23.9 |
| 3P1 | 34.9 | 0.3 | 33.9 | 45.2 | 0.5 | 43.0 |
| 3P2 | 37.6 | 0.6 | 34.9 | 51.5 | 0.5 | 47.0 |
| -13 | 2 | -9.0 | -14 | 2 | -9.6 | |
IV Comparison with Theoretical Calculations
We first compare our new experimental results with recent ab initio momentum-space calculations from Deltuva and Fonseca Del07b which rigorously include the Coloumb interaction and use a variety of 2N potentials. For simplicity, only their results obtained using the CD-Bonn potential Mac01 are shown in Figures 5-7, but the results of the other realistic 2N potentials considered, AV18 Wir95 and N3LO Ent03 , are similar. The A0y calculations consistently underpredict the new results by 10-20% at the maximum. This is similar to, though smaller than, the previously established 40% underprediction of Ay0 by several realistic potentials and theoretical methods Del07b ; Fis06 .
The theoretical results for the spin-correlation coefficients at Ep = 2.77 MeV and above agree with the present results at backward angles but are too small by about 0.02 at forward angles. The disagreement for backward angles between the theoretical results and the present phase-shift analysis at 2.28 MeV may result from the lack of back-angle data points, especially for Axx.
For the phase-shifts, the theoretical S-waves generally agree well with the present results, while the theoretical 1P1 and 3P0 phase-shifts are larger. The theoretical 3P1 and 3P2 phase-shifts, as well as the (1-) mixing parameter, are consistently smaller than our present results. The splitting between the triplet P-waves is also underpredicted, as shown in Fig. 9, where = 3P2 - ( 3P1 + 3P0)/2. This is interesting in light of the strong dependence of Ay0 on that splitting Fis06 .
Results from Deltuva and Fonseca using the Doleschall potential INOY04 Dol04 are also shown in Figures 9 and 10. That potential introduces non-localities to simulate implicitly the effect of three-nucleon forces, which are necessary to reproduce three-and four-nucleon binding energies. The parameters of those non-localities are adjusted to reproduce 3N scattering phase-shifts, and also better to reproduce the Ay0 measurements of Ref. Fis06 . Here, this potential improves the description of A0y somewhat, but has little effect on Axx and Ayy. Considering the phase-shifts, this model better describes 3P0 and produces a P-wave splitting closer to the experimental results.
The addition of explicit phenomenological 3N forces in theoretical calculations has traditionally not provided full agreement between experiment and theory for p + 3He observables, especially for Ay0. New results from Viviani Viv09 ; Viv10 using a 2N Ent03 and 3N Ber08 interaction derived from chiral perturbation theory at N3LO and N2LO, respectively, are shown in Fig. 10. The calculations, made using the Kohn variational principle and the hyperspherical harmonic technique, are compared with both the present A0y and Ayy results and Ay0 from Ref. Fis06 at 4 MeV. Satisfying reduction of Ay puzzle differences was obtained using this effective-field-theory version of the 3N interaction, corresponding to the improved agreement with the triplet P-wave phase-shifts shown in Fig. 9. Better agreement for the mixing parameter is also evident. Though theoretical agreement with experimental results is still not complete, Machleidt has suggested Mac09 that sizeable one-loop 3N force diagrams exist at N4LO of the -less chiral theory, or at N3LO when a phenomenological is included, and that their addition may ultimately explain the remaining differences.
V Conclusions
In this paper we have presented new measurements of A0y, Axx, and Ayy for p+3He elastic scattering between 2 and 6 MeV proton energy. The target analyzing power measurements represent an improvement in accuracy over previous results, while the spin-correlation measurements include the lowest-energy data to date.
These new measurements were included in a global phase-shift analysis and new phase-shifts were extracted. These additional data remove the ambiguity reported in Ref. Geo03 . Though discontinuities in the energy-dependence of the D- and F-wave phase-shifts were present, a single global solution was obtained by requiring that all phases be continuous over the energy range of the global database.
Recent theoretical calculations Del07b using realistic 2N potentials underpredict the present A0y results by 10-20%, which is similar to but smaller than the previously observed 40% underprediction of Ay0 Del07b ; Fis06 . The spin-correlation coefficients Axx and Ayy are better-described, though small underpredictions are observed at forward angles, and qualitatively different trends are observed at 2.25 MeV. The S-wave phase shifts agree well, but 1P1, 3P0, and differ, and the theoretical triplet P-wave splitting is too small.
The INOY04 potential Dol04 which includes a phenomenological 3N force improves the description of A0y and 3P0 and increases the P-wave splitting. Preliminary calculations by Viviani Viv09 of p + 3He elastic scattering observables at low energies using chiral 2N and 3N potentials show closer agreement with Ay0.
VI Acknowledgements
The authors gratefully acknowledge continuing theoretical support for this work from M. Viviani (Pisa) and A. Deltuva and A. Fonseca (Lisbon). We wish to thank E. George for making available to us the energy-dependent p+3He phase-shift analysis code used previously, and J. Dunham and B. Carlin whose continuing technical support throughout the project was essential to its successful completion. Additionally, we thank M. Boswell, C. Angell, and J. Newton for assistance with data-taking and R. Prior for supplying the p+4He phase-shift code. Financial support from the US Department of Energy Office of Nuclear Physics under Grant # DE-FG02-97ER4041 is also gratefully acknowledged.
References
- (1) J. Carlson and R. Schiavilla, Rev. Mod. Phys. 70, 743 (1998).
- (2) D. R. Tilley, H. R. Weller, and G. M. Hale, Nucl. Phys. A541, 1 (1992).
- (3) W. Glöckle et al., Phys. Rep. 274, 107 (1996).
- (4) B. M. Fisher et al., Phys. Rev. C 74, 034001 (2006).
- (5) A. Kievsky et al., http://arxiv.org/abs/1002.1601v1 (2010).
- (6) E. A. George and L. D. Knutson, Phys. Rev. C 67, 027001 (2003).
- (7) T. Katabuchi et al., Rev. Sci. Instrum. 76, 033503 (2005).
- (8) U. Rohrer et al., Helv. Phys. Acta 41, 436 (1968).
- (9) S. D. Baker, D. H. McSherry, and D. O. Findley, Phys. Rev. 178, 1616 (1969).
- (10) D. M. Hardy, S. D. Baker, and W. R. Boykin, Nucl. Instrum. Meth. 98, 141 (1971).
- (11) C. Leemann et al., Helv. Phys. Acta 44, 141 (1971).
- (12) R. G. Milner, R. D. McKeown, and C. E. Woodward, Nucl. Phys. A497, 495c (1989).
- (13) M. T. Alley and L. D. Knutson, Phys. Rev. C 48, 1890 (1993).
- (14) P. L. Anthony et al., Phys. Rev. D 54, 6620 (1996).
- (15) K. Kramer et al., Nucl. Instrum. Meth. A582, 318 (2007).
- (16) Varian Inc., http://www.varianinc.com.
- (17) E. Babcock et al., Phys. Rev. Lett. 91, 123003 (2003).
- (18) A. Couture et al., Bull. Am. Phys. Soc. 51, 20 (2006). http://meetings.aps.org/Meeting/SES06/Event/55436
- (19) B. Chann et al., J. Appl. Phys. 94, 6908 (2003).
- (20) http://www.qpclasers.com.
- (21) C. W. Arnold et al., Bull. Am. Phys. Soc. 51, 20 (2006). http://meetings.aps.org/Meeting/SES06/Event/55436
- (22) B. M. Fisher, Ph.D. thesis, University of North Carolina at Chapel HiIl (2003).
- (23) “The Stopping Range of Ions and Matter”, http://www.srim.org (2008).
- (24) G. G. Ohlsen and P. W. Keaton, Nucl. Instrum. Meth. 109, 41 (1973).
- (25) T. B. Clegg et al., Nucl. Instr. Meth. A357, 200 (1995).
- (26) P. Schwandt, T. B. Clegg, and W. Haberli, Nucl. Phys. A163, 432 (1971).
- (27) G. R. Plattner and A. D. Bacher, Phys. Lett. 36B, 211 (1971).
- (28) D. M. Hardy, et al., Phys. Lett. 31B, 355 (1970).
- (29) D. M. Hardy, et al., Nucl. Phys. A195, 250 (1970).
- (30) G. G. Ohlsen, Rep. Prog. Phys. 35, 717 (1972).
- (31) G. Szaloky and F. Seiler, Nucl. Phys. A303, 51 (1978).
- (32) E. A. George, private communication, 2006.
- (33) J. M. Blatt and L. C. Biedenharn, Phys. Rev. 24, 258 (1952).
- (34) F. James, MINUIT: Function Minimization and Error Analysis Reference Manual, 1994, CERN, http://wwwasdoc.web.cern.ch/wwwasdoc/minuit/minm ain.html.
- (35) M. T. Alley, Ph.D. thesis, University of Wisconsin-Madison, 1992
- (36) M. T. Alley and L. D. Knutson, Phys. Rev. C 48, 1901 (1993).
- (37) A. Deltuva and A. C. Fonseca, Phys. Rev. Lett. 98, 162502 (2007).
- (38) R. Machleidt, Phys. Rev. C 63, 024001 (2001).
- (39) R. B. Wiringa, V. G. J. Stoks, and R. Schiavilla, Phys. Rev. C 51, 38 (1995).
- (40) D. R. Entem and R. Machleidt, Phys. Rev. C 68, 041001(R) (2003).
- (41) P. Doleschall, Phys. Rev. C 69, 054001 (2004).
- (42) M. Viviani, to be published in Proc. of 19th Intern. IUPAP Conf. on Few-Body Problems in Physics, Bonn, Aug.31-Sept. 5, 2009, Eds. E. Epelbaum, H.-W. Hammer, U.-G. Meissner, EPJ Web of Conferences (2010).
- (43) M. Viviani, private communication, 2010.
- (44) V. Bernard, E. Epelbaum, H. Krebs, and Ulf-G. Meissner, Phys. Rev. C 77, 064004 (2008).
- (45) R. Machleidt, 28th Intern.Workshop on Nuclear Theory, Rila Mountains, Bulgaria, June 22-27, 2009. [http://arxiv.org/abs/0909.2881v1].